 Open Access Article
Thermo-responsive draw solute for forward osmosis process; poly(ionic liquid) having lower critical solution temperature characteristics
Changha Ju†
,
Chanhyuk Park†,
Taehyung Kim,
Shinwoo Kang and
Hyo Kang *
*
Department of Chemical Engineering, Dong-A University, 37 Nakdong-Daero 550beon-gil, Saha-gu, Busan 49315, Republic of Korea. E-mail: hkang@dau.ac.kr; Fax: +82 51 200 7728; Tel: +82 51 200 7720
First published on 18th September 2019
Abstract
We synthesized poly(4-vinylbenzyltributylammonium hexanesulfonate) (P[VBTBA][HS]), a poly(ionic liquid) that shows lower critical solution temperature (LCST), via the anion exchange reaction of poly(4-vinylbenzyltributylammonium chloride) (P[VBTBA][Cl]) with sodium hexanesulfonate in order to investigate its suitability as a draw solute for the forward osmosis (FO) process. P[VBTBA][Cl] was obtained by the free radical polymerization of (4-vinylbenzyltributylammonium chloride [VBTBA][Cl]) monomer acquired by the Menshutkin reaction. The FO performance and recovery properties of the synthesized materials were systematically investigated. For example, the LCST of P[VBTBA][HS] was observed to be ∼17 °C at 20 wt%, while no LCST was observed for [VBTBA][Cl] monomer and P[VBTBA][Cl] polymer before the anion exchange reaction, indicating that P[VBTBA][HS] can be recovered from the aqueous solution by heating it to above its LCST. Moreover, in an active layer facing the feed solution (AL-FS) system containing 20 wt% aqueous P[VBTBA][HS] solution at 15 °C, the water flux and reverse solute flux of P[VBTBA][HS] were found to be ∼5.85 L m−2 h−1 and 1.13 g m−2 h−1, respectively. Therefore, we studied the feasibility of using the poly(ionic liquid), a homopolymer having LCST characteristics, as a draw solute in the FO process.
1. Introduction
Since the global water shortage is becoming serious everywhere, a supply of clean water plays a crucial role in our lives.1,2 The development of water purification technologies is essential in the pursuit of this goal. As water purification technologies have been diversely developed over a long time, forward osmosis (FO) has been investigated with great research attention because of its unique features and some views on the problem of the energy crisis.3–5 Unlike conventional pressure-driven membrane processes, FO has several advantages such as low energy consumption,6,7 reduced membrane fouling potential,8 and easy membrane washing as compared with other methods.9 As an emerging membrane technology with low-energy consumption, FO having these merits has been widely studied for various applications such as seawater/brackish water desalination,10–12 wastewater treatment,13,14 power generation,15–17 food processing,18–20 removing metal ions21 and molecules,22 and concentration of pharmaceuticals.23–25 In the FO process, penetration of a semipermeable membrane by water molecules is driven by the osmotic pressure difference between the feed and draw solutions. The osmotic pressure, a driving force in the FO process, is a natural phenomenon that can render the energy consumption extremely low or almost zero;26 this could be one of the most charming aspects of FO under the stress of energy crisis. In order to finally obtain pure water, a recovery step of the draw solute is required to separate the draw solute and pure water in the draw solution.4 Even though many studies have been performed regarding the draw solute, there still a need for more research on the recovery methods and their energy efficiency in order to commercialize the FO process.27A draw solute is a key factor influencing the FO performance. An ideal draw solute should not only have high osmotic pressure for pure water production but also minimize the cost of reverse solute flux for replenishment.28 In addition, a facile method to recover the draw solute is essential for minimizing the overall cost of the FO process.29 In previous studies, many researchers have proposed a variety of draw solutes of diverse classes such as non-stimuli-responsive draw solutes10,30–34 and stimuli-responsive draw solutes.35–40 Recently, various stimuli-responsive draw solutes have been reported by many researchers. For example, there are many kinds of stimuli-responsive draw solutes such as CO2-responsive,35,40 magnetic-responsive,36 salt-responsive,37 and thermo-responsive draw solutes.38,39,41–47 One of them, the thermo-responsive draw solute, is attractive for separating the draw solute and pure water owing to its easy recovery via simple temperature control. Thermo-responsive draw solutes with either lower critical solution temperature (LCST) characteristic or upper critical solution temperature (UCST) characteristic can be applied, and these behaviors can be exploited to separate pure water and draw solute by controlling the solubility of the latter with temperature changes.36,41–45 Many researchers have explored different types of thermo-responsive draw solutes having LCST and UCST characteristics for the FO process, which include homopolymers,39,45 copolymers,38 oligomers,36,44 hydrogels,46,47 nanoparticles,48,49 and ionic liquids (ILs). The structures and thermo-responsive behaviors of ILs have been widely investigated over the decades.50 ILs are considered as adequate draw solutes owing to the apparent recovery process and continuous recycling42 as well as enough osmotic pressure induced by the ionic groups, which enables higher water flux.51 Further research is still required in terms of improving the FO performance and energy efficiency of the recovery method, because of its lower water flux than that of the reverse osmosis (RO) process and incomplete separation of the draw solute.52 The FO process using a thermo-responsive draw solute can be quickly implemented in the water treatment field compared with other stimuli-responsive draw solutes, as the required thermal energy can be easily harnessed from heat sources such as geothermal and solar energy as well as the waste heat of industries.53
In this study, we synthesized poly(4-vinylbenzyltributylammonium hexanesulfonate) (P[VBTBA][HS]), a poly(ionic liquid) having LCST behavior, as a possible draw solute candidate for the FO process. In addition, P[VBTBA][HS] is easy to synthesize via well-known reaction, cost of raw materials which were used for synthesis P[VBTBA][HS] is economic, and it is recyclable after FO process. The suitability of P[VBTBA][HS] as a next-generation draw solute for the FO process was investigated systematically. This study includes the evaluation of the FO performance and recovery process using this draw solute, and can potentially contribute to the development of novel draw solutes for the FO process.
2. Experimental
2.1. Reagents and instrumentation
4-Vinylbenzyl chloride (90%) and tributylamine (99.5%) were purchased from Sigma Aldrich Co., LLC., and 2,2′-azobis[2-(2-imidazolin-2-yl)propane]dihydrochloride (VA-044) was supplied by Wako Pure Chemical Industries, Ltd. Sodium hexanesulfonate (98%) was obtained from Tokyo Chemical Industry Co., Ltd. Diethyl ether (90%) and silver nitrate were acquired from Dae-Jung Chemicals & Metals Co., Ltd. All chemicals were used as received. Distilled water from a Human Power I+ water system (Human Co., Korea) was used in all experiments. Proton nuclear magnetic resonance (1H-NMR) analysis was performed on an Agilent MR400 DD2 NMR spectrometer to identify the synthesized structure. Fourier transform-infrared (FT-IR) spectroscopy was performed on a Thermo Fisher Scientific Nicolet 380 FT-IR spectrometer for structural analysis through functional group identification. The FT-IR analysis was conducted in the attenuated total reflection mode between 4000 and 670 cm−1. Ion chromatography was performed on a Dionex ICS-3000 ion chromatograph system to identify existence of chloride ions after anion exchange to hexanesulfonate ions. The rheological properties of the draw solution samples were determined with TA Instrument AR G2 stress control type. After preparing a draw solution at a given concentration, the osmotic pressure of sample was determined by measuring its freezing point with Semi-Micro Osmometer K-7400, Knauer, and the electrical conductivity was measured using a METTLER TOLEDO Seven2Go pro conductivity meter. The LCST was determined by observing the transmittance at the wavelength of 550 nm using an ultraviolet-visible (UV-Vis) spectrophotometer (V-1100 digital spectrophotometer, EMCLAB instruments) coupled with a temperature controller (TC-200P, Misung Scientific. Co. Ltd.). The water flux was assessed by measuring the difference in the height of the draw solution in a custom-made U-shaped tube before and after the FO operation. The reverse solute flux was observed by comparing the conductivity difference before and after the FO test with a METTLER TOLEDO Seven2Go pro conductivity meter.2.2. Preparation of 4-vinylbenzyltributylammonium chloride ([VBTBA][Cl])
4-Vinylbenzyl chloride (10 g, 0.066 mol) and tributylamine (12.23 g, 0.066 mol) were dissolved in acetonitrile (30 mL). Then, the mixture was magnetically stirred at 40 °C for 24 h under a nitrogen atmosphere. The resultant solution was poured into diethyl ether to obtain a white precipitate, which was separated by filtration. The monomer, 4-vinylbenzyltributylammonium chloride ([VBTBA][Cl]), was finally recovered after vacuum drying at room temperature (yield > 80%).1H-NMR of [VBTBA][Cl] [400 MHz, D2O, δ/ppm]: 0.72–0.78 (t, 9H, (–N+–CH2–CH2–CH2–CH3)), 1.07–1.18 (m, 6H, (–N+–CH2–CH2–CH2–CH3)), 1.62–1.71 (m, 6H, (–N+–CH2–CH2–CH2–CH3)), 3.99–4.05 (t, 6H, (–N+–CH2–CH2–CH2–CH3)), 5.19–5.21 (s, 2H, (–N+–CH2–Ph–)), 5.68–5.75 (d, 1H, (CH2![[double bond, length as m-dash]](https://www.rsc.org/images/entities/char_e001.gif) CH–Ph–)), 6.58–6.62 (d, 1H, (CH2
CH–Ph–)), 6.58–6.62 (d, 1H, (CH2![[double bond, length as m-dash]](https://www.rsc.org/images/entities/char_e001.gif) CH–Ph–)), 6.63–6.68 (t, 1H, (CH2
CH–Ph–)), 6.63–6.68 (t, 1H, (CH2![[double bond, length as m-dash]](https://www.rsc.org/images/entities/char_e001.gif) CH–Ph–)), 7.21–7.24 (d, 2H, (CH2
CH–Ph–)), 7.21–7.24 (d, 2H, (CH2![[double bond, length as m-dash]](https://www.rsc.org/images/entities/char_e001.gif) CH–Ph–)), 7.37–7.41 (d, 2H, (CH2
CH–Ph–)), 7.37–7.41 (d, 2H, (CH2![[double bond, length as m-dash]](https://www.rsc.org/images/entities/char_e001.gif) CH–Ph–)).
CH–Ph–)).
2.3. Synthesis of poly(4-vinylbenzyltributylammonium chloride) (P[VBTBA][Cl])
[VBTBA][Cl] (5 g) and 2,2′-azobis[2-(2-imidazolin-2-yl)propane] dihydrochloride (VA-044) (0.24 g, 20 mol% of [VBTBA][Cl]) were mixed with distilled water (50 mL) and stirred for 24 h while maintaining the temperature at 80 °C under a nitrogen atmosphere. The resultant solution was then added to a dialysis tube (Membrane Filtration Products, Inc., Cellu·Sep T1 (molecular weight cut off: 3500 Da)) for 24 h in order to remove the impurities by dialysis. P[VBTBA][Cl] was finally obtained by removing water from the dialyzed solution through vacuum drying at 50 °C (yield > 90%).1H-NMR of P[VBTBA][Cl] [400 MHz, D2O, δ/ppm]: 0.61–0.81 (m, 14H, (–N+–CH2–CH2–CH2–CH3), (–CH2–CH–)), 1.11–1.26 (m, 6H, (–N+–CH2–CH2–CH2–CH3)), 1.35–1.70 (m, 6H, (–N+–CH2–CH2–CH2–CH3)), 2.89–3.05 (t, 6H, (–N+–CH2–CH2–CH2–CH3)), 4.42–4.43 (s, 2H, (–N+–CH2–Ph–)), 7.24–7.30 (d, 2H, (CH2–CH–Ph–)), 7.37–7.41 (d, 2H, (CH2–CH–Ph–)).
2.4. Anion exchange reaction of P[VBTBA][Cl] to obtain P[VBTBA][HS]
P[VBTBA][Cl] (5 g) and sodium hexanesulfonate (2.78 g, 100 mol% of P[VBTBA][Cl]) were mixed with distilled water (50 mL) for the anion exchange reaction. The mixed solution was stirred at approximately 4 °C for 6 h under a nitrogen atmosphere. The resultant solution was dialyzed in hot water for 6 h to remove impurities. P[VBTBA][HS] was finally obtained by removing water from the dialyzed solution through vacuum drying at 50 °C (yield > 80%).1H-NMR of P[VBTBA][HS] [400 MHz, D2O, δ/ppm]: 0.61–0.81 (m, 17H, (–N+–CH2–CH2–CH2–CH3), (–CH2–CH–), (–SO3−–CH2–CH2–CH2–CH2–CH2–CH3)), 1.13–1.38 (m, 10H, (–N+–CH2–CH2–CH2–CH3), (–SO3−–CH2–CH2–CH2–CH2–CH2–CH3)), 1.35–1.70 (m, 8H, (–N+–CH2–CH2–CH2–CH3), (–SO3−–CH2–CH2–CH2–CH2–CH2–CH3)), 2.73–2.81 (t, 2H, (–SO3−–CH2–CH2–CH2–CH2–CH2–CH3)), 2.81–3.28 (t, 6H, (–N+–CH2–CH2–CH2–CH3)), 4.05–4.65 (s, 2H, (–N+–CH2–Ph–)), 7.24–7.30 (d, 2H, (CH2–CH–Ph–)), 7.37–7.41 (d, 2H, (CH2–CH–Ph–)).
2.5. Forward osmosis performance
The water flux was measured in a small-scale FO system using a custom-made U-shaped glass tube facing two L-shaped glass tubes using a clamp. We used a commercial thin film composite FO membrane (Hydration Technologies Inc.), HTI-TFC, whose structure parameter is greater than 1000 μm, in the system. The P[VBTBA][HS] draw solution was poured into one tube and the feed solution was poured into the other. The water flux was measured in the active layer facing the feed solution (AL-FS) mode. The glass tube was placed in a water bath to maintain a constant temperature. The temperatures of both the draw and feed solutions were maintained at 15 ± 1 °C during the FO process because P[VBTBA][HS] becomes insoluble, caused by globule formation of polymer, above the LCST of 21 °C. Draw solutions were prepared from the synthesized P[VBTBA][Cl] and P[VBTBA][HS], and pure water and 0.6 M NaCl aqueous solution were used as the feeds. The draw and feed solutions were stirred with a magnetic bar rotated using a solenoid (AS ONE, OCTOPUS CS-4) during the FO process. The water flux (Jw, (L m−2 h−1, abbreviated as LMH)) was calculated from the volume change of the draw solution using eqn (1).
 | (1) |
The reverse solute flux (Js) was also investigated by analyzing the quantity of the solute that diffused from the draw solution into the feed solution during the FO process and the total dissolved solid (TDS) of the feed solution was measured. The reverse solute flux (Js, g m−2 h−1, abbreviated as gMH) was measured by comparing the TDS of the feed solution before and after the FO process, using eqn (2).
 | (2) |
3. Results and discussion
3.1. Synthesis and characterization of P[VBTBA][HS]
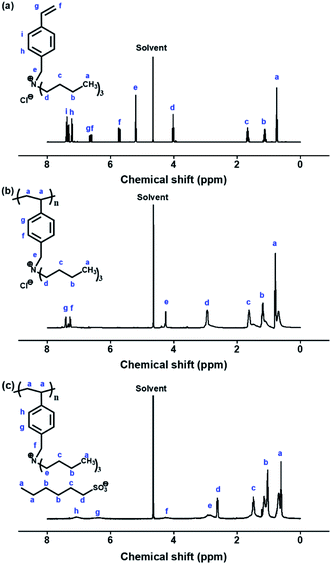
The synthetic route to P[VBTBA][HS], which has the chemical structure of a poly(ionic liquid), is shown in Fig. 1. The P[VBTBA][HS] complex was synthesized via anion exchange reaction of P[VBTBA][Cl] with sodium hexanesulfonate. P[VBTBA][Cl] was synthesized by free radical polymerization of the monomer, 4-[VBTBA][Cl], prepared by Menshutkin reaction using 4-vinylbenzyl chloride and tributylamine as reactants.The chemical compositions of the synthesized complexes were confirmed by 1H-NMR and FT-IR spectroscopic analysis prior to FO experiments. The 1H-NMR spectra and assignments of the respective peaks of [VBTBA][Cl], P[VBTBA][Cl], and P[VBTBA][HS] are shown in Fig. 2. The 1H-NMR spectrum and assignments of the respective peaks of the monomer, [VBTBA][Cl] are presented in Fig. 2(a). This 1H-NMR spectrum demonstrates the presence of protons from the vinyl group of [VBTBA][Cl] (δ = 5.68–5.75, 6.58–6.62 (peak f), and 6.63–6.68 ppm (peak g)) and the proton peaks from the phenyl ring of the styrene moiety (δ = 7.21–7.24 (peak h) and 7.37–7.41 ppm (peak i)). Further, the proton peaks from alkyl groups of tributylamine (δ = 0.72–0.78 (peak a), δ = 1.07–1.18 (peak b), δ = 1.62–1.71 (peak c), and δ = 3.99–4.05 ppm (peak d)) indicate the inclusion of tributylamine moieties in [VBTBA][Cl]. We synthesized P[VBTBA][Cl] via free radical polymerization after confirming the successful preparation of [VBTBA][Cl]. The data in Fig. 2(b) clearly prove that P[VBTBA][Cl] was successfully polymerized because the vinyl group (δ = 5.68–5.75 and 6.63–6.68 ppm) disappeared with the maintenance of almost all other proton peaks of [VBTBA][Cl]. Finally, the synthesis of P[VBTBA][HS] was confirmed based on the increase in the proton peaks after the anion exchange reaction with sodium hexanesulfonate after the identification of the successfully polymerized P[VBTBA][Cl], as shown in the 1H-NMR spectrum of P[VBTBA][HS] (Fig. 2(c)). The 1H-NMR spectrum of P[VBTBA][HS] demonstrates the presence of more protons in the alkyl region than that of P[VBTBA][Cl], which was determined by integrating the total number of protons. Based on the 1H-NMR spectra of the prepared complexes, we confirmed the successful production of P[VBTBA][HS] used as a draw solute in this study.
Furthermore, P[VBTBA][Cl] and P[VBTBA][HS] were analyzed by FT-IR spectroscopy to confirm the conversion of P[VBTBA][Cl] to P[VBTBA][HS] through anion exchange. Comparison of the infrared spectra of P[VBTBA][Cl] and P[VBTBA][HS] confirmed the presence of the sulfone group in the latter; the O![[double bond, length as m-dash]](https://www.rsc.org/images/entities/char_e001.gif) S
S![[double bond, length as m-dash]](https://www.rsc.org/images/entities/char_e001.gif) O stretching peak at 1037 cm−1 and the –S–O− stretching peak at 1184 cm−1 were observed only in the FT-IR spectrum of P[VBTBA][HS] (Fig. 3). The FT-IR peaks of the sulfonate groups appeared at wavenumbers similar to those of sulfonate groups reported previously.54,55
O stretching peak at 1037 cm−1 and the –S–O− stretching peak at 1184 cm−1 were observed only in the FT-IR spectrum of P[VBTBA][HS] (Fig. 3). The FT-IR peaks of the sulfonate groups appeared at wavenumbers similar to those of sulfonate groups reported previously.54,55
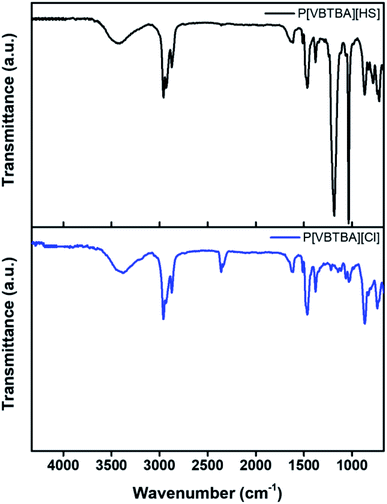 | ||
| Fig. 3 Fourier transform-infrared (FT-IR) spectra of poly(4-vinylbenzyltributylammonium chloride) (P[VBTBA][Cl]) and poly(4-vinylbenzyltributylammonium hexanesulfonate) (P[VBTBA][HS]). | ||
To verify conversion to hexanesulfonate ions of P[VBTBA][HS], we confirmed existence of chloride ions, via qualitative analysis, using silver nitrate. If chloride ions are not converted perfectly, a white precipitate of silver chloride will be formed when silver nitrate is added into solution of P[VBTBA][HS].56 When we dropped sliver nitrate into P[VBTBA][HS] solution, white precipitate was not observed in naked eyes. For close examination, quantitative analysis was performed by ion chromatography to confirm the concentration of chloride ions in P[VBTBA][HS] solution and it was measured to be approximately 0%. Consequently, we figured out that conversion of chloride ions to hexanesulfonate ions was almost 100%. Therefore, P[VBTBA][HS] was synthesized successfully and it was confirmed by 1H-NMR, FT-IR, and ion chromatography analysis.
3.2. Viscosity
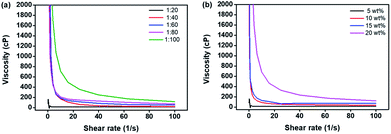
The viscosity of a draw solution can be key factor that affects the water flux in the FO process. A high viscosity of draw solution can induce concentration polarization (CP), which is subdivided into internal and external CP, in and/or on the membrane. Because this phenomenon significantly reduces the effective osmotic pressure during the FO process, the viscosity of the draw solution greatly affects the FO performance.57 We investigated the viscosity of the P[VBTBA][HS] solution according to the polymerization ratio (feed ratio of the initiator and monomer in the polymerization). The viscosities of the P[VBTBA][HS] solutions were measured at 10 °C by varying the shear rate from 0.1 to 100 s−1 because the phase separation temperature (LCST) of P[VBTBA][HS] is higher than 10 °C, as will be discussed later. Fig. 4(a) shows the viscosity according to the polymerization ratio. The viscosities of P[VBTBA][HS] solutions were found to be approximately 12.99, 19.36, 45.12, 70.81, and 116.00 cP according to the initiator![[thin space (1/6-em)]](https://www.rsc.org/images/entities/char_2009.gif) :
:![[thin space (1/6-em)]](https://www.rsc.org/images/entities/char_2009.gif) monomer ratios of 1
monomer ratios of 1![[thin space (1/6-em)]](https://www.rsc.org/images/entities/char_2009.gif) :
:![[thin space (1/6-em)]](https://www.rsc.org/images/entities/char_2009.gif) 20, 1
20, 1![[thin space (1/6-em)]](https://www.rsc.org/images/entities/char_2009.gif) :
:![[thin space (1/6-em)]](https://www.rsc.org/images/entities/char_2009.gif) 40, 1
40, 1![[thin space (1/6-em)]](https://www.rsc.org/images/entities/char_2009.gif) :
:![[thin space (1/6-em)]](https://www.rsc.org/images/entities/char_2009.gif) 60, 1
60, 1![[thin space (1/6-em)]](https://www.rsc.org/images/entities/char_2009.gif) :
:![[thin space (1/6-em)]](https://www.rsc.org/images/entities/char_2009.gif) 80, and 1
80, and 1![[thin space (1/6-em)]](https://www.rsc.org/images/entities/char_2009.gif) :
:![[thin space (1/6-em)]](https://www.rsc.org/images/entities/char_2009.gif) 100 at 10 °C, respectively, in the polymerization mixture. As expected, the viscosity of the draw solution prepared at the lowest initiator
100 at 10 °C, respectively, in the polymerization mixture. As expected, the viscosity of the draw solution prepared at the lowest initiator![[thin space (1/6-em)]](https://www.rsc.org/images/entities/char_2009.gif) :
:![[thin space (1/6-em)]](https://www.rsc.org/images/entities/char_2009.gif) monomer ratio was found to be the lowest. Therefore, we selected the draw solution having the lowest viscosity for the evaluation of the FO performance, because a relatively minimized CP phenomenon induced by the low viscosity of a draw solution can increase the water flux during the FO process. As shown in Fig. 4(b), the viscosities of P[VBTBA][HS] were approximately 12.99, 35.54, 74.50, and 119.60 cP according to concentrations of 5, 10, 15, and 20 wt% at 10 °C, respectively. Therefore, the viscosity of the P[VBTBA][HS] solution tends to increase with increasing initiator
monomer ratio was found to be the lowest. Therefore, we selected the draw solution having the lowest viscosity for the evaluation of the FO performance, because a relatively minimized CP phenomenon induced by the low viscosity of a draw solution can increase the water flux during the FO process. As shown in Fig. 4(b), the viscosities of P[VBTBA][HS] were approximately 12.99, 35.54, 74.50, and 119.60 cP according to concentrations of 5, 10, 15, and 20 wt% at 10 °C, respectively. Therefore, the viscosity of the P[VBTBA][HS] solution tends to increase with increasing initiator![[thin space (1/6-em)]](https://www.rsc.org/images/entities/char_2009.gif) :
:![[thin space (1/6-em)]](https://www.rsc.org/images/entities/char_2009.gif) monomer ratio and concentration, as expected from the results of other draw solutes.37,58,59
monomer ratio and concentration, as expected from the results of other draw solutes.37,58,59
3.3. Electrical conductivity & osmotic pressure
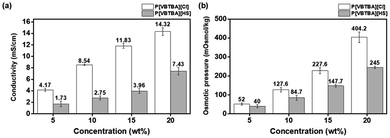
Electrical conductivity refers to the degree of electrical activity of the draw solution and a high ion level in the draw solution elevates it if the electricity is susceptible.60 Such an increase in the electrical conductivity could be attributed to the degree of generation of ions in the aqueous solution. The degree of ion generation is closely related to the osmotic pressure, as will be mentioned later. The electrical conductivity of the P[VBTBA][Cl] aqueous solution was measured in the same way and compared with that of the aqueous solution of P[VBTBA][HS] obtained after anion exchange reaction. The electrical conductivity of P[VBTBA][Cl] and P[VBTBA][HS] according to their concentration is shown in Fig. 5(a). The electrical conductivity increases with increasing concentration of the draw solution since the poly(ionic liquid) dissociates and the ions are conductive in aqueous solutions.61 For example, the electrical conductivity of the P[VBTBA][Cl] solution increases from approximately 4.17 mS cm−1 to 8.54, 11.83, and 14.32 mS cm−1 when its concentration increases from 5 to 10, 15, and 20 wt%, respectively while that of P[VBTBA][HS] is approximately 1.73, 2.75, 3.96, and 7.43 mS cm−1 for the same concentrations, indicating that the electrical conductivity of P[VBTBA][Cl] in aqueous solution is a higher than that of P[VBTBA][HS] at the same concentration. Generally, the electrical conductivity of an aqueous solution is influenced by major factors such as the ion activity and ion mobility.62 According to the Debye–Hückel theory, ion activity, one of the determinants of the electrical conductivity, is susceptible to the ion size and ionic strength.63 [VBTBA][Cl] and P[VBTBA][HS] are comprised of different anions, i.e., chloride and hexanesulfonate, respectively. While hexanesulfonate is larger than chloride, because of the bulky hydrophobic n-hexyl group, it has lower ionic strength than that of chloride; as a result, hexanesulfonate has relatively lower ion activity than that of chloride.64 Moreover, it is also known that the electrical conductivity correlates with the ion mobility.65 The larger size of the hexanesulfonate than that of the chloride ion imposes further constraints on its mobility in an aqueous solution. As the ion size increases, the anion in the viscous liquid is expected to move slowly, because a high fluid resistance is exerted on the large ion.62 Therefore, the electrical conductivity of P[VBTBA][HS] in an aqueous solution is lower than that of P[VBTBA][Cl], owing to its lower ion activity and ionic mobility.The FO process is operated by the osmotic pressure gradient between the feed and draw solutions to generate a driving force for water transport through the semipermeable membrane. The higher osmotic pressure of the draw solution than that of feed solution can create a driving force for water transport from the feed solution, causing higher water flux to the draw solution in the FO process.50 In order to investigate the suitability of P[VBTBA][HS] as a draw solute, we measured the osmotic pressure by the freezing point depression method. For comparison, the osmotic pressure of its precursor, P[VBTBA][Cl], was also measured by the same method. Fig. 5(b) compares the osmotic pressures of P[VBTBA][Cl] and P[VBTBA][HS] solutions according to their concentrations. The osmotic pressure of P[VBTBA][Cl] was measured to be approximately 52.0, 127.6, 227.6, and 404.2 mOsmol kg−1 at concentrations of 5, 10, 15, and 20 wt%, respectively. On the other hand, the osmotic pressure of P[VBTBA][HS] was measured to be lower than that of P[VBTBA][Cl]. For example, the measured osmotic pressure is approximately 40.0, 127.6, 227.6, and 245.0 mOsmol kg−1 at 5, 10, 15, and 20 wt%, respectively. Similar to the result of the electrical conductivity (Fig. 5), the osmotic pressure of P[VBTBA][HS] is lower than that of P[VBTBA][Cl] in the same concentration range of 5 to 20 wt%. According to the Van't Hoff equation, the osmotic pressure correlates with the Van't Hoff coefficient,66 which is a dominant factor affecting the solubility of a solute.67 It has been previously reported that the molecular polarity and size are the significant determinants of the solubility in water, which means that decreasing the molecular polarity and increasing the size can result in a decrease in the solubility.10 In other words, P[VBTBA][Cl] having relatively higher polarity and smaller size of anionic moiety can have higher solubility than P[VBTBA][HS] in the aqueous state, and thus it can induce relatively higher osmotic pressure than P[VBTBA][HS].68 The osmotic pressure is correlated with the water flux in the FO process, which is discussed later.
3.4. Water flux and reverse solute flux
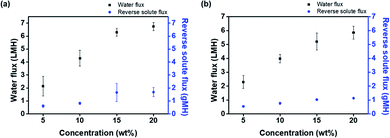
The water flux and reverse solute flux were determined in an active layer facing feed solution (AL-FS) method using custom-made glass tubes. A thin film composite FO membrane was placed between two connecting glass tubes. One side was filled with the feed solution, while the other side was filled with the draw solution, P[VBTBA][Cl] or P[VBTBA][HS] aqueous solutions at various concentrations (5–20 wt%). Fig. 6 shows the water flux and reverse solute flux of P[VBTBA][Cl] and P[VBTBA][HS]. The measurements were carried out at a temperature of 15 °C, which is below the LCST, as will be mentioned later. The concentration of the draw solution is important in the FO performance because a high concentration of the draw solution induces a high osmotic pressure, thereby improving the water flux in the FO process.30 As expected, the water fluxes of P[VBTBA][Cl] and P[VBTBA][HS] improved with increasing concentration. For example, the water flux of P[VBTBA][Cl] was measured to be approximately 2.14, 4.29, 6.29, and 6.74 LMH at concentrations of 5, 10, 15, and 20 wt%, respectively. However, the water flux of P[VBTBA][HS] was lower than that of P[VBTBA][Cl]; it was measured to be approximately 2.29, 3.98, 5.21, and 5.85 LMH at the corresponding concentrations under the same condition, indicating that a higher osmotic pressure induces a higher water flux. Electrical conductivity and osmotic pressure are colligative properties that depend on the number of particles in solution. Therefore, electrical conductivity and osmotic pressure increased in direct proportion to the concentration of draw solution.69,70 On the other hand, the increment in water flux with increasing concentration of P[VBTBA][Cl] and P[VBTBA][HS] was gradually decreased owing to internal and external concentration polarization which reduce osmotic pressure during FO process as reported by other research groups.71–73 The measurements of the reverse solute flux of P[VBTBA][Cl] and P[VBTBA][HS] were simultaneously carried out with the measurement of the water flux and reverse solute flux was determined by confirming the difference in the total dissolved solid in the feed solution before and after the FO process. Previous studies have shown that the optimum operation of the FO process requires smaller size of the draw solute than the average pore size of the membrane in order to reduce the back diffusion of the draw solution.74 The reverse solute flux of P[VBTBA][Cl] was measured to be approximately 0.61, 0.82, 1.65, and 1.68 gMH, respectively. However, the reverse solute flux of P[VBTBA][HS] increased slightly from 0.54 to 1.13 gMH when its concentration increased from 5 to 20 wt%. Unlike the water flux, the reverse solute flux, the back diffusion from the draw solution to the feed solution was confirmed to be very low in the measured concentration ranges. To compare FO performance of P[VBTBA][Cl] and P[VBTBA][HS] with other draw solute, we prepared conventional sodium chloride draw solution. When sodium chloride was used as a draw solute, water flux was measured to be 7.69, 16.88, 23.13, and 31.24 LMH at concentrations of 5, 10, 15, and 20 wt%, respectively. However, after FO process, the reverse solute flux was measured 6.57, 10.78, 13.43, and 16.08 gMH, at the corresponding concentrations under same condition. This result implies that sodium chloride, whose molecular size is smaller than P[VBTBA][Cl] and P[VBTBA][HS], was diffused through the membrane toward feed solution which was considerably higher than that of P[VBTBA][Cl] and P[VBTBA][HS]. To explore recyclable property of the P[VBTBA][HS], water flux was measured using 20 wt% solution of P[VBTBA][HS] as draw solution and distilled water as feed solution for several time. As shown in Fig. 7(a), the FO performance of P[VBTBA][HS] can be maintained through four runs. Fig. 7(b), support the recyclability of P[VBTBA][HS]; osmotic pressure of P[VBTBA][HS] at fourth run was nearly same as that of first run P[VBTBA][HS]. We will discuss the recovery properties of P[VBTBA][Cl] and P[VBTBA][HS] in order to determine suitable draw solutes for the FO process in the next section.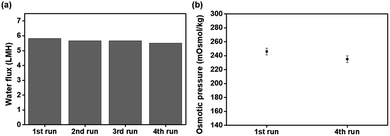 | ||
| Fig. 7 (a) Water flux and (b) osmotic pressure of 20 wt% of poly(4-vinylbenzyltributylammonium hexanesulfonate) (P[VBTBA][HS]) as a draw solution and distilled water as a feed solution. | ||
3.5. Recovery properties
In the FO process, a recovery process of the draw solution is necessary to separate the draw solute from the draw solution to finally recover pure water,75 which enables continued recycling of draw solutes. We confirmed the regeneration of the draw solution using its thermo-responsive property for recovery in order to investigate the feasibility of using the draw solute in a FO process. At first, the [VBTBA][Cl] and P[VBTBA][Cl] aqueous solutions did not show any changes in the transmittance in the visible light region according to the temperature change from 0 to 100 °C (data not shown). The [VBTBA][Cl] and P[VBTBA][Cl] cannot be separated from water in the solution, indicating that they do not have thermo-responsive property. However, P[VBTBA][HS] aqueous solution was found to have a critical temperature at which the phase change was observed according to the temperature, which plays a vital role in imparting recovery property to P[VBTBA][HS] for the FO process. When the temperature of the P[VBTBA][HS] aqueous solution was lower than the critical temperature, P[VBTBA][HS] aqueous solution remained homogeneous and transparent. However, when the temperature of the solution was higher than the critical temperature, the P[VBTBA][HS] aqueous solution underwent phase separation to form a white opaque solution. The critical temperature at which the P[VBTBA][HS] aqueous solution phase separates was carefully determined by measuring the transmittance of the solution according to the temperature using a UV-Vis spectrophotometer. Fig. 8 shows the transmittance of the P[VBTBA][HS] aqueous solution according to the temperature. We can confirm that P[VBTBA][HS] has LCST characteristic, which is one of the thermo-responsive properties. The critical temperature for the phase separation between P[VBTBA][HS] and water was found to be approximately 21, 19, 18, and 17 °C at concentrations of 5, 10, 15, and 20 wt%, respectively, which is equivalent to the LCST of the P[VBTBA][HS] aqueous solution. Therefore, P[VBTBA][HS] aqueous solution can be simply separated from water by controlling the solubility by changing the temperature. When the solution temperature is lower than the LCST, the ion–water interaction becomes stronger than the ion–ion interaction between the quaternary ammonium cation and sulfonate anion moieties, and then P[VBTBA][HS] and water form a homogeneous phase. As a consequence, the draw solutes can be dissolved stably in an aqueous solution below their LCST via ion–water interaction between cation/anions in the polymer chains and water molecules.76,77 However, when the solution temperature is higher than the LCST, the ion–ion interaction between the quaternary ammonium cation and sulfonate anion moieties is stronger than the ion–water interactions, causing the polymer chains to aggregate, and as a result, P[VBTBA][HS] forms a heterogeneous phase with water. As the solution temperature increases consistently, intra/intermolecular interactions become active between the nonpolar n-hexyl groups in P[VBTBA][HS], which causes aggregation and separation of the draw solute from the aqueous solution.78,79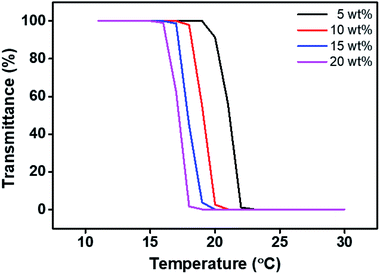 | ||
| Fig. 8 The transmittance curve of the poly(4-vinylbenzyltributylammonium hexanesulfonate) (P[VBTBA][HS]) solution according to the temperature change. | ||
3.6. Desalination performance
To investigate the feasibility of the P[VBTBA][HS] for desalination applications using the FO process, water flux was measured using the P[VBTBA][HS] as a draw solution and 0.6 M NaCl solution as a feed solution. The water flux under the simulated seawater condition was also measured in the AL-FS mode, which is the same method except for the feed condition, as previously described in this paper. The water flux at 0.6 M NaCl feed was measured to be approximately 0, 1.53, 2.45, and 2.91 LMH at concentrations of 5, 10, 15, and 20 wt% of P[VBTBA][HS], respectively (Fig. 9). The water fluxes using 0.6 M NaCl as a feed solution in the FO process were measured to be lower than those of pure water as a feed solution in the measured concentration range. Different water fluxes with same draw solution depending on the salinity of the feed solution is ascribed to the osmotic pressure difference between the feed and draw solutions across the membrane.37 Water fluxes using the 0.6 M NaCl as a feed solution decrease to approximately 50%, as compared with those using pure water as a feed solution under the same condition. Therefore, we believe that the draw solute proposed in this study can sufficiently produce pure water at the simulated seawater condition (0.6 M NaCl used as a feed solution). In addition to the desalination technology, the novel and next-generation polymeric draw solute, P[VBTBA][HS], is expected to be applied in various water treatment processes including in niche market such as rare element recovery and oil separation.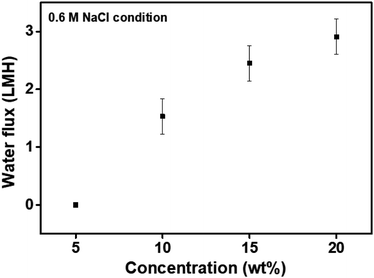 | ||
| Fig. 9 Water flux of poly(4-vinylbenzyltributylammonium hexanesulfonate) (P[VBTBA][HS]) at a 0.6 M NaCl feed solution according to the concentration at 15 °C. | ||
4. Conclusions
We synthesized P[VBTBA][HS] via anion exchange of the chloride ion of P[VBTBA][Cl] with sodium hexanesulfonate to investigate the feasibility of using it as a draw solute in the FO process. P[VBTBA][Cl] was obtained by the free radical polymerization of [VBTBA][Cl] prepared by the Menshutkin reaction. First, in aqueous solution, [VBTBA][Cl] and P[VBTBA][Cl] did not show the LCST property. However, P[VBTBA][HS] having both the quaternary ammonium cation and sulfonate anion moieties was found to show LCST characteristic, which plays an important role in the recovery of P[VBTBA][HS] after the FO process. For example, LCST of P[VBTBA][HS] was identified to be approximately 17 °C at 20 wt% concentration. The water flux and reverse solute flux of P[VBTBA][HS] were measured to be approximately 5.85 LMH and 1.27 gMH using pure water as a feed solution and 20 wt% aqueous solution as a draw solution, and 15 °C as an operating temperature in the active layer facing feed solution mode. In addition, P[VBTBA][HS] showed promise for desalination application owing to the possibility of producing pure water from 0.6 M NaCl feeds imitating the artificial seawater condition. For example, the water flux of P[VBTBA][HS] with 0.6 M NaCl feed was measured to be approximately 2.91 LMH at 20 wt% aqueous solution used as a draw solution and 15 °C as an operating temperature. Based on the above results, P[VBTBA][HS] can be a next-generation draw solute candidate owing to the good FO performance and the efficient recovery method. As a result, this research can encourage deep understanding to develop draw solutes for an FO process and provide new idea for the design and synthesis of thermo-responsive organic materials.Conflicts of interest
There are no conflicts to declare.Acknowledgements
This research was supported by Basic Science Research Program through the National Research Foundation of Korea (NRF) funded by the Ministry of Education (NRF-2018R1D1A1B07040526). Financial supports by the Dong-A University Research Fund are gratefully acknowledged.Notes and references
- R. F. service, Science, 2006, 313, 1088–1090 CrossRef CAS PubMed.
- A. Y. Hoekstra, Nat. Clim. Change, 2014, 4, 318–320 CrossRef.
- B. D. Coday, B. G. M. Yaffe, P. Xu and T. Y. Cate, Environ. Sci. Technol., 2014, 48, 3612–3624 CrossRef CAS PubMed.
- R. V. Linares, Z. Li, S. Sarp, Sz. S. Bucs, G. Amy and J. S. Vrouwenvelder, Water Res., 2014, 66, 122–139 CrossRef PubMed.
- M. Wilf, Desalin. Water Treat., 2010, 15, 292–298 CrossRef.
- Y.-J. Choi, J.-S. Choi, H.-J. Oh, S. Lee, D. R. Yang and J. H. Kim, Desalination, 2009, 247, 239–246 CrossRef CAS.
- R. K. McGovern and J. H. Lienhard V, J. Membr. Sci., 2014, 469, 245–250 CrossRef CAS.
- A. Achilli, T. Y. Cath, E. A. Marchand and A. E. Childress, Desalination, 2009, 239, 10–21 CrossRef CAS.
- B. Mi and M. Elimelech, J. Membr. Sci., 2010, 348, 337–345 CrossRef CAS.
- J. R. McCutcheon, R. L. McGinnis and M. Elimelech, Desalination, 2005, 174, 1–11 CrossRef CAS.
- G. Gwak, B. Jung, S. Han and S. Hong, Water Res., 2015, 80, 294–305 CrossRef CAS PubMed.
- Y. Wu, W. Zhang and Q. Ge, ACS Sustainable Chem. Eng., 2018, 6, 14170–14177 CrossRef CAS.
- L. A. Hoover, W. A. Philip, A. Tiraferri, N. Y. Yip and M. Elimelech, Environ. Sci. Technol., 2011, 45, 9824–9830 CrossRef CAS PubMed.
- P. Pal, M. Sardar, M. Pal, S. Chakrabortty and J. Nayak, Comput. Chem. Eng., 2019, 127, 99–110 CrossRef CAS.
- R. L. McGinnis and M. Elimelech, Environ. Sci. Technol., 2008, 42, 8625–8629 CrossRef CAS PubMed.
- A. Achilli, T. Y. Cath and A. E. Childress, J. Membr. Sci., 2009, 343, 42–52 CrossRef CAS.
- Z. L. Cheng, X. Li and T.-S. Chung, J. Membr. Sci., 2018, 559, 63–74 CrossRef CAS.
- B. Jiao, A. Cassano and E. Drioli, J. Food Eng., 2004, 63, 303–324 CrossRef.
- K. B. Petrotos and H. N. Lazarides, J. Food Eng., 2001, 49, 201–206 CrossRef.
- P. Menchik and C. I. Moraru, J. Food Eng., 2019, 253, 40–48 CrossRef CAS.
- Q. Chen, W. Xu and Q. Ge, Environ. Sci. Technol., 2018, 52, 4464–4471 CrossRef CAS PubMed.
- Q. Ge, C. H. Lau and M. Liu, Environ. Sci. Technol., 2018, 52, 3812–3819 CrossRef CAS PubMed.
- Q. Yang, K. Y. Wang and T. S. Chung, Sep. Purif. Technol., 2009, 69, 267–274 CrossRef.
- Q. Ge and T.-S. Chung, Chem. Commun., 2015, 51, 4854–4857 RSC.
- Y. Cui and T.-S. Chung, Nat. Commun., 2018, 9, 1426 CrossRef PubMed.
- D. Zhao, P. Wang, Q. Zhao, N. Chen and X. Lu, Desalination, 2014, 348, 26–32 CrossRef CAS.
- S. Zou, H. Yuan, A. Childress and Z. He, Environ. Sci. Technol., 2016, 50, 6827–6829 CrossRef CAS PubMed.
- T.-S. Chung, S. Zhang, K. Y. Wang, J. Su and M. M. Ling, Desalination, 2012, 287, 78–81 CrossRef CAS.
- L. Chekli, S. Phuntsho, H. K. Shon, S. Vigneswaran, J. Kandasamy and A. Chanan, Desalin. Water Treat., 2012, 43, 167–184 CrossRef CAS.
- A. Achilli, T. Y. Cath and A. E. Childress, J. Membr. Sci., 2010, 364, 233–241 CrossRef CAS.
- S. Phuntsho, H. K. Shon, S. Hong, S. Lee and S. Vigneswaran, J. Membr. Sci., 2011, 375, 172–181 CrossRef CAS.
- E. M. Garcia-Castello, J. R. McCutcheon and M. Elimelech, J. Membr. Sci., 2009, 338, 61–66 CrossRef CAS.
- K. Lutchmiah, L. Lauber, K. Roset, D. J. Harmsen, J. W. Post, L. C. Rietveld, J. B. van Lier and E. R. Cornelissen, J. Membr. Sci., 2014, 460, 82–90 CrossRef CAS.
- H. T. Nguyen, S.-S. Chen, N. C. Nguyen, H. H. Ngo, W. Guo and C.-W. Li, J. Membr. Sci., 2015, 489, 212–219 CrossRef CAS.
- Y. Cai, W. Shen, R. Wang, W. B. Krantz, A. G. Fane and X. Hu, Chem. Commun., 2013, 49, 8377–8379 RSC.
- S. Y. Park, H.-W. Ahn, J. W. Chung and S.-Y. Kwak, Desalination, 2016, 397, 22–29 CrossRef CAS.
- R. Alnaizy, A. Aidan and M. Qasim, J. Environ. Chem. Eng., 2013, 1, 424–430 CrossRef CAS.
- J.-J. Kim, J.-S. Chung, H. Kang, Y. A. Yu, W. J. Choi, H. J. Kim and J.-C. Lee, Macromol. Res., 2014, 22, 963–970 CrossRef CAS.
- C. Ju and H. Kang, RSC Adv., 2017, 7, 56426–56432 RSC.
- Y. Bai, Y. N. Liang and X. Hu, Chemosphere, 2017, 185, 1157–1163 CrossRef CAS PubMed.
- M. Noh, Y. Mok, S. Lee, H. Kim, S. H. Lee, G.-W. Jin, J.-H. Seo, H. Koo, T. H. Park and Y. Lee, Chem. Commun., 2012, 48, 3845–3847 RSC.
- Y. Kohno, S. Saita, Y. Men, J. Yuan and H. Ohno, Polym. Chem., 2015, 6, 2163–2178 RSC.
- Y. Zhong, X. Feng, W. Chen, X. Wang, K.-W. Huang, Y. Gnanou and Z. Lai, Environ. Sci. Technol., 2015, 50, 1039–1045 CrossRef PubMed.
- J.-J. Kim, H. Kang, Y.-S. Choi, Y. A. Yu and J.-C. Lee, Desalination, 2016, 381, 84–94 CrossRef CAS.
- T. Kim, C. Ju, C. Park and H. Kang, Polymers, 2019, 11, 571 CrossRef CAS PubMed.
- D. Li, X. Zhang, J. Yao, G. P. Simon and H. Wang, Chem. Commun., 2011, 47, 1710–1712 RSC.
- H. Salehi, M. T. Nakhjiri, E. Shakeri, N. Khankeshipour and F. Ghorbani, Cellulose, 2019, 26, 1841–1853 CrossRef.
- M. M. Ling, T.-S. Chung and X. Lu, Chem. Commun., 2011, 47, 10788–10790 RSC.
- A. Shakeri, H. Salehi, N. Khankeshipour, M. T. Nakhjiri and F. Ghorbani, J. Nanopart. Res., 2018, 20, 325 CrossRef.
- X. Cai and X. M. Hu, Desalination, 2016, 391, 16–29 CrossRef.
- J. Loeb, Proc. Natl. Acad. Sci. U. S. A., 1920, 6, 211–217 CrossRef CAS PubMed.
- Y. Hartanto, S. Yun, B. Jin and S. Dai, Water Res., 2015, 70, 385–393 CrossRef CAS PubMed.
- D. Nakayama, Y. Mok, M. Noh, J. Park, S. Kang and Y. Lee, Phys. Chem. Chem. Phys., 2014, 16, 5319–5325 RSC.
- M. J. Ariza, D. J. Jones and J. Rozière, Desalination, 2002, 147, 183–189 CrossRef CAS.
- Y.-F. Mi, Q. Zhao, Y.-Li. Ji, Q.-F. An and C.-J. Gao, J. Membr. Sci., 2015, 490, 311–320 CrossRef CAS.
- K. Loza, J. Diendorf and C. Sengstock, J. Mater. Chem. B, 2014, 2, 1634–1643 RSC.
- T. Y. Cath, A. E. Childress and M. Elimelech, J. Membr. Sci., 2006, 281, 70–87 CrossRef CAS.
- M. L. Stone, A. D. Wilson, M. K. Harrup and F. F. Stewart, Desalination, 2013, 312, 130–136 CrossRef CAS.
- E. Tian, C. Hu, Y. Qin, Y. Ren, X. Wang, X. Wang, P. Xia and X. Yang, Desalination, 2015, 16, 130–137 CrossRef.
- T. Sato, G. Masuda and K. Takagi, Electrochim. Acta, 2004, 49, 3603–3611 CrossRef CAS.
- Q. Ge, J. Su, G. L. Amy and T.-H. Chung, Water Res., 2012, 46, 1318–1326 CrossRef CAS PubMed.
- R. E. Barker Jr, Pure Appl. Chem., 1976, 46, 157–170 Search PubMed.
- A. C. Schneider, C. Pasel, M. Luckas, K. G. Schmidt and J.-D. Herbell, J. Solution Chem., 2004, 33, 257–273 CrossRef CAS.
- J. Kielland, J. Am. Chem. Soc., 1937, 59, 1675–1678 CrossRef CAS.
- J. Owen, Comprehensive polymer science and supplements, Elsevier, Amsterdam, 1996 Search PubMed.
- S. K. Yen, F. M. Haja, N. M. Su, K. Y. Wang and T.-S. Chung, J. Membr. Sci., 2010, 364, 242–252 CrossRef CAS.
- J. Loeb, Proc. Natl. Acad. Sci. U. S. A., 1920, 6, 211–217 CrossRef CAS PubMed.
- R. Dutzler, E. B. Campbell, M. Cadene, B. T. Chait and R. MacKinnon, Nature, 2002, 415, 287–294 CrossRef CAS PubMed.
- K. Y. Wang, T.-S. Chung and J.-J. Qin, J. Membr. Sci., 2007, 300, 6–12 CrossRef CAS.
- B. Corzo, T. De la Torre, C. Sans, E. Ferrero and J. J. Malfeito, Chem. Eng. J., 2017, 326, 1–8 CrossRef CAS.
- S. Zhao and L. Zou, J. Membr. Sci., 2011, 379, 459–467 CrossRef CAS.
- P. H. Duong, S. Chisca, P.-Y. Hong, H. Cheng, S. P. Nunes and T.-S. Chung, ACS Appl. Mater. Interfaces, 2015, 7, 3960–3973 CrossRef CAS PubMed.
- Q. Ge, P. Wang, C. Wan and T.-S. Chung, Environ. Sci. Technol., 2012, 46, 6236–6243 CrossRef CAS PubMed.
- W. A. Phillip, J. S. Yong and M. Elimelech, Environ. Sci. Technol., 2010, 44, 5170–5176 CrossRef CAS PubMed.
- D. Li, X. Zhang, G. P. Simon and H. Wang, Water Res., 2013, 47, 209–215 CrossRef CAS PubMed.
- Y. Qiu and K. Park, Adv. Drug Delivery Rev., 2001, 53, 321–339 CrossRef CAS.
- E. A. Markvicheva, I. F. Kuzkina, I. I. Pashkin, T. N. Plechko, Y. E. Kirsh and V. P. A. Zubov, Biotechnol. Tech., 1991, 5, 223–226 CrossRef CAS.
- C. Boutris, E. G. Chatzi and C. Kiparissides, Polymer, 1997, 38, 2567–2570 CrossRef CAS.
- S. Fujishige, K. Kubota and I. Ando, J. Phys. Chem., 1989, 93, 3311–3313 CrossRef CAS.
Footnote |
| † These authors contributed equally to this work. |
| This journal is © The Royal Society of Chemistry 2019 |


