 Open Access Article
Effect of blending sewage sludge with coal on combustion and ash slagging behavior
Shuai Guo ,
Qiyao Yang,
Honglin Liang
 ,
Deyong Che,
Hongpeng Liu and
Baizhong Sun*
School of Energy and Power Engineering, Northeast Electric Power University, Jilin 132000, China. E-mail: sunbaizhong@126.com
First published on 19th September 2019
Abstract
Blending sewage sludge (SS) with Zhundong coal (ZDC) for combustion in coal-fired power plants is a recent approach that can alleviate the shortage of high-quality coal resources and achieve the harmless treatment of SS, while also having a significant influence on combustion and ash slagging. Due to the high content of alkali and alkaline earth metals (AAEMs) in ZDC, its combustion ash has a strong likelihood of slagging. This study aims to investigate the effect of blending SS with ZDC on combustion and ash slagging. Thermogravimetry (TG) results indicate that blending with SS could lower the ignition and burnout temperatures of ZDC. With an increase in the ratio of sludge, the comprehensive combustion index (S) first increases and then decreases, showing that blending SS with ZDC in an appropriate proportion could improve the overall combustion. Through the analysis of the interaction, it is confirmed that SS and ZDC could complement each other during co-combustion due to their different components. X-ray fluorescence (XRF) was used to test the ash components of different blending ratios (10–30%) and combustion temperatures (800–1100 °C). Slagging indices including alkali acid ratio (B/A), silicon ratio (G), and silica–alumina ratio (SiO2/Al2O3) were also calculated. The results suggest that the slagging behavior of ZDC is greatly reduced even if the blending ratio is only 10%. However, with an increase in the blending ratio, the effect on slagging gradually weakens. Considering the dual influence of SS blending on combustion and slagging, this study assumes the optimal blending ratio of 20%. Influenced by the components of the combustion ash, B/A and SiO2/Al2O3 are more suitable for evaluating the slagging tendency of ash; however, there is great deviation in the results for G. This research is beneficial to coal-fired power plants for the selection of operation parameters during co-combustion with SS.
1 Introduction
Coal is one of the primary sources for the production of energy, and is likely to remain so for many years. With developing societies the demand for electricity is increasing, and high-quality coal resources have been exhausted. The exploitation and utilization of low-rank coal is therefore necessary. Coal contains varying amounts of AAEMs, which are more prominent in low-rank coal such as Victoria brown coal and ZDC.1,2 For example, ZDC (Xinjiang, China), with a calorific value of 18–22 MJ kg−1,3 has a high volatile content and a low ash content which means that it ignites easily. ZDC contains large amounts of Na; the proportion of Na2O in ash can reach as high as 5.73%.4 Most of the Na in such coal volatilizes during combustion, and then reacts with SO3 to create sulfate products with a low melting point. These products condense onto the heated surfaces in coal boilers to form a bonding layer which attracts the combustion ash. Both ash and slagging accumulate in this way, leading to severe problems that endanger the normal operation of boilers such as the blasting of the heated surface.5,6Several researchers have carried out detailed studies concerning the migration and transformation of AAEMs in ZDC. Zhang et al.7 studied how the Na-rich components in ZDC change at different temperatures. The results suggested that the ashing temperature had a significant influence on the content and appearance of Na in the ash and the total content of Na and Cl decreased with an increase in temperature. Xu et al.8 studied the conversion of components containing Na during the pyrolysis of demineralized ZDC using a fixed-bed reactor. The results showed that carboxylic acid-soluble Na is converted to a water-soluble form at 400–600 °C and is released in the form of water-soluble NaCl at above 600 °C. This then reacts with the mineral elements or carbon skeleton in the coal to form insoluble components which contain Na. Studies by Manzoori et al.9 also showed that the NaCl found in low-rank coal underwent decomposition and reacted with other compounds during combustion, resulting in the release of Na and Cl in different proportions. Organic components containing Ca and Mg were also found to react with the Na-rich components to form acid-insoluble compounds. Song et al.10 also researched the conversion characteristics of the Na found in ZDC. The results showed that Na usually formed aluminosilicate in ash. When SO2 was present, the gaseous Na-containing components react with it to form Na2SO4. Wang et al.11 conducted studies on the depositional characteristics of ZDC ash. The results inferred that with an increase in combustion temperature, components containing Na underwent a series of changes. At 400–800 °C, 80% of the Na and 100% of the Cl were released. At 800–1000 °C, the remaining Na was also released, and the release of S was initiated. At 1000–1200 °C, with the decomposition of the sulfate, the remaining S was completely released. The ash deposition experiments indicated that the Na in ZDC was mainly released in the form of gaseous components, which were then deposited on the heated surface in the form of gaseous sulfate. Song et al.12 studied the corrosion of the heating surface and the slagging process in a circulating fluidized bed (CFB) during ZDC combustion. The results suggested that due to the presence of NaCl, any Fe in the heated surface became unstable. The presence of Fe2O3, Na2O, and sulfate accelerated the corrosion of the heated surface. Elements such as Ca, Na, Fe, S, Si, Mg in the combustion ash were enriched in the form of low-melting sulfates, silicates, and other compounds which also resulted in the deposition of slagging on the heated surface.
Blending is an effective method for the alleviation of the slagging problem caused by the release of AAEMs during the combustion of low rank coal. Liu et al.13 studied the co-combustion between ZDC and Shenhua coal in a 30 kW CFB. The results suggested that if the ratio of Shenhua coal to ZDC is increased, the presence of silicon and aluminosilicate decreased the deposition of ZDC ash by capturing the AAEMs. The best blending ratio was found to be 20%. Li et al.14 discussed the characteristics of ash deposition during the co-combustion of ZDC and Australian bituminous coal in a drop tube furnace. The results demonstrated that with a higher ratio of Australian bituminous coal to ZDC, the molten mineral content gradually decreased and the refractory quartz and mullite content gradually increased, indicating that blending with bituminous coal could lower the slagging produced by ZDC. When the blending ratio exceeded 40%, it was not affected by changes in temperature, indicating that the ash had a strong anti-sintering property and was not prone to slagging. Zhou et al.15 studied the effects of various types of biomass ash on the sintering properties of ZDC ash. The results showed that corn stalk and rice husk ash could promote the sintering performance of ZDC ash, while wood ash had the opposite effect, as the AAEMs in the ZDC reacted with the biomass ash to create refractory products. The above studies indicate that blending can effectively alleviate slagging during the combustion of high-AAEMs coal. There are several other substances that can be blended with low-rank coal, such as SS. As the by-product of sewage treatment, the disposal of SS is always problematic.16 If sludge is not handled properly, personal and even social safety can be threatened.17 Therefore, the proper treatment of SS is critical. So far, methods using heat treatment are currently considered to be the most thorough. After incineration, the volume of the sludge is significantly reduced, utilizing the heat. The residue after incineration can also be recycled.18,19
Sludge has a high volatile content and a significant calorific value and is therefore often used in co-combustion.20,21 Deng et al.22 studied the co-combustion of SS with biomass using thermogravimetry (TG) analysis. The results showed that the addition of biomass at 280–390 °C had a negative impact on combustion, but at 390–620 °C the impact became positive. Ayse et al.23 added SS to coal at different proportions during combustion, with results suggesting that the higher the proportion of sludge added, the lower the combustion efficiency. However, the influence from this effect is relatively insignificant, as the efficiency only decreased from 99.5% to 97.5% with an increase of 5% to 30% to the proportion of sludge. Otero et al.24 conducted experiments on the co-combustion characteristics of SS and anthracite in different proportions using TG. Kinetic analysis was carried out using Ozawa–Flynn–Wall and Vyazovkin methods, respectively. The results showed that when the proportion of sludge added was less than 10%, the co-combustion characteristics were similar to those of burning anthracite alone. Folgueras and Park et al.25,26 also obtained the similar results. Park et al.26 suggested that when the proportion of SS is below 20%, the co-combustion characteristics were similar to that of coal, with similar activation energies. Above all, it indicates that under certain conditions, the blending of SS does not affect the behavior of coal during combustion.
SS has high ash content, which contains a large amount of inorganic salts. Wang et al.27 studied the behavior of mineral transformation during the co-combustion of SS and lignite. The results showed that when the SS blending ratio is 10%, minerals such as albite, pyroxene and anorthite were produced. Hao et al.28 researched the interaction between SS and anthracite during co-combustion with regards to the combustible conversion rate, ash morphology, and composition changes. The results showed that combustion ash mainly consists of compounds such as SiO2, Al2O3, CaSO4, and Fe2O3. An increase in combustion temperature could promote the agglomeration of ash. Wang et al.29 studied the sintering characteristics and mineral conversion behavior of SS ash at different temperatures. The results showed that the initial melting temperature of SS ash with a high Al content was higher than 1100 °C, with major constituents that include corundum, quartz, and silicates containing Ca and Al. Studies concerning the effects of SS blending on the slagging characteristics of wood particles was also carried out. The results indicated that SS could prevent the slagging of wood particles during combustion. Ash components of low-melting silicate were found to be converted to high-melting Ca-contained silicate, corundum, nepheline, and other such compounds.30 The above studies all indicate that during the combustion of SS together with other substances, the components interact and affect the composition of the ash produced, thus initiating different slagging properties. It is therefore assumed that blending low-grade coal with SS could reduce slagging.
Influenced by the source and treatment, some SS contains N and P, which ultimately renders it acidic. Studies have indicated that components in the sludge that contain P could fix the K and Na.31–33 Based on the results from previous research, in this study SS is blended with ZDC during combustion, with the intent of preventing slagging on the heated surface that is caused by the release of AAEMs,34 while also solving the problem of SS pollution. In order to ensure the safe operation of a boiler, an appropriate blending proportion for SS needs to be determined. If the ratio is not suitable, slagging and the deposition of ash on the furnace and the heated surface could be increased.35 Therefore, the means of deciding a suitable blending ratio for SS during ZDC combustion is discussed in this paper.
It is evidence from the foregoing that several previous studies focused on the co-combustion characteristics between SS and coal, without examination of the ash slagging, especially for the coal with high AAEM contents. To bridge this gap in the literature, systematic techniques were used in the present study to investigate the effects of blending SS with ZDC on combustion and slagging behaviors, TG and muffle furnace were used to carry out experiments using different proportions of SS (10%, 20% and 30%). The characteristic parameters, such as ignition and burnout temperature, comprehensive combustion index etc., were considered to evaluate the effects of the addition of SS. The interaction between SS and ZDC during combustion was analyzed. Besides, the components of co-combustion ash were measured using XRF technique, and the evaluation indices for slagging tendency were also calculated. Based on the findings, this work aims to determine an appropriate ratio for blending that could minimize slagging behaviors without affecting the combustion behaviors of coal.
2 Experimental
2.1 Materials
The SS used in the experiments was taken from Huanjia Environmental Protection Co., Ltd., Jilin City, China. The sludge consisted of 55.3% industrial sludge and 44.7% municipal sludge. The ZDC was from Zhundong coalfied which is the largest integrated coal basin newly found in China. The SS and ZDC were initially dried at 105 °C for more than 24 h.The sample was then pulverized in a small mill and sieved using a 80 mesh screen with a pore size of 178 μm, and the materials with the diameter less than 178 μm were used in the experiments. The proximate and ultimate analysis results are shown in Table 1. The SS and ZDC were mixed well with different ratios. The proportion of SS added was 0%, 10%, 20%, 30% and 100% in samples S1–S5, respectively. The blended samples were then sealed and stored at 4 °C.
| Sample | Proximate analysis (%) | Ultimate analysis (%) | Heating value | |||||||
|---|---|---|---|---|---|---|---|---|---|---|
| Cad | Had | Oad | Nad | Sad | Mad | Vad | Aad | FCad | Qnet,ar (kJ kg−1) | |
| ZDC | 64.52 | 3.20 | 15.02 | 0.71 | 0.67 | 11.96 | 27.28 | 5.82 | 54.94 | 24![[thin space (1/6-em)]](https://www.rsc.org/images/entities/char_2009.gif) 360.16 360.16 |
| SS | 18.03 | 2.85 | 13.81 | 2.07 | 0.60 | 3.84 | 32.66 | 58.80 | 4.70 | 8200.29 |
Ash samples from the combustion were prepared using S1–S5 at different temperatures (800 °C, 900 °C, 1000 °C, 1100 °C) in a muffle furnace. To achieve this, the experimental samples were evenly spread on the bottom of the quartz boat at less than 0.15 g cm−2. When the furnace reached the desired temperature, the boat was placed into the furnace. A gap of approximately 15 mm was left in the furnace door for air circulation to achieve the complete combustion. Ash samples were weighed at regular intervals until changes in the measured weight did not exceed 0.1%. Finally, the ash samples were naturally cooled and then stored.
2.2 TG experiments
The combustion characteristics of samples S1–S5 were investigated using a TG analyzer (TGA/SDTA851e, METTLER-TOLEDO, Switzerland). Samples of 10 mg ± 0.5 mg were spread evenly on the bottom of a crucible to minimize any errors caused by changes in temperature or gradients in air concentration. The temperature used for the experiment ranged between room temperature and 900 °C. An air atmosphere was adopted with a gas flow rate of 50 ml min−1. In order to study the effects of blending SS with ZDC on the characteristics of combustion. At heating rates of 10 °C min−1, 20 °C min−1, 30 °C min−1, and 40 °C min−1, The activation energy(Em) was calculated with a conversion rate (α) of 0.1–0.9 in increments of 0.1, and the mean was taken as the final result.2.3 Co-combustion ash composition tests
The components of the combustion ash in S1–S5 were tested using an X-ray fluorescence spectrometer (XRF, S8TIGER, Bruker, Germany). Alkaline oxides found via this method include CaO, Fe2O3, MgO, Na2O and K2O, and acidic oxides include SiO2, Al2O3, P2O5 and TiO2. The working voltage of the instrument was 20–60 kV with an angular resolution of ±0.001°. A 2 g sample from each different ash was placed into an agate mortar to which boric acid was added and mixed. The samples were then compressed into tablets with a smooth surface. In order to prevent contamination of the samples, the mortar and mold was cleaned with absolute ethanol. The samples were tested at least three times, and the mean was taken as the final result.3 Results and discussions
3.1 TG/DTG analysis
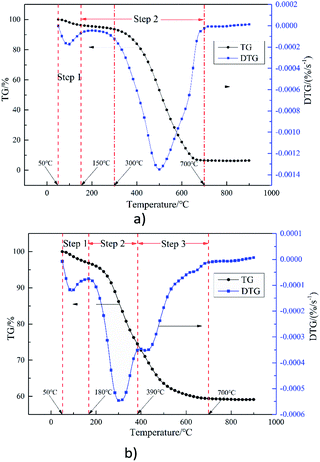
Fig. 1(b) illustrates the TG and DTG curves for SS combustion at a heating rate of 20 °C min−1. It can be seen from the DTG curve that the process of SS combustion can be divided into three stages,37 namely water evaporation (50–180 °C), devolatilization and combustion (180–390 °C), and fixed carbon combustion (390–700 °C). The weight loss in the second stage accounts for about 52% which is the main stage in the combustion of SS. This is consistent with Table 1, in that the volatile content (32.66%) is much higher than that of fixed carbon (4.7%) in SS. In addition, compared with ZDC, the peak width of the DTG curve for the main combustion stage of SS is narrower, which may be due to its high volatile content. The weight loss at the third stage accounts for about 39%, and the combustion rate at this stage obviously slows down. A high ash content within SS could adhere to the fixed carbon surface and prevent combustion. Moreover, combustion of volatiles consumes significant amounts of O2, so the fixed carbon has limited access to O2 until the volatiles are completely burned.38 Therefore, there is a short plateau between the second and third stage. It can be seen that the combustion of volatiles plays an important role during SS combustion. It is assumed that ZDC and SS could complement each other during co-combustion, which is discussed in the following part.
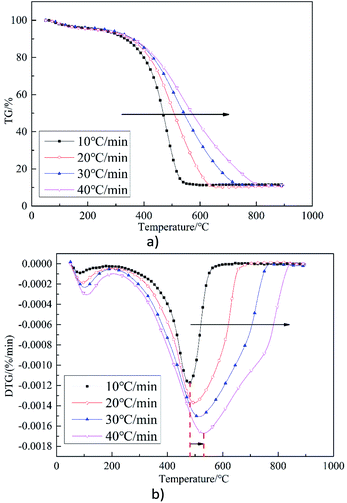
The rate of maximum weight loss increases with the increase in the rate of heating, which is consistent with the widening phenomenon between ignition and burnout temperature when the heating rate increases. Samples are impacted by the high temperature over a short time, so the reactions are enhanced.39
3.2 Analysis of the combustion characteristic parameters
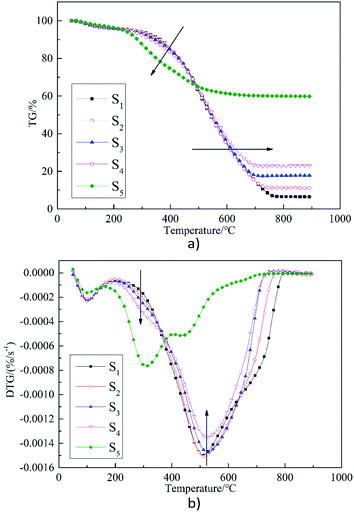
Table 2 shows the parameters of the combustion characteristic of samples S1–S5 at a heating rate of 20 °C min−1. The parameters include ignition temperature (Ti), burnout temperature (Th), ignition index (C), stable-combustion index (SI) and comprehensive combustion index (S). It is apparent that when compared with ZDC, SS has lower Ti and Th and a shorter duration of combustion. This indicates that SS contains less combustibles, but is more inflammable. High concentrations of C also demonstrate the property. This is consistent with the conclusion of Mikulcic et al.41 that biomass is more combustible than coal. In addition, the maximum and average combustion speeds ((dw/dt)max, (dw/dt)mean) are low, indicating that the combustion is not so intensive as that of ZDC. The corresponding SI is also higher. With respect to the above factors, levels of S during SS combustion are also lower than that of ZDC. Table 2 also shows that with an increase of the blending ratio of SS with ZDC, the Ti and Th are both reduced. When the blending ratio is 10–20%, when compared with coal without any blending, (dw/dt) mean and S both increases. However, when the blending ratio is 30%, (dw/dt) mean, C, SI, and S are all lower than those of coal without blending. The above results indicate that blending of SS with ZDC in an appropriate proportion can improve the overall combustion. From the experimental conditions in this paper, the blending ratio should not exceed 20%. The result is very similar to Qi et al.36 who indict that high combustion performance occurs at the sludge blending ratio of 25%.| Heating rate (°C min−1) | Sample | Ti (°C) | Th (°C) | Tmax (°C) | (dw/dt)max (%/min) | (dw/dt)mean (%/min) | C, 10−5 | SI, 10−5 | S, 10−7 |
|---|---|---|---|---|---|---|---|---|---|
| 30 | S1 | 392 | 745 | 509 | 8.97 | 6.55 | 5.84 | 4.49 | 5.14 |
| S2 | 391 | 716 | 514 | 9.04 | 6.80 | 5.91 | 4.51 | 5.62 | |
| S3 | 391 | 682 | 527 | 8.83 | 6.83 | 5.77 | 4.28 | 5.40 | |
| S4 | 383 | 678 | 525 | 8.10 | 6.14 | 5.52 | 4.03 | 4.95 | |
| S5 | 237 | 646 | 310 | 6.12 | 2.50 | 10.90 | 8.33 | 4.22 |
Table 3 shows the parameters of the combustion characteristics of sample S3 at different heating rates. It can be seen that with an increase in the rate of heating, the Ti gradually decreases but the Th increases,42 which is consistent with Fig. 3(a). Indices of (dw/dt)max, (dw/dt)mean, C, SI, and S all increase, indicating that the increase in heating rate could enhance combustion.
| Sample | Heating rate (°C min−1) | Ti (°C) | Th (°C) | Tmax (°C) | (dw/dt)max (%/min) | (dw/dt)mean (%/min) | C, 10−5 | SI, 10−5 | S, 10−7 |
|---|---|---|---|---|---|---|---|---|---|
| S3 | 10 | 399 | 540 | 474 | 6.60 | 4.31 | 4.14 | 3.49 | 3.31 |
| 20 | 395 | 624 | 504 | 7.63 | 5.69 | 4.89 | 3.83 | 4.46 | |
| 30 | 391 | 682 | 527 | 8.83 | 6.83 | 5.77 | 4.28 | 5.41 | |
| 40 | 384 | 780 | 539 | 9.31 | 6.87 | 6.32 | 4.50 | 5.57 |
3.3 Activation energy analysis
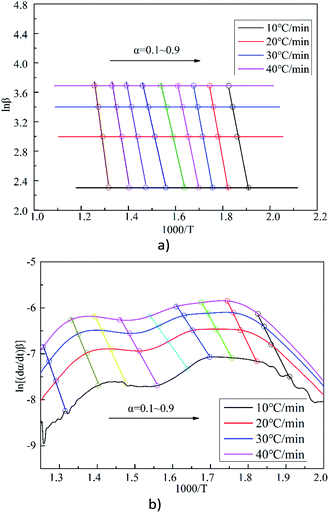
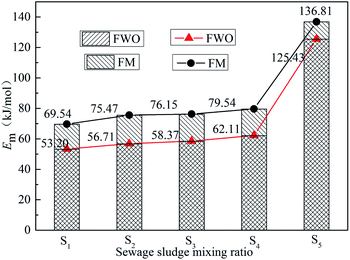
Kinetic parameters were calculated using the methods developed by Flynn–Wall–Ozawa (FWO) and Friedman (FM).43 Fig. 4 shows the curve of ln[(dα/dt)β] vs. 1000/T and ln![[thin space (1/6-em)]](https://www.rsc.org/images/entities/char_2009.gif) β vs. 1000/T for sample S5 at different heating rates under the given conversion rates. The results are used to determine the slope and intercept under different α. The Em is then calculated according to the slope and intercept of the regression curve. The correlation coefficients of the fitting results are all greater than 0.98. The results for the calculation of Em at different α are shown in Tables 4 and 5, and the results for the average Em are shown in Fig. 5. It is apparent that the trends using the two methods are basically the same, proving the reliability of the methods.
β vs. 1000/T for sample S5 at different heating rates under the given conversion rates. The results are used to determine the slope and intercept under different α. The Em is then calculated according to the slope and intercept of the regression curve. The correlation coefficients of the fitting results are all greater than 0.98. The results for the calculation of Em at different α are shown in Tables 4 and 5, and the results for the average Em are shown in Fig. 5. It is apparent that the trends using the two methods are basically the same, proving the reliability of the methods.
| α (%) | Em (kJ mol−1) | ||||
|---|---|---|---|---|---|
| S1 | S2 | S3 | S4 | S5 | |
| 10 | 101.93 | 119.90 | 112.61 | 106.47 | 129.38 |
| 20 | 95.70 | 103.30 | 105.55 | 112.64 | 137.03 |
| 30 | 74.69 | 75.81 | 79.43 | 91.76 | 135.03 |
| 40 | 55.72 | 57.23 | 60.18 | 63.33 | 104.53 |
| 50 | 38.42 | 39.97 | 43.01 | 50.14 | 96.77 |
| 60 | 31.36 | 32.75 | 34.78 | 38.45 | 102.10 |
| 70 | 27.95 | 28.44 | 33.27 | 33.20 | 118.55 |
| 80 | 27.20 | 27.59 | 29.66 | 32.96 | 138.42 |
| 90 | 25.81 | 25.38 | 26.86 | 30.05 | 167.13 |
| α (%) | Em (kJ mol−1) | ||||
|---|---|---|---|---|---|
| S1 | S2 | S3 | S4 | S5 | |
| 10 | 100.76 | 124.03 | 111.89 | 107.68 | 130.29 |
| 20 | 98.33 | 112.24 | 109.57 | 115.74 | 142.21 |
| 30 | 90.26 | 97.29 | 99.04 | 104.36 | 137.25 |
| 40 | 78.81 | 82.28 | 84.84 | 90.66 | 124.60 |
| 50 | 67.49 | 69.24 | 73.21 | 77.22 | 110.75 |
| 60 | 57.83 | 58.99 | 61.29 | 66.21 | 112.96 |
| 70 | 48.80 | 51.01 | 54.51 | 57.66 | 134.62 |
| 80 | 43.10 | 44.57 | 48.06 | 50.90 | 152.44 |
| 90 | 40.50 | 39.62 | 42.91 | 45.39 | 186.27 |
It can be seen from Tables 4 and 5 that the Em of samples S1–S4 tends to decrease generally with an increase in α, because the combustion of volatiles within the ZDC provides heat for the combustion of char. This provides sufficient energy for the subsequent reaction. Therefore, Em decreases during the reaction.44 Meanwhile, as can be seen from Fig. 5, Em tends to increase slightly with an increase in the SS blending ratio, indicating that blending with SS could affect the combustion of ZDC. With the increase in the blending ratio, the influence becomes more obvious. Under the experimental conditions in this paper, when the blending ratio reaches 30%, the co-combustion characteristics are generally closer to the combustion of SS alone. For example, when α = 10%, the Em of sample S4 first increases and then decreases; when α = 20%, the Em of sample S2 and S3 both decrease with the increase of α. In addition, compared with samples S1–S4, the Em of sample S5 significantly increases (see Fig. 5). Contrary to the results for samples S1–S4, the Em of sample S5 increases with the increase of α (see Tables 4 and 5), illustrating the different combustion characteristics of SS and ZDC. The Em estimated for the co-combustion of ZDC with SS approached that of ZDC, which indicts that co-combustion of ZDC with SS is a feasible management option for such waste.45
3.4 Interaction analysis during co-combustion
The above results show that blending of SS with ZDC could influence the parameters of the combustion characteristics as well as Em, improving the combustion performances at low sludge blending ratio, that is interaction occurs during co-combustion.36 In order to analyze the interaction, the experimental and theoretical values of DTG are compared.46 The theoretical values are calculated using eqn (1).
 | (1) |
| ΔDTG = DTGexperimental − DTGcalculated | (2) |
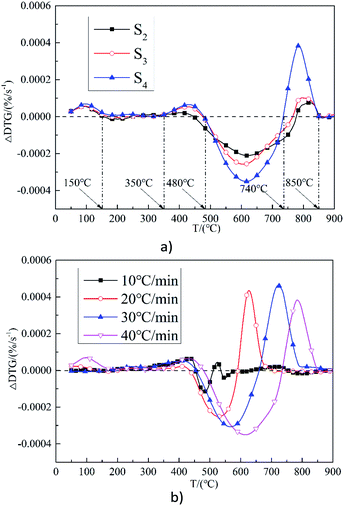
Fig. 6(a) shows the results of ΔDTG during the combustion of samples S2–S4 at a heating rate of 30 °C min−1. It can be seen that the trends for change in the three samples are basically the same. The interaction between SS and ZDC is enhanced with the increase in the SS blending ratio. For the same sample, when the temperature is below 150 °C (dehydration stage), SS could promote combustion. The hydrophilic characteristics of SS could be helpful in removing moisture during ZDC combustion. At 150–350 °C, ΔDTG is almost 0, indicating that the SS and ZDC do not interact with each other at this stage. At 350–480 °C, SS may be promoting the combustion process to some extent. The greater the blending ratio, the more significant this effect is, which may be caused by the combustion of the volatiles within the SS. At 480–750 °C the inhibition effect becomes evident due to the high ash content within SS. This phenomenon was similar to the research.46 At 750–850 °C, the combustion of SS and ZDC are thought to promote each other. The heat generated by the combustion of the char in the ZDC could promote the combustion of the fixed carbon within the SS. However, no such interaction is observed as the samples almost burn out at above 850 °C. In summary, the interaction between SS and ZDC during co-combustion promotes, inhibits, and then promotes combustion as the temperature increases, which is consistent with the idea of a “complementary” effect during co-combustion.
Fig. 6(b) shows the results of the ΔDTG of sample S4 at different heating rates. It can be seen that for this sample with the increase of heating rate, the interaction between them becomes evident, and the promoting effect gradually moves to the high temperature area. It can be inferred that there will be strong interactions between them in case of instantaneous heating by continuous fuels feeding in the boiler.
3.5 An analysis of slagging behavior during co-combustion
| T (°C) | Sample | Alkaline oxide content (%) | Total (%) | Acidic oxide content (%) | Total (%) | |||||||
|---|---|---|---|---|---|---|---|---|---|---|---|---|
| CaO | Fe2O3 | MgO | Na2O | K2O | SiO2 | Al2O3 | P2O5 | TiO2 | ||||
| 800 | S1 | 25.3 | 6.94 | 9.17 | 3.69 | 0.26 | 45.4 | 13.8 | 11.4 | 0.29 | 0.52 | 26.01 |
| S2 | 14.8 | 8.68 | 5.52 | 2.92 | 1.31 | 33.2 | 27.4 | 13.9 | 2.85 | 0.72 | 44.87 | |
| S3 | 10.8 | 9.47 | 4.10 | 2.45 | 1.76 | 28.6 | 31.4 | 14.7 | 4.07 | 0.75 | 50.92 | |
| S4 | 8.62 | 9.94 | 3.48 | 2.25 | 1.96 | 26.3 | 34.9 | 15.8 | 4.87 | 0.79 | 56.36 | |
| S5 | 4.66 | 9.99 | 2.45 | 1.14 | 2.48 | 20.7 | 40.7 | 18.0 | 6.55 | 0.81 | 66.06 | |
| 900 | S1 | 27.0 | 7.16 | 9.31 | 2.80 | 0.30 | 46.6 | 13.6 | 11.3 | 0.26 | 0.47 | 25.63 |
| S2 | 15.1 | 9.07 | 5.42 | 2.54 | 1.20 | 33.3 | 27.6 | 13.9 | 3.17 | 0.74 | 45.41 | |
| S3 | 11.1 | 9.48 | 4.13 | 2.26 | 1.72 | 28.7 | 33.0 | 15.0 | 4.26 | 0.77 | 53.03 | |
| S4 | 8.72 | 9.70 | 3.53 | 2.05 | 2.01 | 26.0 | 35.0 | 15.5 | 4.91 | 0.78 | 56.19 | |
| S5 | 4.66 | 9.75 | 2.47 | 1.26 | 2.39 | 20.5 | 40.9 | 17.6 | 6.56 | 0.81 | 65.87 | |
| 1000 | S1 | 26.8 | 7.45 | 9.16 | 2.10 | 0.24 | 45.8 | 14.5 | 11.6 | 0.32 | 0.57 | 26.99 |
| S2 | 15.4 | 9.27 | 5.38 | 2.24 | 1.06 | 33.4 | 28.8 | 14.3 | 3.84 | 0.77 | 47.71 | |
| S3 | 11.0 | 9.33 | 4.05 | 2.56 | 1.63 | 28.6 | 33.6 | 15.4 | 5.13 | 0.77 | 54.9 | |
| S4 | 8.65 | 9.78 | 3.52 | 2.17 | 1.98 | 26.1 | 36.0 | 15.9 | 5.30 | 0.75 | 57.95 | |
| S5 | 4.74 | 10.2 | 2.30 | 1.24 | 2.37 | 20.9 | 38.9 | 16.3 | 6.00 | 0.85 | 62.05 | |
| 1100 | S1 | 29.1 | 9.47 | 8.62 | 1.31 | 0.14 | 48.6 | 16.0 | 12.0 | 0.42 | 0.68 | 29.1 |
| S2 | 13.6 | 9.33 | 3.36 | 1.96 | 0.85 | 29.1 | 26.5 | 12.4 | 2.68 | 0.72 | 42.3 | |
| S3 | 10.3 | 9.87 | 3.05 | 1.94 | 1.63 | 26.8 | 30.2 | 13.2 | 4.21 | 0.78 | 48.39 | |
| S4 | 8.42 | 9.86 | 2.73 | 1.90 | 1.87 | 24.8 | 32.7 | 14.0 | 4.52 | 0.79 | 52.01 | |
| S5 | 4.60 | 9.99 | 1.86 | 1.08 | 2.23 | 19.8 | 35.4 | 13.9 | 5.06 | 0.82 | 55.18 | |
(1) B/A. The more acidic components the ash contains, the higher the melting point. However, alkaline components have a fluxing action. Therefore, the ratio (B/A) can reflect the slagging tendency.49 B/A is the most commonly used evaluation index, and is calculated with eqn (3).
 | (3) |
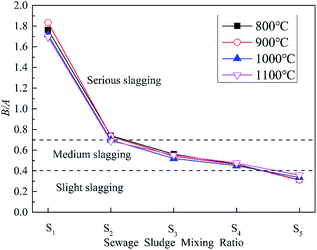
It can be seen that ZDC has a strong tendency for slagging, whereas SS has a low tendency. The change in B/A with the SS blending ratio at different temperatures is similar. The slagging of ZDC is reduced significantly even if the blending ratio is only 10%, as the slagging tendency declines from a severe to a medium level. Zhao et al.47 obtained the similar result, they indicted that only slight or medium slagging was predicted to occur during co-combustion. Slagging gradually weakens with the increase in blending ratio, the result is very similar to Qi et al.36 They pointed out that an improvement of the ash fusibility during co-combustion through microtopography change. A large amount of fine particles but no sintering aggregates could be observed for the sludge blending ratio of 25%, indicating a better ash fusibility. In this study, considering the dual influence from the blending of SS on combustion and slagging, it is apparent that 20% is the optimal blending ratio for co-combustion, which is similar to the result of previous research.36
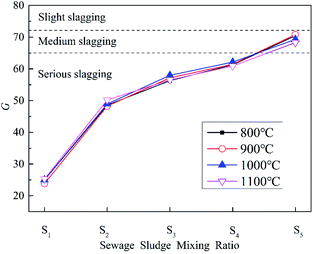
(2) G. SiO2 is the main component of SS ash and plays an important role in weakening the slagging behavior of ZDC during co-combustion. It is particularly necessary to study the impact from SiO2. G represents the percentage of SiO2 in the alkaline oxide content of the ash, as calculated by eqn (4). The larger the value of G, the greater the proportion of SiO2, and the weaker the tendency for slagging.50
 | (4) |
The relationship between the value of G and slagging is as follows: when G > 72, there is a weak tendency for slagging; when 65 < G < 72, there is a medium tendency; and when G < 65, there is a strong tendency. Results for the calculation of G for co-combustion ash at different temperatures and blending ratios are shown in Fig. 8.
It can be seen that the trend for changes in G is basically the same at different temperatures. The SiO2 content in ZDC ash is low, so it has a strong slagging tendency. SS ash has a medium or even weak slagging tendency, as is consistent with the results of B/A. The value for G grows with the increase in blending ratio during co-combustion. However, the combustion ash still has a strong slagging tendency. This is because the SS blending ratio does not exceed 30% in the experiments, the amount of SiO2 in combustion ash is therefore relatively small. The results for the evaluation of slagging tendency in combustion ash could be different when using different indices (B/A and G), so it is necessary to introduce other indices for further evaluation.
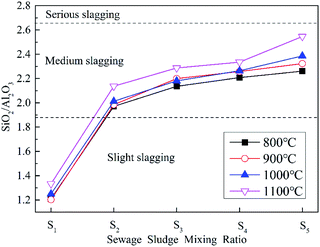
(3) SiO2/Al2O3. Al2O3 is the second highest component in SS ash next to SiO2. A large amount of silico–alumina salt is introduced into ZDC by blending with SS. Therefore, the silicon and aluminum ratio (SiO2/Al2O3) is used to analyze the slagging tendency of co-combustion ash. Both Al2O3 and SiO2 have the effect of increasing the melting point of ash and weakening slagging behavior. However, silicate reacts easily with other components to form low-temperature eutectics, such as Fe2SiO4, Fe3Al2(SiO4)3, Ca3Si3O9 etc.51 Therefore, compared with Al2O3, the presence of SiO2 will lower the ash melting point and cause the formation of slagging. The relationship between SiO2/Al2O3 value and slagging behavior is as follows: when SiO2/Al2O3 < 1.87, there is a weak tendency for slagging; when 1.87 < SiO2/Al2O3 < 2.65, there is medium tendency; and when SiO2/Al2O3 > 2.65, there is a strong tendency. The results for the calculation of SiO2/Al2O3 in co-combustion ash at different temperatures and blending ratios are shown in Fig. 9.
Considering the effect of the blending of SS on slagging, it is apparent that SiO2/Al2O3 gradually increases with an increase in the blending ratio, and the tendency for slagging also changes from weak to strong, indicating that excessive blending with SS does not necessarily weaken slagging behavior. This further proves that there is an optimal ratio for blending SS. As the SiO2/Al2O3 ratio does not take into consideration the influence of the alkaline oxide content in combustion ash, the ZDC ash is evaluated as having a weak slagging tendency, which is contrary to accepted fact. This is probably caused by the relatively low SiO2 content within the ZDC, and low temperature eutectics are not easily formed.
The above results verify that B/A and SiO2/Al2O3 are more suitable for analyzing the slagging tendency of co-combustion ash due to the influence of combustion ash components and other factors. The results from these indices are consistent with each other, but significantly deviate from the results of G.
4 Conclusions
The effect of blending SS with ZDC on combustion and the behavior of ash slagging are investigated in this study. The combustion of fixed carbon plays a major role during ZDC combustion, while the volatiles combustion is important for SS.There is an appropriate blending ratio of SS which could enhance the co-combustion. With an increase in the blending ratio of SS, the strong slagging behavior during ZDC combustion could reduce to medium or slight degree. Considering the dual influence of SS blending on the combustion and slagging behaviors, under the experimental conditions in this study, the blending ratio of SS is suggested to be 20%.
Conflicts of interest
There are no conflicts to declare.Abbreviations
| SS | Sewage sludge |
| TG | Thermogravimetry |
| ZDC | Zhundong coal |
| AAEMs | Alkali and alkaline earth metals |
| XRF | X-ray fluorescence |
| B/A | Alkali acid ratio |
| C | Ignition index |
| G | Silicon ratio |
| S | Comprehensive combustion index |
| SiO2/Al2O3 | Silica–alumina ratio |
| SI | Stable combustion index |
| CFB | Circulating fluidized bed |
| FM | Friedman |
| FWO | Flynn–Wall–Ozawa |
| Ti | Ignition temperature |
| Th | Burnout temperature |
| α | Conversion rate |
| Em | Activation energy |
Acknowledgements
We gratefully acknowledge the financial support provided by the National Key Technologies Research and Development Program (No. 2018YFB0905104), National Natural Science Funds for Young Scholars of China (No.51806033) and Jilin Provincial Science and Technology Development Program (No. 20180201008SF, 20190201096JC).Notes and references
- S. Kyi and B. L. Chadwick, Fuel, 1999, 78, 845–855 CrossRef CAS.
- X. Zhang, H. Zhang and Y. Na, Procedia Eng., 2015, 102, 305–314 CrossRef CAS.
- X. Wang, Z. Xu, B. Wei, L. Zhang, H. Tan, T. Yang, H. Mikulčić and N. Duić, Appl. Therm. Eng., 2015, 80, 150–159 CrossRef CAS.
- H. Wang, S. Guo, L. Yang, X. Wei, S. Zhang and S. Wu, Fuel Process. Technol., 2017, 155, 134–143 CrossRef CAS.
- G. Li, C. Wang, Y. Yan, X. Jin, Y. Liu and D. Che, J. Energy Inst., 2016, 89, 48–56 CrossRef CAS.
- Y. Yuan, S. Li and Q. Yao, Proc. Combust. Inst., 2015, 35, 2339–2346 CrossRef CAS.
- X. Zhang, H. Zhang and Y. Na, Procedia Eng., 2015, 102, 305–314 CrossRef CAS.
- L. Xu, H. Liu, D. Zhao, Q. Cao and S. Wu, Fuel, 2018, 233, 29–36 CrossRef CAS.
- A. R. Manzoori and P. K. Agarwal, Fuel, 1992, 71, 513–522 CrossRef CAS.
- G. Song, W. Song, X. Qi and Q. Lu, Energy Fuels, 2016, 30, 3473–3478 CrossRef CAS.
- X. Wang, Z. Xu, B. Wei, L. Zhang, H. Tan, T. Yang, H. Mikulčić and N. Duić, Appl. Therm. Eng., 2015, 80, 150–159 CrossRef CAS.
- G. Song, X. Qi, W. Song, S. Yang, Q. Lu and W. Nowak, Fuel, 2016, 186, 140–149 CrossRef CAS.
- Y. Liu, L. Cheng, J. Ji and W. Zhang, Appl. Therm. Eng., 2019, 149, 520–527 CrossRef CAS.
- J. Li, M. Zhu, Z. Zhang, K. Zhang, G. Shen and D. Zhang, Fuel Process. Technol., 2016, 149, 176–186 CrossRef CAS.
- H. Zhou and W. Ma, Appl. Therm. Eng., 2017, 126, 689–701 CrossRef CAS.
- E. Gomez, D. A. Rani and C. R. Cheeseman, J. Hazard. Mater., 2009, 161, 614–626 CrossRef CAS PubMed.
- Z. Wang, C. Hong, Y. Xing, Y. Li and M. Jia, Waste Manage., 2018, 74, 288–296 CrossRef CAS PubMed.
- A. Kijo-Kleczkowska, K. Środa, M. Kosowska-Golachowska, T. Musiał and K. Wolski, Waste Manage., 2015, 46, 459–471 CrossRef CAS PubMed.
- D. Fytili and A. Zabaniotou, Renewable Sustainable Energy Rev., 2008, 12, 116–140 CrossRef CAS.
- H. Xiao, X. Ma and Z. Lai, Appl. Energy, 2009, 86, 1741–1745 CrossRef CAS.
- A. Magdziarz and M. Wilk, Energy Convers. Manage., 2013, 75, 425–430 CrossRef CAS.
- S. H. Deng, X. B. Wang, H. Z. Tan, H. Mikulčić and F. X. Yang, Thermochim. Acta, 2016, 633, 69–76 CrossRef CAS.
- A. S. Akdağ, A. Onur, A. T. Atimtay and F. D. Sanin, Energy, 2018, 158, 417–426 CrossRef.
- M. Otero, X. Gómez, A. I. García and A. Morán, Chemosphere, 2007, 69, 1740–1750 CrossRef CAS PubMed.
- M. B. Folgueras, R. M. Díaz, J. Xiberta and I. Prieto, Fuel, 2003, 82, 2051–2055 CrossRef CAS.
- J. M. Park, S. Keel, J. Yun and J. H. Yun, Korean J. Chem. Eng., 2017, 34, 1–7 CrossRef.
- R. Wang, Z. Zhao, Q. Yin and J. Liu, Fuel, 2017, 199, 578–586 CrossRef CAS.
- R. Hao, Z. Zhang, Q. Zeng, Y. Mao, H. He, X. Mao, F. Yang and Y. Zhao, Energy, 2018, 153, 776–787 CrossRef CAS.
- L. Wang, G. Skjevrak, J. E. Hustad and M. G. Grønli, Fuel Process. Technol., 2012, 96, 88–97 CrossRef CAS.
- L. Wang, G. Skjevrak, J. E. Hustad and M. G. Grønli, Energy Fuels, 2011, 25, 5775–5785 CrossRef CAS.
- A. Grimm, N. Skoglund, D. Boström and M. Öhman, Energy Fuels, 2011, 25, 937–947 CrossRef CAS.
- H. Li, K. Han, Q. Wang and C. Lu, Energy Fuels, 2015, 29, 2555–2563 CrossRef CAS.
- Q. Zhang, H. Liu, Y. Qian, M. Xu, W. Li and J. Xu, Fuel Process. Technol., 2013, 110, 218–226 CrossRef CAS.
- R. W. Bryers, Prog. Energy Combust. Sci., 1996, 22, 29–120 CrossRef CAS.
- A. Kijo-Kleczkowska, K. Środa, M. Kosowska-Golachowska, T. Musiał and K. Wolski, Waste Manage., 2016, 53, 165–181 CrossRef PubMed.
- X. Qi, G. Song, W. Song, S. Yang and Q. Lu, J. Energy Inst., 2018, 91, 397–410 CrossRef CAS.
- S. Niu, M. Chen, Y. Li and F. Xue, Fuel, 2016, 178, 129–138 CrossRef CAS.
- S. A. Scott, J. S. Dennis, J. F. Davidson and A. N. Hayhurst, Fuel, 2006, 85, 1248–1253 CrossRef CAS.
- Y. Z. Li, X. Q. Ma, Y. T. Tang and Z. L. Cai, Adv. Mater. Res., 2013, 772, 487–494 Search PubMed.
- Y. Liao and X. Ma, Appl. Energy, 2010, 87, 3526–3532 CrossRef CAS.
- H. Mikulcic, E. V. Berg, M. Vujanovic and N. Duic, Waste Manage. Res., 2014, 32, 661–669 CrossRef CAS PubMed.
- N. Zhang, X. A. Ning and J. B. Zhou, Appl. Mech. Mater., 2011, 55–57, 1132–1137 CAS.
- R. N. Coimbra, S. Paniagua, C. Escapa, L. F. Calvo and M. Otero, Waste Biomass Valorization, 2016, 7, 995–1006 CrossRef CAS.
- H. Liu, M. Lu, P. Xu and Q. Wang, J. Therm. Anal. Calorim., 2017, 130, 1191–1200 CrossRef CAS.
- R. N. Coimbra, S. Paniagua, C. Escapa, L. F. Calvo and M. Otero, Renewable Energy, 2015, 83, 1050–1058 CrossRef.
- Y. Lin, Y. Liao, Z. Yu, S. Fang and X. Ma, Thermochim. Acta, 2017, 653, 71–78 CrossRef CAS.
- Z. H. Zhao, R. K. Wang, J. H. Wu, Q. Q. Yin and C. B. Wang, Energy, 2019, 171, 809–818 CrossRef CAS.
- M. Pronobis, Biomass Bioenergy, 2005, 28, 375–383 CrossRef CAS.
- J. C. V. Dyk, Miner. Eng., 2006, 19, 280–286 CrossRef.
- G. Dunnu, J. Maier and G. Scheffknecht, Fuel, 2010, 89, 1534–1540 CrossRef CAS.
- R. Heikkinen, R. S. Laitinen, T. Patrikainen, M. Tiainen and M. Virtanen, Fuel Process. Technol., 1998, 56, 69–80 CrossRef CAS.
| This journal is © The Royal Society of Chemistry 2019 |

