 Open Access Article
Creative Commons Attribution 3.0 Unported Licence
Preparation and characterization of Fe3O4@SiO2@TiO2–Co/rGO magnetic visible light photocatalyst for water treatment
Congzhi Fu ,
Xijun Liu*,
Yuwei Wang,
Li Li and
Zihao Zhang
College of Materials Science and Engineering, Qiqihar University, Heilongjiang, Qiqihar 161006, China. E-mail: 1104611198@qq.com; liuxijun2002@163.com; wyw032378@163.com; qqhrll@163.com; 570028946@qq.com
First published on 28th June 2019
Abstract
In this work, Fe3O4@SiO2@TiO2–Co/rGO magnetic photocatalyst was successfully prepared by a sol–gel method and a hydrothermal method. The crystalline structure and performance of the resulting catalyst have been characterized by scanning electron microscopy (SEM), transmission electron microscopy (TEM), X-ray diffraction (XRD), X-ray photoemission spectroscopy (XPS), Fourier transform infrared (FT-IR) spectroscopy and ultraviolet-visible light (UV-Vis) spectroscopy. The magnetic photocatalyst consists of Fe3O4@SiO2@TiO2–Co active particles and rGO carriers. The active particles have a double-shell core–shell structure with a size of about 500 nm and are supported on the rGO lamellae. TiO2 doping with a small amount of metal Co and rGO can significantly improve the catalytic effect of magnetic photocatalyst, and rGO can also significantly improve the adsorption of pollutants by magnetic photocatalyst. The catalyst exhibited high photocatalytic activity in the degradation of methylene blue (MB) under visible light. 92.41% of this ability was retained after five times of repetitive use under the same conditions. The magnetic photocatalyst is easy to recover, and a recovery rate of 93.88% is still maintained after repeated use for 5 times.
1. Introduction
Environmental pollution is considered to be the most serious and the most difficult problem that currently plagues human beings, and the problem of water pollution is even more important. Printing and dyeing wastewater is a kind of polluted wastewater with high chroma, high organic pollution content, complex composition, high chemical oxygen demand (COD) and high biological oxygen demand (BOD). It has seriously affected the quality of human life and the natural environment.1 In fact, the water treatment includes catalytic reduction of pollutants2–5 and adsorption removal of pollutants.6,7 However, the adsorption method cannot completely remove pollutants, and there is a problem of secondary pollution, which requires further follow-up treatment. Studies have shown that photocatalytic oxidation has been considered as the most effective method for treating printing and dyeing wastewater, which has become the focus of research and development by scientists in various countries.8 Studies have shown that advanced oxidation processes (AOPs) as the most effective methods for degradation of organic pollutants at present.9 TiO2 photocatalytic degradation is the most appropriate and available method of AOPs for the oxidation of organic compounds.10 Nano-TiO2 has excellent photocatalytic activity,11 and the photocatalytic efficiency is dependent on the crystalline phase, particle size and specific surface area. The sol–gel method is an effective method for preparing nano-TiO2.12,13The application of TiO2 in water treatment has been limited, due to the large band gap of TiO2 (about 3.2 eV which can only use 3% of solar energy), recombination of generated electrons and also difficult recycle of TiO2 particles. The researchers have combined TiO2 with metals, doped with semiconductors with narrow band gap, and carbon-based nanomaterials with unique structures (such as carbon nanotubes, graphene and graphite oxide) are used for compounding in order to improve the photocatalytic characteristics of TiO2 catalyst.14–18 At present, slight doping of TiO2 with transition metals such as cobalt (Co2+) has been widely investigated to show that the doped particle has a better photocatalytic ability.19,20 Not only can be the photocatalytic degradation efficiency of TiO2 be improved, but also the band gap width of TiO2 can be reduced so that it also has light response in the visible light region, thus improving the utilization rate of sunlight.21–24 On the other hand, graphene, new nanostructure of carbon, has proper mobility of electrons, large specific area and special thermal and electrical conduction.25,26 In recent years, semiconductor-graphene has been widely investigated owing to the unique properties of graphene.27 Graphene oxide (GO) is obtained by oxidation of graphene and contains a large amount of oxygen-containing functional groups on the surface, which allows the nanoparticles to successfully adhere to the surface.28 The reduced graphene oxide (rGO) is obtained by high temperature reaction or the action of strong reducing agent.29,30 RGO can fill the shortcomings of low conductivity of TiO2 and improve electrochemical performance when TiO2 and rGO form composite material.31 RGO in composition with TiO2 could act as an effective contaminant adsorbent and decrease electron–hole pairs recombination rate.32 Previous studies have shown that higher photocatalytic activity of these nanocomposites compared to pure TiO2.33
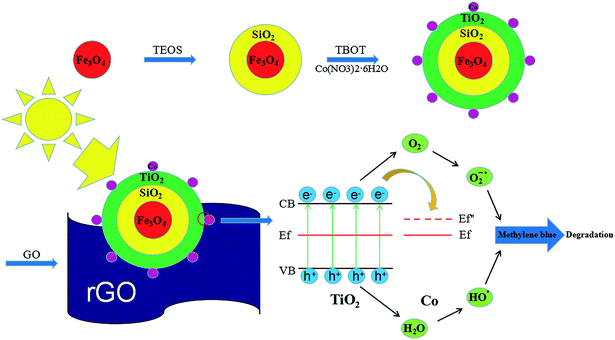
One of the other issues which can limit the application of TiO2–Co/rGO photocatalyst is the separation of photocatalyst from reaction solution.34,35 Magnetic photocatalyst provides a practicable method for separating catalyst and aqueous solution, in a magnetic field. Hence, in this study, we prepared a novel photocatalyst of Fe3O4@SiO2@TiO2–Co supported by rGO. Provide magnetic properties to the catalyst by designing the Fe3O4 core. To prevent any reduction in catalytic effect of TiO2 because of iron ion destroy the TiO2 crystal structure, SiO2 is utilized for encapsulation of magnetite.36 Fe3O4@SiO2@TiO2–Co/rGO has the characteristics of good dispersibility, strong adsorption and easy recovery. Meanwhile, the photocatalytic performance of the novel photocatalyst was evaluated by degrading methylene blue (MB) under visible light. Fig. 1 shows the schematic of the formation of Fe3O4@SiO2@TiO2–Co/rGO nanocomposite.
2. Experimental
2.1 Reagents and apparatus
2.2 The preparation of Fe3O4@SiO2
Weigh Fe3O4 (0.3 g) into a 100 mL beaker, and dilute HCl (50 mL, 0.1 mol L−1) was added for sonication for 15 min. Then, the Fe3O4 solid was magnetically separated and washed three times with deionized water. The magnetically separated Fe3O4 solid was put into a 250 mL three-necked flask, and deionized water (18 mL) and absolute ethanol (80 mL) were added. Then, NH3 H2O (2 mL) and TEOS (0.6 mL) was slowly added to the solution under stirring which continued for 12 h at room temperature. The Fe3O4@SiO2 NPs were magnetically separated and washed three times with deionized water and absolute ethanol, respectively, and dried at 60 °C under for 12 h.2.3 The preparation of Fe3O4@SiO2@TiO2–Co
Co(NO3)2 (0.08 g) was weighed into a 100 mL beaker, and then A liquid was prepared by sequentially adding H2O (1.5 mL), HNO3 (0.2 mL), and absolute ethanol (20 mL). Weigh Fe3O4@SiO2 (0.2 g) in a 100 mL beaker, add absolute ethanol (20 mL) and glacial acetic acid (0.25 mL), then ultrasonically disperse for 30 min, then add TEOT (5 mL), and mechanically stir for 30 min in a 30 °C water bath to prepare liquid B. The solution A was slowly added dropwise to the solution B, stirred well until a gel was formed, and then aged at 30 °C for 18 h. The obtained gel was dried in an oven at 80 °C for 24 h, and then calcined at 450 °C for 2 h under a nitrogen atmosphere to obtain Fe3O4@SiO2@TiO2–Co powder.2.4 The preparation of Fe3O4@SiO2@TiO2–Co/rGO
Weigh graphene (0.08 g) oxide into a 100 mL beaker, add absolute ethanol (40 mL) and deionized water (20 mL) in turn, and disperse ultrasonically for 1 h. Then SDBS (0.15 g) and Fe3O4@SiO2@TiO2–Co (0.2 g) were added, and ultrasonic dispersion was continued for 1 h. The reaction solution was transferred to a 100 mL autoclave and placed in an oven at 120 °C for 3 h. The product was washed three times with absolute ethanol and deionized water, and then dried at 60 °C for 24 h to obtain Fe3O4@SiO2@TiO2–Co/rGO photocatalyst.2.5 Characterization
The morphology and microstructure of the sample were observed by a scanning electron microscope (SEM, Hitachi S-3400), with an acceleration voltage of 20 kV. Prior to the analysis, the samples were coated with a thin layer of gold. The microstructure and size of sample have been characterized with transmission electron microscope (TEM, Hitachi H-7650), with an acceleration voltage of 100 kV. Dropping the sample dispersion liquid on a copper mesh coated with a carbon film, and drying for observation. X-ray diffraction diffractometer (XRD, Bruker-AXE D8 Advance) with an incident radiation of Cu Kα (50 kV and 50 mA) and scanning range of 10–80° was used on the identification of the crystallographic phase of the sample. Sample chemical composition was confirmed by X-ray photoelectron spectrometry (XPS, Thermo Fisher EscaLab 250Xi). The chemical structure of the sample was analyzed by a Fourier transform infrared spectroscopy (FT-IR, PE Spectrum One), and the sample was mixed with KBr and then pressed for testing. The light response range of the sample was analyzed by an ultraviolet-visible-near-infrared spectrophotometer (UV-Vis-NIR PE Lambda 750).2.6 Photocatalytic activity tests
Photocatalyst (0.3 g) was dispersed into 100 mL of MB aqueous solution with a concentration of 10 mg L−1 in a beaker, and stirred in the dark for 20 min to reach an adsorption–desorption equilibrium. A 300 W Xe lamp was used as the visible light source (the photon flux of the radiation source is about 80 mW cm−2), place the beaker under the light source and adjust the distance between the light source and the liquid surface to 15 cm. During the stirring, 5 mL of suspension was taken every 20 min after commencing irradiation, and then centrifuged and analyzed using a UV-7504 spectrophotometer. Degradation rate (D) was used to measure the degree of degradation of MB (λmax = 664 nm):
 | (1) |
2.7 Photocatalyst recycling tests
Each photodegradation experiment takes 160 min to complete, and the photocatalyst is separated magnetically after the end of the experiment. Washing with deionized water for three times, drying at 80 °C for 2 h, weighing to calculate the recovery rate, and then carrying out a second photodegradation experiment, thus repeating the experiment for 5 times.3. Results & discussion
3.1 X-ray diffraction patterns
Fig. 2 shows the XRD patterns of the produced photocatalyst. It is shown in Fig. 2a that the six peaks at 2 values of 30.0°, 35.3°, 42.9°, 53.5°, 57.0° and 62.4° are corresponding to (220), (311), (400), (422), (511) and (440) planes of the cubic phase of Fe3O4 (JCPDS no. 21-1272), respectively. The diffraction peak of Fe3O4@SiO2 has no significant change compared with Fe3O4, which is mainly because of the coating layer SiO2 belongs to an amorphous body and no new diffraction peak appears. It can be seen from Fig. 2b that the characteristic diffraction peak of Fe3O4 still exists, and the diffraction peaks of TiO2 exhibiting characteristic peaks at 2θ = 25.3° (101), 37.7° (004), 47.9° (200), 54.1° (105), 55.2° (211), 62.7° (204), 68.7° (116) and 74.9 (215) corresponding to the anatase phase of TiO2 (JCPDS no. 21-1272). The shows that the TiO2 particles are successfully coated on the surface of Fe3O4@SiO2 particles, and the diffraction peak of Fe3O4@SiO2 inside the particles is seriously weakened due to the large amount of coating. In addition, the analysis of Fe3O4@SiO2@TiO2–Co/rGO spectra shows that the doping of metal Co and the loading of rGO have not cause the displacement of the characteristic diffraction peak of TiO2, indicating that the metal Co and rGO have no effect on the crystal phase structure of TiO2. At the same time, the diffraction peak of Co is not observed in the XRD pattern of the Fe3O4@SiO2@TiO2–Co/rGO. This may be due to the fact that the doping amount of Co is too small to be detected by XRD. The main diffraction peak of rGO appears at 25.3°, which overlaps exactly with the TiO2 diffraction peak at the same angle.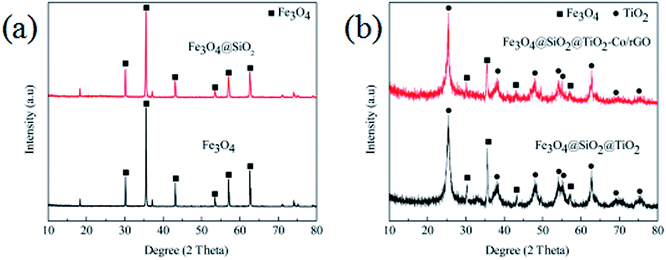 | ||
| Fig. 2 (a) XRD patterns of Fe3O4 and Fe3O4@SiO2, (b) XRD patterns of Fe3O4@SiO2@TiO2 and Fe3O4@SiO2@TiO2–Co/rGO. | ||
3.2 SEM images analysis
The morphologies of the as-prepared Fe3O4, Fe3O4@SiO2, Fe3O4@SiO2@TiO2–Co and Fe3O4@SiO2@TiO2–Co/rGO were evaluated by SEM (Fig. 3). In Fig. 3a, the Fe3O4 NPs are uniform with average particle size of approximately 400 nm and tetragonal body morphology. Comparing Fig. 3a and b, it is not difficult to find that the surface of Fe3O4@SiO2 particles becomes much smoother and the edges and corners gradually become smoother. The particle size increased slightly, and the average thickness increased by about 20–30 nm, indicating that the surface of Fe3O4 was successfully coated with a layer of SiO2. It can be seen from Fig. 3c and d that the surface of Fe3O4@SiO2@TiO2–Co has become very rough, indicating that the surface of Fe3O4@SiO2 has successfully coated a layer of TiO2-doped Co particles and successfully loaded on the rGO lamella, and the magnetic particles were dispersed evenly. It can be seen from the figure that the Fe3O4@SiO2@TiO2–Co/rGO photocatalyst has been successfully prepared.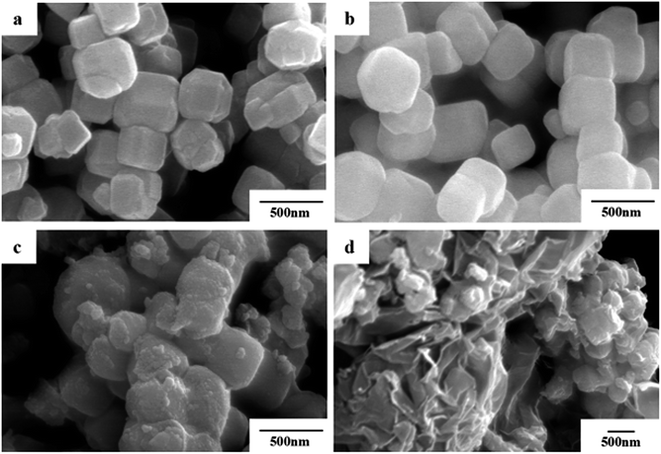 | ||
| Fig. 3 SEM images of (a) Fe3O4, (b) Fe3O4@SiO2, (c) Fe3O4@SiO2@TiO2–Co and (d) Fe3O4@SiO2@TiO2–Co/rGO. | ||
3.3 TEM images analysis
In order to observe the morphology of the magnetic powder more clearly, we conducted a transmission electron microscopy analysis of the sample in 3.3. It can be seen from Fig. 4a that the tetragonal form of the Fe3O4 magnetic powder is clearer. Referring to Fig. 4a and b, it can be clearly seen that Fe3O4@SiO2 is coated with a layer of SiO2 (light color part) with a thickness of about 20–30 nm to form a so-called core–shell structure. It can be seen from Fig. 4c and d that the TiO2-doped Co particles are successfully coated on the surface of Fe3O4@SiO2 to form a double-shell core–shell structure. And successfully loaded onto the surface of rGO forms the quaternary Fe3O4@SiO2@TiO2–Co/rGO magnetic photocatalyst.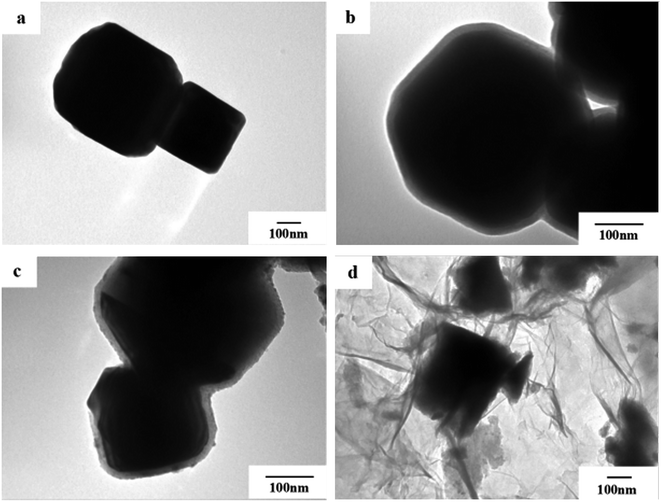 | ||
| Fig. 4 TEM images of (a) Fe3O4, (b) Fe3O4@SiO2, (c) Fe3O4@SiO2@TiO2–Co and (d) Fe3O4@SiO2@TiO2–Co/rGO. | ||
3.4 XPS analysis
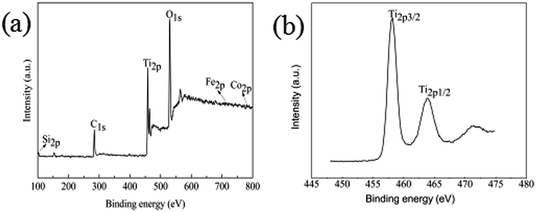
To further confirm the chemical composition and purity of the as synthesize Fe3O4@SiO2@TiO2–Co/rGO, XPS analysis was carried out and its peak is shown in Fig. 5a. The XPS data show that the composition of surface elements is Ti (14.5 at%), Si (7.26 at%), Co (1.26 at%), Fe (0.51 at%), C (29.03 at%) and O (47.44 at%), which indicates that TiO2, SiO2, and Co are presented on the surface, and the C element is provided by rGO. This means that Co is successfully doped, because the amount of metal Co added is small, so the content of Co element is low. Compared with the intense Ti2p and Si2p peaks, the peak of Fe2p3 is almost undetectable, which confirms the Fe3O4 core is almost fully coated by SiO2 and TiO2, resulting in low Fe content. This is consistent with SEM and TEM results and confirms that the structure of the synthesized sample is consistent with the assumptions.It can be seen from Fig. 5b that the binding energies of the Ti2p3/2 and Ti2p1/2 peaks of Fe3O4@SiO2@TiO2–Co/rGO are respectively at 458.2 eV and 463.8 eV. The binding energies of the Ti2p3/2 and Ti2p1/2 peaks of pure TiO2 were respectively at 458.8 eV and 464.5 eV. Compared with the pure TiO2, the peaks of TiO2 doped with metal Co are shifted to the direction of low binding energy, and the interval between the two peaks decreases from 5.7 eV to 5.6 eV. This indicates that the doping of TiO2 by the element Co causes the chemical environment of Ti to change, resulting in a chemical shift. The above results may indicate that part of Ti4+ is replaced by Co2+ to form Ti–O–Co structure.37
3.5 FT-IR spectra analysis
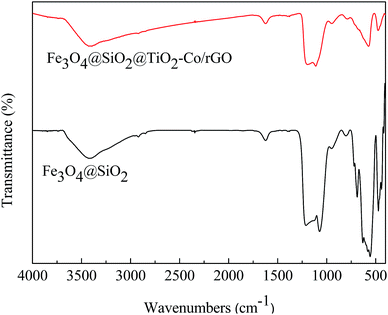
The FT-IR spectrum is shown in Fig. 6. The absorption peaks at 1628 cm−1 and 3406 cm−1 are related to the bending and stretching vibration of the OH group, respectively. In Fe3O4@SiO2, the absorption peaks at 567 cm−1 is correlated to the asymmetric stretching bonds of Fe–O, 1092 cm−1 and 795 cm−1 corresponds to the asymmetric stretching vibration and symmetric stretching vibration of Si–O–Si. In Fe3O4@SiO2@TiO2–Co/rGO, the absorption peaks at 1093 cm−1 is correlated with the asymmetric vibration of Si–O–Si. Since the outer layer of Fe3O4@SiO2 is coated with a TiO2–Co layer, the infrared absorption intensity is lowered. Peaks in the range of 450–700 cm−1 were attributed to Ti–O–Ti and Ti–O–Si vibration. Signals in the range of 1400–1600 cm−1 were attributed to C![[double bond, length as m-dash]](https://www.rsc.org/images/entities/char_e001.gif) C bonding belongs to graphene. Since the amount of metal Co doping is small, no relevant infrared absorption is detected.
C bonding belongs to graphene. Since the amount of metal Co doping is small, no relevant infrared absorption is detected.
3.6 UV-Vis DRS analysis
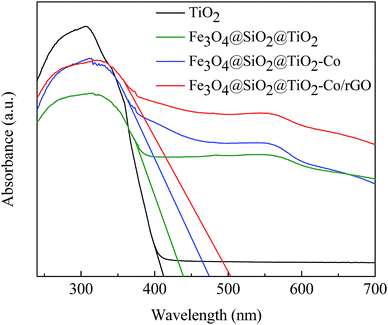
DRS spectra provided information about the wavelength region in which the catalyst absorbs light (Fig. 7). It can be seen that pure TiO2 is absorbed in the ultraviolet region and has almost no absorption in the visible region. The Fe3O4@SiO2@TiO2 magnetic photocatalyst not only absorbs in the ultraviolet region but also has weak absorption in the visible region. However, Fe3O4@SiO2@TiO2–Co and Fe3O4@SiO2@TiO2–Co/rGO magnetic photocatalysts still have strong absorption in the visible region. This is because of the doping of Co reduces the forbidden bandwidth of TiO2, and the calculate the forbidden bandwidth of 2.62 and 2.47 eV by the equation λg = 1240/Eg. Similarly, the forbidden bandwidth of pure TiO2 and Fe3O4@SiO2@TiO2 is 3.01 and 2.83 eV. The forbidden bandwidth of Fe3O4@SiO2@TiO2 magnetic photocatalyst is 0.18 eV lower than that of pure TiO2. The main reason is that SiO2 and TiO2 form a composite semiconductor, which suppresses the recombination of photogenerated electrons and holes, and improves the response range of TiO2 to light. With the introduction of Co, the peak increases correspondingly, indicating that Co doping can promote the absorption of visible light by the photocatalyst. And loading of rGO also leads to the reduction of the forbidden bandwidth of TiO2, thus increasing the response range to light.38 The experimental results show that Fe3O4@SiO2@TiO2–Co/rGO magnetic photocatalyst can also realize the degradation treatment of organic wastewater under visible light irradiation.3.7 Adsorption of MB onto catalyst
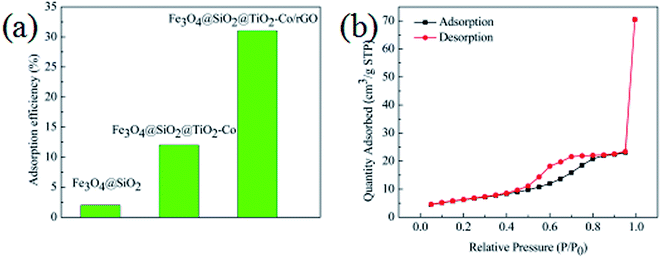
In order to evaluate the adsorption capacity of the magnetic photocatalyst, different situations of the catalyst were added to 10 mg L−1 MB solution stir for 40 min, in the dark environment, and then the residual concentrations of MB were measured using a spectrophotometer. Results as shown in Fig. 8a, the adsorption capacity of Fe3O4@SiO2 was only 2%, and there was almost no adsorption. The adsorption capacity of the Fe3O4@SiO2@TiO2–Co increased to 12%, indicating that the specific surface area of the calcined TiO2 was significantly increased. The adsorption amount of Fe3O4@SiO2@TiO2–Co/rGO reaches 31%, which is because of the large specific surface of rGO with excellent adsorption performance. This is also an important factor to improve the photodegradation efficiency of pollutants.The texture of the as-prepared photocatalyst was characterized by N2 physisorption experiments, and the corresponding N2 adsorption–desorption isotherms is shown in Fig. 8b. It can be seen that the Fe3O4@SiO2@TiO2–Co/rGO photocatalyst have type IV isotherms (according to IUPAC classification), which suggests that it is mesoporous structures.39 The specific surface area test results show that the specific surface area of the sample is 30.17 m2 g−1, and the pore size distribution is mainly between 3.4 and 6.5 nm, which is mainly 4.9 nm mesopores.
3.8 Photocatalytic properties analysis
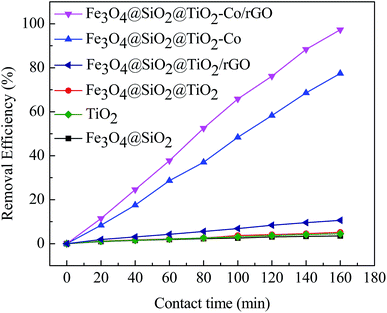
In order to explore the catalytic efficiency of magnetic photocatalyst, we chose MB as a degradation target for photocatalytic degradation experiments. Fig. 9 shows the photocatalytic degradation curves of MB by different samples under visible irradiation. After dark adsorption for 20 min and light for 160 min, the MB degradation of the blank sample is 1.30% while MB degradation of Fe3O4@SiO2, TiO2, Fe3O4@SiO2@TiO2 and Fe3O4@SiO2@TiO2/rGO at 5.58%, 14.65%, 17.07% and 35.23%, respectively. It can be confirmed that these four samples have almost no photocatalytic activity under visible light irradiation. There is no photoactive component sensitive to visible light in these cases. When adding Fe3O4@SiO2@TiO2–Co or Fe3O4@SiO2@TiO2–Co/rGO as catalyst, an obvious photocatalytic degradation for MB is observed, and the percent degradation of MB dyes is significantly increased. The shows that after doping the metal Co, the response area of TiO2 to light is broadened, which results in rapid degradation under visible light irradiation. In the presence of for Fe3O4@SiO2@TiO2–Co, the percent degradation was about 78.63% after 160 min. Under the same conditions, the percent degradation of Fe3O4@SiO2@TiO2–Co/rGO was 98.87%. This is because rGO has excellent conductivity. Valence electrons can move freely on the planar structure of rGO after introducing rGO as the carrier of magnetic photocatalyst. Finally, electron–holes are generated, which can significantly improve the catalytic efficiency of the photocatalyst.3.9 Photocatalyst stability and reusability
In order to evaluate the stability and reusability of the Fe3O4@SiO2@TiO2–Co/rGO magnetic photocatalyst, related experiments were carried out, results as shown in Fig. 10a and b. After completing a photodegradation experiment, the magnetic photocatalyst can be quickly separated from the treated solution by an external magnetic field. It is proved that Fe3O4@SiO2@TiO2–Co/rGO magnetic catalyst has excellent magnetic properties and can completely realize the recycling of magnetic photocatalyst. The Fe3O4@SiO2@TiO2–Co/rGO magnetic photocatalyst was reused for five successive cycles, and degradation rate and recovery rate are shown in Fig. 10c. Photodegradation efficiency and recovery rate remained 92.41% and 93.88% after five cycles, respectively. This result approved that we synthesized Fe3O4@SiO2@TiO2–Co/rGO catalyst is a recyclable and high efficiency magnetic photocatalyst.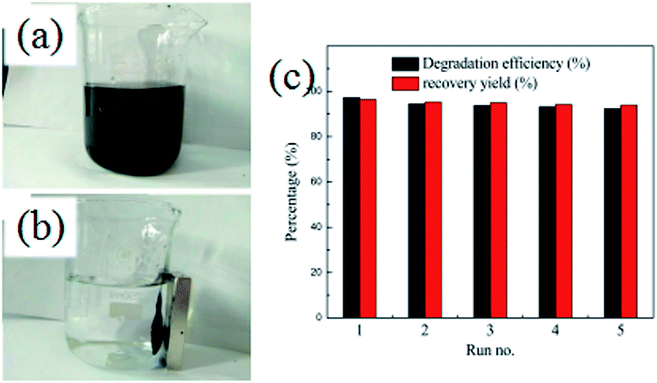 | ||
| Fig. 10 (a and b) Separation of Fe3O4@SiO2@TiO2–Co/rGO by a magnet, (c) recycling experiment for Fe3O4@SiO2@TiO2–Co/rGO. | ||
3.10 Principle analysis
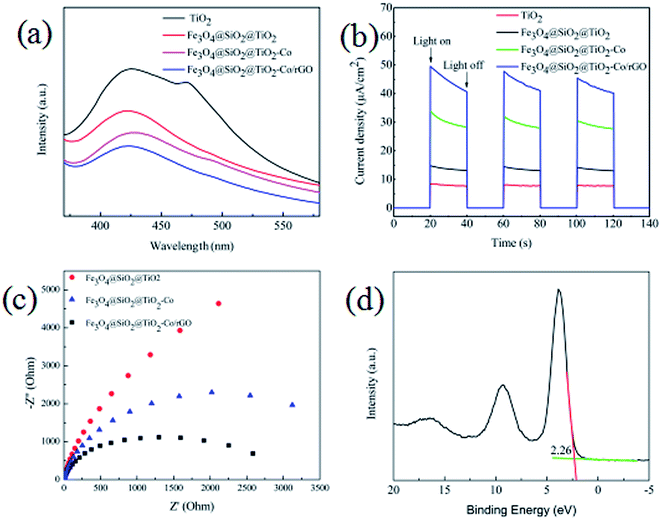
From the results of the photocatalytic activity test and UV-Vis spectra for photocatalyst, we can conclude that SiO2, Co and rGO has a significant effect on promoting TiO2 photocatalytic efficiency. PL spectra can be used to study the charge migration, recombination and transfer during the photocatalytic process, and charge separation efficiency directly affects photocatalytic activity. To explore the effect of SiO2, Co and rGO on promoting the separation of electron–hole pairs, PL emission spectra of TiO2, Fe3O4@SiO2@TiO2, Fe3O4@SiO2@TiO2–Co and Fe3O4@SiO2@TiO2–Co/rGO were measured (Fig. 11a). Clearly, compared with the pure sample of TiO2, the PL strength of Fe3O4@SiO2@TiO, Fe3O4@SiO2@TiO–Co and Fe3O4@SiO2@TiO–Co/rGO samples decreased in turn, indicating SiO2, Co and rGO can effectively separates the electron–hole pairs photogenerated by TiO2. To obtain further evidence to support the analysis of PL spectra, the transient photocurrent experiments were also carried out. As shown in Fig. 11b, the TiO2 pure sample had the weakest photocurrent response due to the quick recombination of photogenerated electron–hole pairs. After SiO2, Co and rGO are added, the photocurrent density of photocatalyst is significantly enhanced. The result indicates that SiO2, Co and rGO can inhibit the recombination rate of electron and hole, and therefore enhance the charge separation efficiency, which is consistent with that of PL spectra.EIS analysis can be used to study the interface migration and reaction capability of the charges in different photocatalytic materials. The EIS test was performed in a conventional three-electrode system with a platinum plate as the auxiliary electrode and a saturated calomel electrode as the reference electrode. Fig. 11c shows the typical EIS Nyquist plots of different photocatalyst, the arc radius on the EIS plots of Fe3O4@SiO2@TiO2–Co and Fe3O4@SiO2@TiO2–Co/rGO was smaller than that of Fe3O4@SiO2@TiO2. It is well known that the smaller the radius is, the lower transfer resistance the interfacial electrons have. It means that the photocatalyst has a better transfer efficiency of photo generated electron–hole pairs. In addition, the arc radius on the EIS plots of Fe3O4@SiO2@TiO2–Co/rGO was smaller than that of Fe3O4@SiO2@TiO2–Co, suggesting that Co doping and rGO loading can made charge transfer easier. This corresponds to the photodegradation efficiency curve shown in Fig. 9.
In addition, the valence band spectrum of Fe3O4@SiO2@TiO2–Co/rGO can be obtained by XPS energy spectrum, which can explain the electronic structure principle more clearly. It can be seen from Fig. 11d that the valence band top (VB) of the photocatalyst is about 2.26 eV, and in combination with the UV-Vis spectrum result, the conduction band bottom (CB) of the sample can be calculated as −0.21 eV according to the formula EVB = ECB + Eg.
4. Conclusions
In summary, the recoverable Fe3O4@SiO2@TiO2–Co/rGO magnetic photocatalyst were successfully prepared by a sol–gel and hydrothermal method. The magnetic photocatalyst consists of Fe3O4@SiO2@TiO2–Co active particles and rGO carrier. The active particles have a double-shell core–shell structure with a size of about 400 nm and are supported on rGO lamellae. Co as a dopant and loading rGO significantly increases the photocatalytic activity of Fe3O4@SiO2@TiO2–Co/rGO catalyst. Moreover, rGO can significantly improve the adsorption of contaminants by magnetic photocatalysts and improve the catalytic efficiency. The magnetic photocatalyst shows excellent photocatalytic activity for MB solution under visible light irradiation and no obvious reduction in photocatalytic discoloration efficiency was observed after five cycles. With its low cost, high photocatalytic activity, high chemical stability and easy magnetic separation, Fe3O4@SiO2@TiO2–Co/rGO magnetic photocatalyst has broad application prospects in large-scale photocatalytic wastewater treatment.Conflicts of interest
There are no conflicts to declare.Notes and references
- J. L. Xie, W. Hong, M. W. Meng, M. K. Tian, C. Y. Kang, Z. M. Zhou, C. S. Chen, Y. H. Tang and G. Y. Luo, Z. Anorg. Allg. Chem., 2018, 23, 1570–1575 CrossRef.
- G. F. Liao, J. Chen, W. G. Zeng, C. H. Yu, C. F. Yi and Z. S. Xu, J. Phys. Chem. C, 2016, 120, 25935–25944 CrossRef CAS.
- G. F. Liao, Q. Li, W. Z. Zhao, Q. H. Pang, H. Y. Gao and Z. S. Xu, Appl. Catal., A, 2018, 549, 102–111 CrossRef CAS.
- G. F. Liao, W. Z. Zhao, Q. Li, Q. H. Pang and Z. S. Xu, Chem. Lett., 2017, 46, 1631–1634 CrossRef CAS.
- G. F. Liao, J. S. Fang, Q. Li, S. H. Li, Z. S. Xu and B. Z. Fang, Nanoscale, 2019, 11, 7062–7096 RSC.
- X. Q. Qiao, F. C. Hu, F. Y. Tian, D. F. Hou and D. S. Li, RSC Adv., 2016, 6, 11631–11636 RSC.
- G. Y. Zhao, L. J. Liu, J. R. Li and Q. Liu, J. Alloys Compd., 2016, 664, 169–174 CrossRef CAS.
- K. Huang and Z. Y. Cai, Z. Anorg. Allg. Chem., 2018, 18, 1072–1077 CrossRef.
- H. Suzuki, S. Araki and H. Yamamoto, J. Water Process Eng., 2015, 7, 54–60 CrossRef.
- H. Wang, H. L. Wang, W. F. Jiang and Z. Q. Li, Water Res., 2009, 43, 204–210 CrossRef CAS PubMed.
- M. C. Wang, L. Peng, J. H. Wang, C. Q. Li, L. H. Guan and Y. Q. Lin, J. Nanosci. Nanotechnol., 2018, 12, 7372–7379 Search PubMed.
- W. H. Dong, F. Pan, L. L. Xu, M. R. Zheng, C. H. Sow, K. Wu, G. Q. Xu and W. Chen, Appl. Surf. Sci., 2015, 349, 279–286 CrossRef CAS.
- G. X. Zhang, A. K. Song, Y. M. Duan and S. L. Zheng, Microporous Mesoporous Mater., 2018, 255, 61–68 CrossRef CAS.
- L. Zhang, Z. Wu, L. W. Chen, L. J. Zhang, X. L. Li, H. F. Xu, H. Y. Wang and G. Zhu, Solid State Sci., 2016, 52, 42–48 CrossRef CAS.
- W. W. Zhong, W. G. Tu, S. S. Feng and A. J. Xu, J. Alloys Compd., 2019, 772, 669–674 CrossRef CAS.
- W. W. Zhong, S. j. Shen, S. S. Feng, Z. P. Lin, Z. P. Wang and B. Z. Fang, CrystEngComm, 2018, 20, 7851–7856 RSC.
- Y. P. Liu, S. J. Shen, J. T. Zhang, W. W. Zhong and X. H. Huang, Appl. Surf. Sci., 2019, 478, 762–769 CrossRef CAS.
- W. W. Zhong, Z. P. Lin, S. S. Feng, D. Wang, S. J. Shen, Q. H. Zhang, L. Gu, Z. P. Wang and B. Z. Fang, Nanoscale, 2019, 11, 4407–4413 RSC.
- H. Liu, X. N. Dong, X. C. Wang, C. C. Sun, J. Q. Li and Z. F. Zhu, Chem. Eng. J., 2013, 230, 279–285 CrossRef CAS.
- J. G. Yu, Y. Wang and W. Xiao, J. Mater. Chem. A, 2013, 36, 10727–10735 RSC.
- P. Zhou, J. G. Yu and Y. X. Wang, Appl. Catal., B, 2013, 142, 45–53 CrossRef.
- G. F. Liao, J. S. Fang, Q. Li, S. H. Li, Z. S. Xu and B. Z. Fang, Nanoscale, 2019, 11, 7062–7096 RSC.
- G. F. Liao, Y. Gong, L. Zhang, H. Y. Gao, G. J. Yang and B. Z. Fang, Energy Environ. Sci., 2019 10.1039/c9ee00717b.
- M. Hamadanian, A. R. Vanani and A. Majedi, J. Iran. Chem. Soc., 2010, 7, 52–58 CrossRef.
- S. Mugundan, B. Rajamannan, G. Viruthagiri, N. Shanmugam, R. Gobi and P. Praveen, Appl. Nanosci., 2015, 5, 449–456 CrossRef CAS.
- K. I. Bolotin, K. J. Sikes and Z. Jiang, Solid State Commun., 2008, 146, 351–355 CrossRef CAS.
- L. L. Tan, S. P. Chai and A. R. Mohamed, ChemSusChem, 2012, 5, 1868–1882 CrossRef CAS PubMed.
- Y. Li, P. P. Zhang, Z. F. Ouyang, M. F. Zhang, Z. J. Lin, J. F. Li, Z. Q. Su and G. Wei, Adv. Funct. Mater., 2016, 26, 2122–2134 CrossRef CAS.
- L. T. Soo, K. S. Loh, A. B. Mohamad, W. R. W. Daud and W. Y. Wong, J. Power Sources, 2016, 324, 412–420 CrossRef CAS.
- N. I. Zaaba, K. L. Foo, U. Hashim, S. J. Tan, W. W. Liu and C. H. Voon, Procedia Eng., 2017, 184, 469–477 CrossRef CAS.
- H. Chen, M. Q. Wang, Y. A. Yu, H. Liu, S. Y. Lu, S. Y. Bao and M. W. Xu, ACS Appl. Mater. Interfaces, 2017, 9, 35040–35047 CrossRef CAS PubMed.
- H. Y. Shang, M. Ma, F. S. Liu, Z. Miao and A. P. Zhang, J. Nanosci. Nanotechnol., 2019, 6, 3376–3387 CrossRef PubMed.
- P. Ribao, M. J. Rivero and I. Ortiz, Environ. Sci. Pollut. Res., 2017, 24, 12628–12637 CrossRef CAS PubMed.
- H. Khojasteh, M. Salavat-Niasari, M. P. Mazhar and M. Hamadanian, RSC Adv., 2016, 81, 78043–78052 RSC.
- Y. Zhou, Y. H. Zhu, X. L. Yang, J. F. Huang, W. Chen, X. M. Lv, C. Y. Li and C. Z. Li, RSC Adv., 2015, 62, 50454–50461 RSC.
- X. Xu, F. Ji, Z. Fan and L. He, Int. J. Environ. Res. Public Health, 2011, 8, 1258 CrossRef CAS PubMed.
- Y. D. Liu, F. Xin, F. M. Wang, S. X. Luo and X. H. Yin, J. Alloys Compd., 2010, 498, 179–184 CrossRef CAS.
- M. Teimouri, S. Waqif-Husain, M. Saber-Tehrani and P. Abroomand-Azar, Int. J. Environ. Sci. Technol., 2016, 13(12), 2797–2804 CrossRef.
- K. S. W. Sing, R. A. W. Haul, L. Moscou, R. A. Pierotti, J. Rouquerol and T. Siemieniewska, Pure Appl. Chem., 1985, 57, 603–619 CAS.
| This journal is © The Royal Society of Chemistry 2019 |

