 Open Access Article
A novel water-soluble naked-eye probe with a large Stokes shift for selective optical sensing of Hg2+ and its application in water samples and living cells†
Yingying Zhang‡
a,
Chao Zhang‡a,
Yingnan Wu‡b,
Bing Zhao‡a,
Liyan Wang‡a and
Bo Song‡ *a
*a
aCollege of Chemistry and Chemical Engineering, Qiqihar University, Qiqihar 161006, Heilongjiang, China. E-mail: songboliu@sina.com; Tel: +86 13946272680
bInstitute of Molecular Sciences and Engineering, Shandong University, Qingdao 266237, Shandong, China
First published on 29th July 2019
Abstract
A water-soluble and colorimetric fluorescent probe with a large Stokes shift (139 nm) for rapidly detecting Hg2+, namely Hcy-mP, was synthesized by using an indole derivative and 2,4-dihydroxybenzaldehyde as starting materials. This probe demonstrates good selectivity for Hg2+ over other metal ions including Ag+, Pb2+, Cd2+, Cr3+, Zn2+, Fe3+, Co2+, Ni2+, Cu2+, K+, Na+, Mg2+, and Ca2+ in aqueous solution. With the increase in concentration of Hg2+, the color of the solution changed from pale yellow to pink and the fluorescence intensity decreased slightly. When 5-equivalents of EDTA were added to the solution with Hg2+, the fluorescence intensity of this probe was restored. The probe has been applied to the detection of Hg2+ in real water samples. Moreover, this probe was confirmed to have low cytotoxicity and excellent cell membrane permeability. The effect of Hcy-mP–Hg2+ towards living cells by confocal fluorescence was also investigated.
Introduction
Among heavy metal cations, Hg2+ is one of the most toxic and dangerous ions even at a low concentration. Hg2+ pollution was caused by many natural and human factors to a large extent, and is harmful to living creatures.1,2 Once the organism is exposed to a Hg2+ environment, a variety of severe health problems arise.3,4 For instance, Hg2+ can disturb some metabolic processes involving proteins and enzymes.5 And Hg2+ has been recognized as one of the reason for various cognitive and motion disorders, as well as prenatal brain damage and DNA lesions.6–9 Hg2+ can be accumulated through the food chain and subsequently affect people's health.10 Thus, it is important for us to develop a useful, efficient and sensitive approach to detect Hg2+.Currently, there are many available ways to detect Hg2+, but the fluorescence-based approach has attracted more attention.11–15 In recent years, fluorescent probes were used as cation sensors due to their significant advantages such as high sensitivity and selectivity, and rapid response for analytical, biomedical and environmental science.16–18 They were also found to be applied in analytical, biomedical and environmental science.19 However, most of the inventive probes have some drawbacks. For example, the synthesis process of some probes is relatively complex, and the post-processing is cumbersome.20–23 Lots of probes not only have poor aqueous solubility but also have short emission wavelength, which are both shortcomings that can cause a certain degree of damage towards cells.24,25 Considering these shortcomings of the currently applied probes and the extreme toxicity of Hg2+, it is imperative to develop more fluorescent sensors with long emission wavelengths, low toxicity and simple synthesis methods for the rapid detection of Hg2+ in the environment and biological systems.
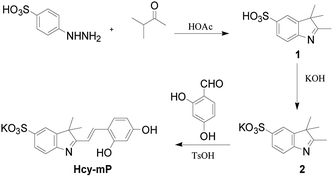
On this basis, a simple fluorescent probe based on an indole ring, 2-(2,4-dihydroxystyrene)-3,3-dimethyl-3H-indole-5 potassium sulfonate (Hcy-mP) was designed and synthesized. This probe can be used to detect Hg2+ in aqueous solutions by fluorescent analyses with high selectivity and sensitivity, distinguishing it from other common cations. In the Hg2+ recognition process, the color of the probe solution changed obviously from light yellow to pink, which can be recognized clearly by the naked eye. Moreover, the selective detection of probe Hcy-mP towards Hg2+ was completely reversible upon the addition of EDTA. Then, the probe was successfully used for detection of Hg2+ in water samples. Hcy-mP performed well in the biological experiments, demonstrating that this probe can be applied to detect intracellular Hg2+ (Scheme 1).
Results and discussion
Synthesis
A sulfonate group was introduced into the indole ring to improve the water solubility and the photostability of this probe.26 Compound 1 was synthesized by two steps and compound 2 was obtained by alkylating of compound 1 with KOH. Finally, the target compound Hcy-mP was obtained by reaction with aldehyde in 85% yield under acidic condition. The 1H NMR of the final compound shows the peaks position of the hydroxyl group of the compound were around 11.07 ppm and 10.78 ppm, and the peaks position of the double bond were around 7.10–7.12 ppm (ESI†). These signs indicate that the target product has been successfully synthesized.UV absorbance and fluorescence emission spectra of Hcy-mP
Owing to the sulfonate groups unit in Hcy-mP, this probe possesses a full-water solubility, so we investigated the spectra of probe Hcy-mP in 100% aqueous solution (pH = 7.0–7.4).Under medium environment, fluorescence emission spectra of Hcy-mP exhibits the maximum at 517 nm with excitation at 378 nm, and large Stokes shift of 139 nm was observed (Fig. 1). The large Stokes shift of this probe with can reduce the self-absorption to avoid self-quenching and quantitative detection error from excitation light.
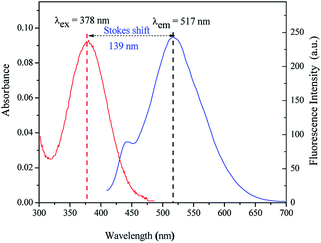 | ||
| Fig. 1 Absorption and emission spectra of Hcy-mP (λex = 378 nm, λem = 517 nm, Stokes shift = 139 nm). | ||
Cation-sensing properties
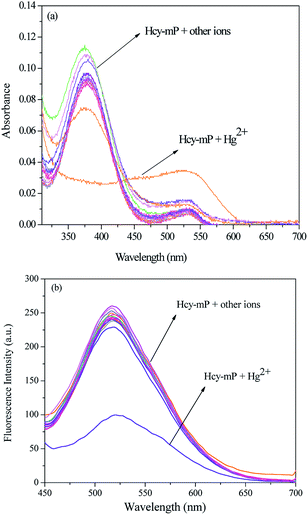
It is widely agreed that high selectivity is required for the probe to recognize the target ion from other various ions. The sensitivity of Hcy-mP was tested by mixed with different metal ions (20 μM) (Ag+, Pb2+, Cd2+, Cr3+, Zn2+, Fe3+, Co2+, Ni2+, Cu2+, K+, Na+, Mg2+, and Ca2+), respectively. Hcy-mP exhibited excellent selectivity in both absorbance and emission spectra. With addition of Hg2+, the maximum UV-absorption of the probe was red-shift from 378 nm to 517 nm, as well as the absorbance declined (Fig. 2a) and the fluorescence intensity was significantly quenched at 517 nm with the fluorescence quantum yield (Φ) of 0.11 relative to rhodamine B solution (in methanol) (Fig. 2b). In contrast, the addition of other metal ions has little influence on the absorbance and fluorescence intensity of the probe. These results indicate that the probe could be used as an effective tool for detecting Hg2+.At the same time, the selectivity and anti-interference performance of this probe with other related metal cations were also investigated in the presence/absence of Hg2+. As can be seen from Fig. 3, this probe shows significant higher selectivity for Hg2+ than other metal cations, which indicates that the specific response of Hcy-mP to Hg2+ was not disturbed by other cations.
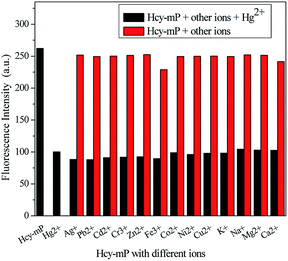 | ||
| Fig. 3 Fluorescence intensity of Hcy-mP (10 μM) upon addition of metal ions (20 μM) and addition of Hg2+ (10 μM) in HEPES buffer solution (λex = 378 nm, silt = 10 nm). | ||
Titration experiment
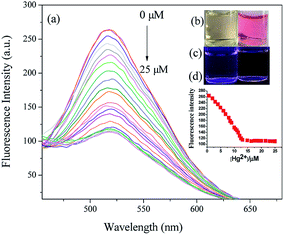
The fluorescence titration experiment was carried out by adding different concentrations of Hg2+ from 0–25 μM to Hcy-mP (10 μM) solution in HEPES buffer solution. As shown in Fig. 4a, the fluorescence intensity at 517 nm of Hcy-mP decreased gradually with the addition of Hg2+. This result indicates that Hcy-mP has high selectivity to Hg2+.In addition, the addition of Hg2+ changed the color of the solution from pale yellow to pink, indicating that this probe could be used for naked eye recognition. These phenomena prove that the qualitative and quantitative detection of Hg2+ can be achieved, respectively by this probe (Fig. 4b–d).
According to the Benesi–Hildebrand curve, the association constant (Ka) between the probe and Hg2+ was calculated to be 1.2 × 10⁻⁴ M−1 (R2 = 0.9866) (Fig. S1†), which indicates that this probe has excellent binding ability to Hg2+. By using the fluorescence titration experiment of Hcy-mP to Hg2+, the detection limit was improved to as low as 1.08 μM (R2 = 0.9914) (Fig. S2†). The detection limit is excellent value to detect the submillimolar concentration of the Hg2+ in many biological systems.
Sensitivity study
Reaction time and stability are important factors to assess the performance of a novel probe. The fluorescence intensity of Hcy-mP to Hg2+ was monitored in 2 h at λex = 378 nm. As shown in Fig. 5, the fluorescence intensity of Hcy-mP with Hg2+ is quenched obviously in 10 min, slowed down in the following experimental time and kept steady, which indicate that this probe could rapidly identify Hg2+ in aqueous solution and can be used as a sensitive probe for environmental analysis.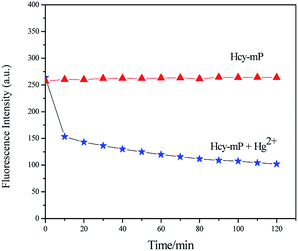 | ||
| Fig. 5 Effect of reaction time on fluorescence emission spectra of Hcy-mP and Hcy-mP with Hg2+ (20 μmol L−1). | ||
EDTA experiment
The EDTA experiment was used to assess the reversibility of Hcy-mP with Hg2+ in HEPES (pH = 7.0) solution. When EDTA (10 μM) was added to solution of Hcy-mP–Hg2+, the absorbance and fluorescence intensity were enhanced again in several seconds (Fig. 6a and b). Then added Hg2+ and then added EDTA again in following circles, similar changes were appeared in both absorbance and fluorescence intensity of the probe. These experiments illustrate that the coordination process is reversible. And fluorescence intensity changes of the probe at 517 nm when adding compounds (Hg2+and EDTA) for 4 cycles prove that Hcy-mP can be used as a reversible fluorescence probe in practical application (Fig. 6c).Effect of pH
Moreover, the fluorescent property of Hcy-mP in the absence and presence of Hg2+ were investigated at different pH values range from 2.0 to 12.0. As shown in Fig. S3,† when the pH value is between 2.0 and 5.0, the fluorescence intensity of Hcy-mP is similar to Hcy-mP with Hg2+. At the pH values range from 5.0 to 11.0, the fluorescence intensity of Hcy-mP solution with Hg2+ was significantly lower than that of Hcy-mP. This result indicates that Hcy-mP could act as a fluorescence probe for detecting Hg2+ at a wide pH range.Investigation of the binding mode
In order to speculate the Hg2+ recognition site on Hcy-mP, another compound Hcy-pP (Scheme 2) was synthesized. The synthesis routes of Hcy-pP were similar to Hcy-mP (ESI†). The fluorescence emission spectra of Hcy-pP (10 μM) with different metal cations (20 μM) were measured. As shown in Fig. 7, compared with the fluorescence intensity of Hcy-pP, fluorescence intensity of Hcy-pP solution with different metal cations was not increased obviously. This result shows that the presence of those ions have no influence on the fluorescence intensity of probe Hcy-pP, which further indicates that the 4-hydroxy in the compound does not have impacts on Hcy-mP recognize the metal cations.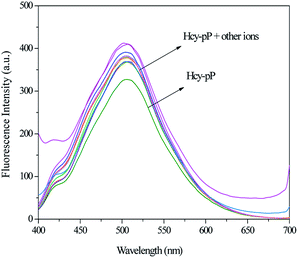 | ||
| Fig. 7 Fluorescence spectra of Hcy-pP (10 μM) upon the addition of different metal ions (20 μM) in HEPES buffer solution. | ||
Then we studied the ESI-MS data of Hcy-mP–Hg2+. As shown in Fig. S4 and S5,† from the ESI-MS (negative mode), the detection value of [Hcy-mP + Hg2+]− is 559.0153 (m/z) (calc. = 558.9870), [Hcy-mP + Hg2+ + K+ + H+]+ is 599.0763 (m/z) (calc. = 599.2904) which confirms the binding ration of the Hcy-mP with Hg2+ is 1![[thin space (1/6-em)]](https://www.rsc.org/images/entities/char_2009.gif) :
:![[thin space (1/6-em)]](https://www.rsc.org/images/entities/char_2009.gif) 1.
1.
In order to further study the binding mode of Hcy-mP–Hg2+, job plot experiment also was conducted. As shown in Fig. 8, the fluorescence intensity at 517 nm was plotted against the [Hcy-mP]/[Hcy-mP + Hg2+] (10 μM). The two lines intersected when the mole fraction of metal was 0.5 which indicates the binding ratio for the complex between Hcy-mP and Hg2+ is 1![[thin space (1/6-em)]](https://www.rsc.org/images/entities/char_2009.gif) :
:![[thin space (1/6-em)]](https://www.rsc.org/images/entities/char_2009.gif) 1.
1.
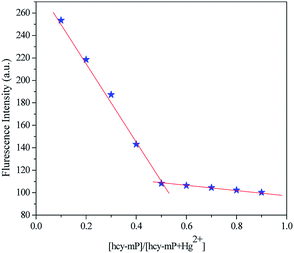 | ||
| Fig. 8 Job plot of the Hcy-mP–Hg2+ mixture in HEPES (pH = 7.0) solution, keeping the total concentration of Hcy-mP and Hg2+ at 10 μM. The observed wavelength was 517 nm. | ||
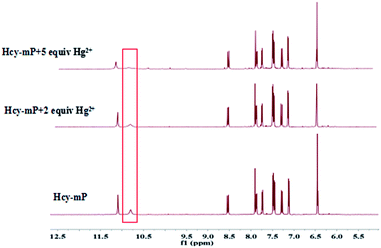
According to the current studies,27–29 the mode of metal ions combine with the probe can be done based on 1H NMR titration experiments, the binding mode of Hcy-mP with Hg2+ was investigated by using this method. As shown in Fig. 9, the comparison of the 1H NMR spectra of Hcy-mP and Hcy-mP mixed with 2 and 5 equivalent of Hg2+ tells that the 2′OH proton was gradually disappeared when Hg2+ (10 μM) was added to Hcy-mP solution which reveals that Hg2+ combines with the 2′OH oxygen of the probe.
Above research shows a 1![[thin space (1/6-em)]](https://www.rsc.org/images/entities/char_2009.gif) :
:![[thin space (1/6-em)]](https://www.rsc.org/images/entities/char_2009.gif) 1 binding ratio for Hcy-mP mixture, the proposed structure of Hcy-mP complex was shown in Scheme 3.
1 binding ratio for Hcy-mP mixture, the proposed structure of Hcy-mP complex was shown in Scheme 3.
Application in water samples
Due to the high sensitivity and excellent selectivity fluorescence properties of Hcy-mP for detecting Hg2+, the probe Hcy-mP was further investigated for determination of Hg2+ in environment samples. These samples were spiked with Hg2+ at different concentrations, and the fluorescence responses of Hcy-mP toward all samples were examined by the fluorescence emission spectra, respectively. Each sample was analyzed with their three replicates. As shown in Table S1,† the results obtained of real samples shows good agreement with Hg2+ spiked samples. The probe shows excellent recovery in the range of 95–103% with the low relative standard deviations RSD (0.7–2.3%), indicating that the probe has high sensitivity and good reliability for determination of Hg2+ in practical samples of environment.Cytocompatibility assay analysis
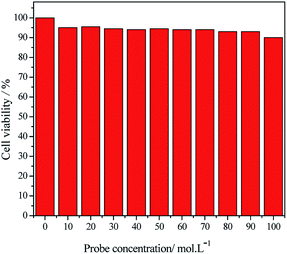
In order to investigate whether this probe can be applied in living cells, the cell compatibility of probe was first studied. Results are shown in Fig. 10.The above result shows that the survival rates of HeLa cells decrease slightly with the increasing of probe concentrations (10 μM, 20 μM, 30 μM, 40 μM, 50 μM, 60 μM, 70 μM, 80 μM, 90 μM and 100 μM). The survival rate of HeLa cells is still greater than 85% when using high probe concentration, which indicates that the probe has high biocompatibility and low cytotoxicity. Therefore, the probe Hcy-mP can be employed in cell imaging for further investigation.
Intracellular confocal fluorescent imaging
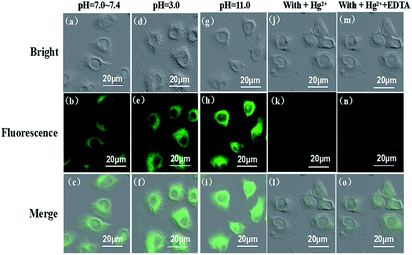
Cell images were obtained using confocal fluorescence microscopy. Fluorescence images of HeLa cells labeled with Hcy-mP were monitored upon the excitation at 517 nm, as shown in Fig. 11b, e, h, k and n. HeLa cells were incubated with Hcy-mP (10 μM) in different pH values (pH 7.4, 3.0, 11.0) for 30 min at 37 °C. Bright field images were shown in Fig. 11a, d, g, j and m. It is worth noting that the merge of fluorescence and bright field images (Fig. 11c, f, i, l and o) confirmed that the fluorescence signal was only located in the intracellular area. Obviously, without the presence of Hg2+, the fluorescence intensity of cells under acidic conditions (Fig. 11e) was stronger than neutral conditions (Fig. 11h), and the fluorescence intensity under alkaline condition was stronger than acidic condition, which indicates that the probe can be used in a wide pH value range. Then the treated cells were washed with PBS three times and incubated with HgCl2 (20 μM) in culture medium (pH 7.4) (Fig. 11j). Bright green fluorescence appeared an apparently quenched in HeLa cells (Fig. 11k). As shown in Fig. 11n, the green fluorescence was restored in cells upon further treatment with EDTA (20 μM). Hence, the probe is cell membrane permeable and can be applied for detecting pH and Hg2+ in living cells.Experimental sections
Material and apparatus
All chemical reagents and solvents were purchased from commercial suppliers and were used without further purification unless otherwise noted.2,4-Dihydroxybenzaldehyde was purchased from Aladdin Reagent Co., Ltd. 1H and 13C NMR spectra were recorded on AVANCE 600 MHz NMR spectrometer (Bruker biospin, Switzerland). High resolution mass spectrometry (HRMS) data were obtained with Waters LCT Premier XE spectrometer (Waters, American). Absorption spectra were measured on TU-1901 double-beam UV-vis spectrophotometer (Beijing Purkinje General Instrument Co., LTD, Beijing, China). Fluorescence emission was detected on Varian Cary Eclipse (PerkinElmer, American) spectrophotometer. Fluorescent images were taken on a FV1000 confocal laser scanning microscope (Olympus Co., Ltd. Japan) with an objective lens. Deionized water was obtained from Milli-Q water purification system (Millipore). pH values were measured with a Beckman Φ 50 pH meter (Shanghai LeiCi Device Works, Shanghai, China). The solutions of metal ions were prepared by using the corresponding nitrate salts.
Synthesis procedures and characterizations
Compound (1) and (2) were synthesized according to the method described in a previous literature.30A solution of compound 2 (0.280 g, 1.0 mmol), 2,4-dihydroxy-1-benzaldehyde (0.249 g, 1.5 mmol) and p-methyl benzenesulfonic acid (0.175 g, 1.0 mmol) in anhydrous ethanol (10.0 mL) were refluxed for 3 h, then the mixture was cooled to room temperature. The precipitate was filtered off, washed with anhydrous ethanol and dried in vacuum to give Hcy-mP as a red solid mixture (0.338 g, 85%). Mp = 226–227 °C. The structure of Hcy-mP was confirmed by 1H NMR, 13C NMR and HRMS (Fig. S7–S9†): 1H NMR (600 MHz, DMSO-d6): δ 1.60 (s, 6H, CH3), 6.43–6.45 (d, J = 8.3 Hz, 1H, Ar–H), 7.10–7.12 (d, J = 15.5 Hz, 1H, CH![[double bond, length as m-dash]](https://www.rsc.org/images/entities/char_e001.gif) CH), 7.26–7.29 (d, J = 8.3 Hz, 1H, Ar–H), 7.44–7.54 (d, J = 8.1 Hz, 1H, Ar–H), 7.72–7.73 (dd, J = 8.1 Hz, 1H, Ar–H), 7.86–7.88 (d, J = 9.1 Hz, 1H, Ar–H), 7.90 (s, 1H, Ar–H), 8.52–8.54 (d, J = 16.0 Hz, 1H, CH), 10.78 (s, 1H, OH), 11.07 (s, 1H, OH). 13C NMR (600 MHz, DMSO): δ 165.78, 162.49, 148.32, 147.98, 146.18, 142.14, 140.97, 138.09, 133.10, 128.53, 126.95, 125.97, 120.97, 114.52, 110.26, 107.29, 102.88, 52.27, 24.26, 21.25. HRMS (ESI-TOF) m/z calcd for C18H16NO5S−: 358.08; found ([M − H]−): 358.0753.
CH), 7.26–7.29 (d, J = 8.3 Hz, 1H, Ar–H), 7.44–7.54 (d, J = 8.1 Hz, 1H, Ar–H), 7.72–7.73 (dd, J = 8.1 Hz, 1H, Ar–H), 7.86–7.88 (d, J = 9.1 Hz, 1H, Ar–H), 7.90 (s, 1H, Ar–H), 8.52–8.54 (d, J = 16.0 Hz, 1H, CH), 10.78 (s, 1H, OH), 11.07 (s, 1H, OH). 13C NMR (600 MHz, DMSO): δ 165.78, 162.49, 148.32, 147.98, 146.18, 142.14, 140.97, 138.09, 133.10, 128.53, 126.95, 125.97, 120.97, 114.52, 110.26, 107.29, 102.88, 52.27, 24.26, 21.25. HRMS (ESI-TOF) m/z calcd for C18H16NO5S−: 358.08; found ([M − H]−): 358.0753.
General procedures for spectral determination
All spectroscopic experiments were carried out at room temperature in this paper.4-Hydroxyethylpiperazine ethyl sulfonic acid (HEPES) was acted as buffer solution. Different concentrations (1.00 mol L−1, 0.10 mol L−1, 0.01 mol L−1) of hydrochloric acid and sodium hydroxide were used to adjust the pH value of solution. The probe Hcy-mP (0.01 g) was dissolved in HEPES buffer solution (pH = 7.0) to get the stock solution (1 mM). Diluting the stock solution to make working solution (10 μM).
Calculation of association constants
Association constant (Ka) was calculated using the following equation.31| 1/(F − F0) = 1/{Ka(Fmax − F0)C} + 1/(Fmax − F0) | (1) |
Calculation of detection limit
The detection limit was calculated from the fluorescence titration data based on the equation 3σ/K.32 The σ is the standard deviation of blank experiment and K is slope of the calibration curve.Calculation of fluorescence quantum yield
The fluorescence quantum yield of Hcy-mP was determined according to the following equation.
 | (2) |
Application in water samples
The tap water were obtained from school. The drinking water were obtained from our laboratory. The lake water were collected from the Labor Lake in Qiqihar. Those water samples were used without purification after static placement for 12 h. Initially, Hcy-mP (10 μM) was added to all the water samples (5.0 mL) followed by the addition of different concentrations (1, 3, 5 μM) of Hg2+, respectively.Cytocompatibility assay
Cell viability was used as an indicator to evaluate the cytotoxicity of fluorescent dyes for cells. In reference to these pieces of literature,33–35 the MTT (3-(4,5-dimethylthiazol-2-yl)-2,5-diphenyltetrazolium bromide) text was used to assess the cytotoxicity of Hcy-mP to HeLa cells. The HeLa cells were cultured in a 96-well microplate with a density of 1.00 × 10⁵ cells per mL at 37 °C, 5% CO2. After 24 h, gently remove the medium and replace with different concentrations of Hcy-mP (10–100 μM) diluted in fresh medium, incubated at 37 °C for 4 h. Cells in a culture medium without Hcy-mP were used as the control. After washing the cells with PBS (pH = 7.4) for three times, 10 μL of MTT solution (10 mg mL−1, PBS) was added into each well of the 96-well microplate, incubate for another 4 h. Then, the remaining MTT solution was removed. After shaking the plates for 10 min, the absorbance of each well was recorded with a microplate reader at 393 nm. The cell viability rate (VR) was assessed by using the following equation:| % viability = [∑(Ai/Acontrol × 100)]/n | (3) |
Intracellular culture and imaging
HeLa cells were cultured in DMEM supplement with 10% fetal bovine serum (FBS), and cells were seeded in Petri dishes and incubated at 37 °C, 5% CO2 for 48 h.36–38 Then removed culture medium, and cells were washed with PBS (pH = 7.4) for three times.39–43 Hcy-mP (10 μM) was respectively dissolved in three different pH values in PBS buffers (pH = 7.4, 3.0, 11.0) and incubated with HeLa cells for 30 min at 37 °C. Then, cells were incubated with HgCl2 (10 μM) and finally incubated with EDTA (10 μM) for another 30 min. All cells were washed for 3 times with PBS before observation under microscope.44 Fluorescence images were acquired on a confocal laser scanning microscope.Conclusion
In summary, we designed and synthesized a highly selective and colorimetric, low cytotoxicity and water solubility probe (Hcy-mP) with a large Stokes shift (139 nm) using for detecting Hg2+ under 100% aqueous medium. The probe was used to detect Hg2+ via a turn off fluorescence, after addition of EDTA, the fluorescence recovered obviously. The detection limit of Hcy-mP with Hg2+ was reached as low as 1.08 μM. Moreover, Hcy-mP can be used to detect Hg2+ with satisfactory results in water samples. Application of Hcy-mP in living HeLa cells was successfully, indicating the probe has good cell membrane permeability and could be used to monitor intracellular pH fluctuations and detect Hg2+ in living cells.Conflicts of interest
There are no conflicts to declare.Acknowledgements
This work was supported by the Natural Science Foundation of China (21506106), the Natural Science Foundation of Heilongjiang Province (LC2017004, LH2019B021). We also thanks the Gene Line Bioscience company provides cell imaging services for us.References
- S. Koenig, M. Sole, C. Fernandez-Gomez and S. Diez, Sci. Total Environ., 2013, 442, 329–336 CrossRef CAS PubMed.
- L. X. Yan, Z. P. Chen, Z. Y. Zhang, C. L. Qu, L. X. Chen and D. Z. Shen, Analyst, 2013, 26, 4656–4660 Search PubMed.
- A. Renzoni, F. Zino and E. Franchi, Environ. Res., 1998, 77, 68–72 CrossRef CAS PubMed.
- C. Y. Li, F. Xu, Y. F. Li, K. Zhou and Y. Zhou, Anal. Chim. Acta, 2012, 717, 122–126 CrossRef CAS PubMed.
- J. Isaad and A. E. Achari, Analyst, 2013, 13, 83809–83819 Search PubMed.
- T. Takeuchi, N. Morikawa, H. Matsumoto and Y. Shiraishi, Acta Neuropathol., 1962, 2, 40–57 CrossRef.
- H. Matsumoto, G. Koya and T. Takeuchi, Exp. Neurol., 1965, 24, 563–574 CAS.
- P. W. Davidson, G. J. Myers, C. Cox, C. F. Shamlaye, D. O. Marsh, M. A. Tanner, M. Berlin, J. Sloane-Reeves, E. Cernichiari, O. Choisy, A. Choi and T. W. Clarkson, NeuroToxicology, 1995, 16, 677–688 CAS.
- M. Razmiafshari, J. Kao, A. d'Avignon and N. H. Zawia, Toxicol. Appl. Pharmacol., 2001, 172, 1–10 CrossRef CAS PubMed.
- D. W. Boening, Chemosphere, 2000, 40, 1335–1351 CrossRef CAS PubMed.
- H. N. Kim, W. X. Ren, J. S. Kim and J. Yoon, Chem. Soc. Rev., 2012, 41, 3210–3244 RSC.
- M. Formica, V. Fusi, L. Giorgi and M. Micheloni, Coord. Chem. Rev., 2012, 256, 170–192 CrossRef CAS.
- Q. Lin, T. T. Lu, X. Zhu, T. B. Wei, H. Li and Y. M. Zhang, Chem. Sci., 2016, 7, 5341–5346 RSC.
- D. Li, C. Y. Li, Y. F. Li, Z. Li and F. Xu, Anal. Chim. Acta, 2016, 934, 218–225 CrossRef CAS PubMed.
- Q. Lin, X. L. Lin, T. B. Wei and Y. M. Zhang, Chem.–Asian J., 2013, 8, 3015–3021 CrossRef CAS PubMed.
- Q. X. Duan, X. Y. Lv, C. Y. Liu, Z. F. Geng, F. F. Zhang, W. L. Sheng, Z. K. Wang, P. Jia, Z. L. Li, H. C. Zhu and B. C. Zhu, Ind. Eng. Chem. Res., 2019, 58, 11–17 CrossRef CAS.
- Q. X. Duan, H. C. Zhu, C. Y. Liu, R. F. Yuan, Z. T. Fang, Z. K. Wang, P. Jia, Z. L. Li, W. L. Sheng and B. C. Zhu, Analyst, 2019, 144, 1426–1432 RSC.
- V. K. Gupta, A. K. Jain, G. Maheshwari and Z. H. Lang, Sens. Actuators, B, 2006, 117, 99–106 CrossRef CAS.
- R. Joseph, B. Ramanujam, A. Acharya and C. P. Rao, Tetrahedron Lett., 2009, 50, 2735–2739 CrossRef CAS.
- M. H. Yang, P. Thirupathi and K. H. Lee, Org. Lett., 2011, 13, 5028e31 Search PubMed.
- J. S. Wu, I. C. H Wang, K. S. Kim and J. S. Kim, Org. Lett., 2007, 9, 907–910 CrossRef CAS PubMed.
- J. Wang, X. Qian and J. Cui, J. Org. Chem., 2006, 71, 4308–4311 CrossRef CAS PubMed.
- Y. Zhao, X. Lv, Y. Liu, J. Liu, Y. Zhang and H. Shi, J. Mater. Chem., 2012, 22, 11475e8 Search PubMed.
- E. M. Nolan and S. J. Lippard, J. Am. Chem. Soc., 2007, 129, 5910–5918 CrossRef CAS PubMed.
- R. Guo, J. l. Yin, Y. Y. Ma, G. H Li, Q. Wang and W. Y. Lin, Sens. Actuators, B, 2018, 271, 321–328 CrossRef CAS.
- F. L. Song, X. J. Peng, E. H. Lu, R. Zhang, X. Y. Chen and B. Song, J. Photochem. Photobiol., A, 2014, 168, 53–57 CrossRef.
- L. Ma, Y. Li, L. Li, J. Sun, C. Tian and Y. Wu, Chem. Commun., 2008, 77, 6345–6347 RSC.
- B. Rathinam, C. C. Chien, B. C. Chen and J. H. Liu, Tetrahedron, 2013, 69, 235–241 CrossRef CAS.
- M. H. Yang, P. Thirupathi and K. H. Lee, Org. Lett., 2011, 13, 5028–5031 CrossRef CAS PubMed.
- B. Song, Q. Zhang and X. J. Peng, J. Chem., 2008, 5, 932–935 Search PubMed.
- Y. Kubo, M. Kato, . Misawa and W. Tokita, Tetrahedron Lett., 2004, 45, 3769–3773 CrossRef CAS.
- H. Yang, Z. Zhou, K. Huang, M. Yu, F. Li and T. Yi, Org. Lett., 2007, 9, 4729–4732 CrossRef CAS PubMed.
- W. F. Niu, Z. W. Wei, J. Jia, S. M. Shuang, C. Dong and K. M. Yun, Dyes Pigm., 2018, 152, 155–160 CrossRef CAS.
- T. Gong, R. Li, Y. Y. Yuan, B. F. Yu, H. Zhao, Z. Z Liu, R. Guo, D. Su, W. T. Liang and C. Dong, New J. Chem., 2018, 42, 12954–12959 RSC.
- R. Guo, J. Yin, Y. Ma, Q. A. Wang and W. Lin, J. Mater. Chem. B, 2018, 6, 2894–2900 RSC.
- W. Feng, M. Li, Y. Sun and G. Feng, Anal. Chem., 2017, 89, 6106–6112 CrossRef CAS PubMed.
- Q. Xia, S. Feng, D. Liu and G. Feng, Sens. Actuators, B, 2018, 258, 8–104 Search PubMed.
- B. Huang, W. Chen and Y. Q. Kuang, Org. Biomol. Chem., 2017, 15, 4383–4389 RSC.
- D. Xu, Y. H. Li, C. Y. Poon, H. N Chan, H. W. Li and M. S. Wong, Anal. Chem., 2018, 90, 8800–8806 CrossRef CAS PubMed.
- S. V. Mulay, M. Choi, Y. J. Jang, Y. Kim, S. Jon and D. G. Churchill, Chem.–Eur. J., 2016, 22, 9642–9964 CrossRef CAS PubMed.
- J. B. Chao, K. L. Song, Y. B. Zhang, C. X. Yin, F. J. Huo, J. J. Wang and T. Zhang, Talanta, 2018, 189, 150–156 CrossRef CAS PubMed.
- W. Niu, L. Fan, M. Nan, M. S. Won, S. Shuang and C. Dong, Sens. Actuators, B, 2016, 234, 534–540 CrossRef CAS.
- F. Meng, Y. Liu, J. Niu and W. Lin, Tetrahedron Lett., 2017, 58, 3287–3293 CrossRef CAS.
- Z. X. Tong, W. Liu, H. Huang, H.-Z. Chen, X.-J. Liu, Y.-Q. Kuang and J.-H. Jiang, Analyst, 2017, 142, 3906–3912 RSC.
Footnotes |
| † Electronic supplementary information (ESI) available. See DOI: 10.1039/c9ra03924d |
| ‡ These authors contributed equally to this work. |
| This journal is © The Royal Society of Chemistry 2019 |

