 Open Access Article
Introducing hydrophilic ultra-thin ZIF-L into mixed matrix membranes for CO2/CH4 separation
Weifang Zhu,
Xueqin Li,
Yanyong Sun,
Ruili Guo * and
Siyuan Ding
School of Chemistry and Chemical Engineering, Key Laboratory for Green Process of Chemical Engineering of Xinjiang Bingtuan, Shihezi University, Xinjiang, Shihezi 832003, China. E-mail: grli@shzu.edu.cn; Fax: +86 993 2057210; Tel: +86 993 2057277
First published on 29th July 2019
Abstract
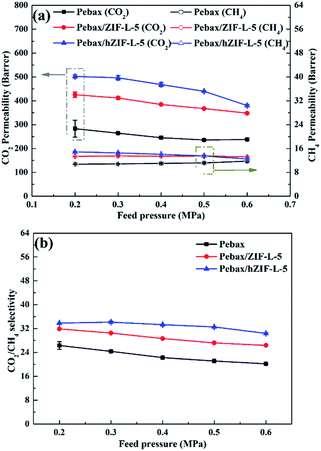
Mixed matrix membranes (MMMs) were developed by mixing hydrophilically modified two-dimensional (2D) imidazole framework (named as hZIF-L) flakes into a Pebax MH 1657 (Pebax) matrix, and designed to separate carbon dioxide/methane (CO2/CH4) mixtures. The hZIF-L flakes were important for increasing the effectiveness of the MMMs. First, the tannic acid (TA) etched hZIF-L flakes have a large number of microporous (1.8 nm) and two-dimensional anisotropic transport channels, which offered convenient gas transport channels and improved the permeability of CO2. Second, the TA molecules provide the surface of the ZIF-L flakes with more hydrophilic functional groups such as carbonyl groups (C![[double bond, length as m-dash]](https://www.rsc.org/images/entities/char_e001.gif) O) and hydroxyl groups (–OH), which could effectively prevent non-selective interfacial voids and filler agglomeration in the Pebax matrix, and also presented strong binding ability to water and CO2 molecules. The satisfactory interface compatibility and affinity with the CO2 molecule promoted its permeability, solubility, and selectivity. As a result, the MMMs exhibited the highest performance of gas separation with the hZIF-L flake weight content of 5%, at which the CO2 permeability and CO2/CH4 selectivity were 502.44 barrer and 33.82 at 0.2 MPa and 25 °C, respectively.
O) and hydroxyl groups (–OH), which could effectively prevent non-selective interfacial voids and filler agglomeration in the Pebax matrix, and also presented strong binding ability to water and CO2 molecules. The satisfactory interface compatibility and affinity with the CO2 molecule promoted its permeability, solubility, and selectivity. As a result, the MMMs exhibited the highest performance of gas separation with the hZIF-L flake weight content of 5%, at which the CO2 permeability and CO2/CH4 selectivity were 502.44 barrer and 33.82 at 0.2 MPa and 25 °C, respectively.
1. Introduction
Gas membrane separation technology has been acknowledged as a suitable method for CO2 separation because of its low cost, small footprint requirement and simple operation.1 However, there is an inverse relationship between the permeability and selectivity of a polymer-based membrane, where an increase in permeability is accompanied by a reduction in selectivity.2–4 There are ways to improve the efficiency of the separations of polymer based membranes to overcome this trade-off effect. The current methods are new polymer design,5,6 polymer blending7 and particle filling.8–10 Among them, the introduction of inorganic fillers into polymers to generate MMMs has attracted significant interest from researchers, as the method is simple and effective.The choice of inorganic fillers is an important factor in determining the separation performance of MMMs. A large amount of research has been devoted to the development and preparation of new inorganic fillers. Among them, the incorporation of two-dimensional (2D) materials11–22 into a polymer matrix to obtain MMMs has been the focus of research recently. Huang et al.23 prepared Pebax/GO-0.05 MMMs and the CO2 permeability and CO2/N2 selectivity were 113 barrer and 72, respectively. Compared to pure Pebax membrane, the CO2 permeability and CO2/N2 selectivity increased by 22.8% and 71.4%, respectively. Zhao et al.24 prepared Pebax/GO MMMs and the permeability of CO2 gas was reduced by 70% compared to pure Pebax membrane at a GO content of 3.85 vol%. Liu et al.19 prepared a Pebax-MoS2 MMM for CO2/N2 separation by incorporating molybdenum disulfide (MoS2) nanosheets into the Pebax matrix. The experimental results showed that the MMM with 4.67 wt% MoS2 showed good separation performance. Compared to the pure Pebax membrane, the CO2 permeability and CO2/N2 selectivity increased by 46.26% and 101.62%, respectively. It could be concluded from the above research results that the high aspect ratio of the 2D materials formed highly tortuous diffusion paths for gas molecules in the polymer matrix, which increased the diffusion rate difference between large molecules and small molecules and finally improved the selectivity of the MMMs for gas mixtures. However, the permeability of the MMMs did not improve significantly. Recently, zeolitic imidazolate framework-L (ZIF-L), a new type of 2D porous MOF material, has gained extensive attention because of its specific pore size (0.34 nm) and strong CO2 adsorption capacity.25 The 2D network structure of ZIF-L was further stabilized by the interaction of the Hmim ‘terminal’ ligand (TL) with Hmim ‘free’ ligand (FL), but this van der Waals force interaction was weak.26,27 After sonication, ZIF-L was easily stripped into ultra-thin flakes with a high aspect ratio > 300. In addition, ZIF-L has a 9.4 Å × 7.0 Å × 5.3 Å cushion-shaped cavity between the layers, which is suitable for accommodating CO2 molecules.25 Meanwhile, the imidazole group on ZIF-L flakes can form a strong interaction with the CO2 molecule.28 In summary, we believed that ZIF-L was suitable for gas separation. However, there was a problem that ZIF-L's hydrophobicity and poor compatibility with the Pebax matrix needed to be improved.
TA has a strong bonding ability with metal ions and is often used as a hydrophilic surface modifier for a few materials and as an etchant for MOFs.29–31 Hu et al.29 developed a simple strategy and found that phenolic acid was a unique etchant. It was possible to create voids inside the MOF while performing surface modification. They etched ZIF-8, MIL-68, and ZIF-67 with phenolic acid (i.e., gallic acid (GA) or TA). The results showed that these materials not only retained the original morphological structure but also formed a mesoporous structure after etching. Therefore, the surface functionalized auxiliary etching method could be applied to hydrophilic surface modification and making changes in the structure of ZIF-L flakes.
In this study, the functionalized auxiliary etching of ZIF-L flakes by TA was performed, and it is believed that using TA as an etchant will increase the pore size of the ZIF-L flakes. In addition, the functional modification of the surface of the ZIF-L flakes could effectively improve the issue of its hydrophobicity. The synthetic ZIF-L filler, as well as the functional modification of ZIF-L flakes by TA, and the MMMs were characterized by TEM, XRD, FT-IR spectroscopy and other analytical techniques. The effects of different fillers, contents, feed pressure and operating temperature on the performance of gas separation of the MMMs were determined.
2. Experimental
2.1. Materials
98% zinc nitrate hexahydrate (H12N20O12Zn) was obtained from Alfa Aesar Chemical Co., Ltd (Shanghai, China). 2-Methylimidazole (Hmim) was obtained from Adamas Reagent Co., Ltd (Shanghai, China). Ethyl alcohol was obtained from Tianjin Fuyu Fine Chemical Co., Ltd (Tianjin, China). Pebax 1657 was obtained from Shanghai Rongtian Chemical Co., Ltd (Shanghai, China). Deionized water (DI) was prepared in our laboratory and used in every case. The reagents were used as received.2.2. Synthesis of hZIF-L flakes
The ZIF-L flakes were prepared by previously reported methods.25 Specifically, an aqueous zinc nitrate solution (0.59 g, 40 mL) was added to an aqueous solution of Hmim (1.30 g, 40 mL) with stirring. After 4 h of stirring at room temperature, the product was concentrated by centrifuging several times, washed thrice with water, and dried at 70 °C overnight in an oven. The obtained ZIF-L flakes were added to a TA solution (3 mg mL−1) and stirred for 5 min, and then allowed to stand for 7 min. The modified ZIF-L flakes were collected by centrifugation and washed 3 times with water. As the final step, the collected product was freeze dried and kept in a desiccator. The modified ZIF-L flakes are referred to as hZIF-L flakes.2.3. Membrane fabrication
All membranes were obtained by a solution-casting method (Fig. 1).32–34 The Pebax/ZIF-L-X and Pebax/hZIF-L-X membranes were prepared with different loadings (1, 3, 5, 7 and 9 wt%) of ZIF-L flakes and hZIF-L flakes, respectively. First, a specific amount of filler was dispersed using sonication into a small amount of ethyl alcohol solution to obtain a uniform suspension. At the same time, a given mass of Pebax 1657 was dissolved in a solution mixture (ethyl alcohol to water ratio of 70 wt% to 30 wt%) under reflux stirring for 2 h to obtain a polymer solution. Subsequently, the solution with uniform filler was added to the Pebax 1657 solution at 25 °C and stirred for 3 h. The final mixtures with different loadings of filler were cast on an ultra-flat glass plate and then dried at 25 °C for 24 h. To eliminate the remaining solvent, the plates were vacuum-dried at 40 °C for 24 h. Pure Pebax membrane was prepared in the same manner.2.4. Characterization of filler and membrane
The morphologies of the ZIF-L flakes, pure Pebax membrane, and Pebax/hZIF-L membranes were determined by using scanning electron microscopy (SEM, SU8010). The leaf-like shape of ZIF-L flakes was observed using atomic force microscopy (AFM, Bruker). The structures of the ZIF-L flakes and hZIF-L flakes were also observed using transmission electron microscopy (TEM) on a Tecnai G2 F20 S-TWIN. The chemical structures of the ZIF-L flakes, hZIF-L flakes and membranes were characterized using Fourier-transform infrared (FT-IR) spectroscopy on a Nicolet AVATAR 360 in the range between 400 cm−1 and 4000 cm−1. The surface area and pore characteristics of the hZIF-L flakes were calculated based on the standard adsorption parameters using the Barrett–Joyner–Halenda (BJH) algorithm and the Brunauer–Emmett–Teller theory (BET, ASAP 2020 C). The crystalline properties of the ZIF-L flakes, hZIF-L flakes and membranes were measured by using X-ray diffraction (XRD, Bruker D8). The registered 2θ interval was 10° to 90° using CuKα as the source of radiation. The glass transition temperature (Tg) was determined by using differential scanning calorimetry (DSC, 200, F3) from −60 °C to 250 °C with a scanning rate of 10 °C min−1 in a N2 atmosphere. The thermal stability of the ZIF-L flakes, hZIF-L flakes, and the membranes was examined by using thermogravimetric analysis (TGA, STA449F3) under a N2 atmosphere, using the range of 0–800 °C, with a heating rate of 10 °C min−1. The optical contact angle was determined with the sessile drop method using a Krüss Easy Drop Goniometer.2.5. Gas permeation tests
Gas permeation tests were performed under dry or humid conditions using a (constant pressure)/(variable volume method) at 25 °C.35,36 In the humidified permeation experiment, the sweep gas was pure hydrogen (H2) and the feed gas was the mixed-gas. The mixed-gas was saturated with water vapor at 40 °C and then the excess moisture was condensed at room temperature in a dehumidifier. Then, the mixed-gas was driven into the membrane cell. Also, H2 was humidified by being transited through a humidifier bottle at 25 °C. The composition of gases after permeation was measured using gas chromatography (GC, Agilent Technologies 7820A GC System).The gas permeability (Pi, barrer, and 1 barrer = 10−10 cm3 (STP) cm cm−2 s−1 cmHg−1) could be obtained by the following eqn (1):
 | (1) |
The mixed-gas separation factor (αij) was estimated by (2):
 | (2) |
3. Results and discussion
3.1. Characterization of hZIF-L flakes
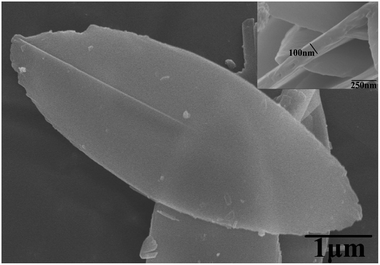
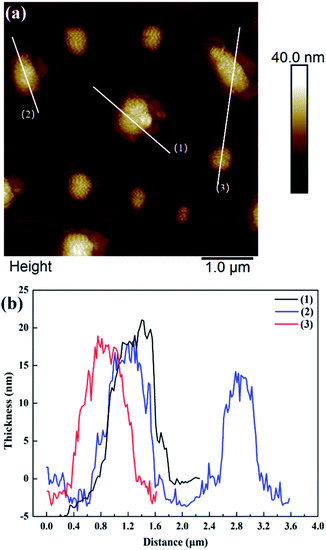
Fig. 2 shows that the ZIF-L flakes exhibited leaf-like shapes with sizes of about 5.9 μm × 2.4 μm and thicknesses of about 100 nm. After ultrasonication, the thickness of ZIF-L and hZIF-L flakes decreased to about 18 nm and 20 nm, respectively, but still kept the same leaf-like morphology (Fig. 3 and 4). Hence, the ultrathin layer of ZIF-L and hZIF-L flakes was used in the follow-up experiment.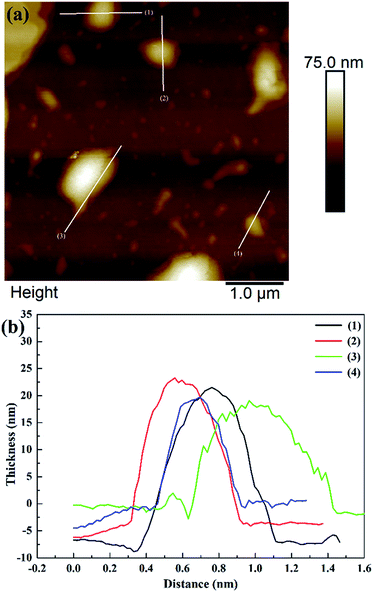 | ||
| Fig. 4 AFM image of hZIF-L flakes. (a) AFM image of hZIF-L flakes. (b) Thickness results around each white line. | ||
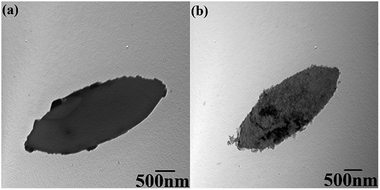
The sizes and morphologies of ZIF-L and hZIF-L flakes were characterized by using TEM, as shown in Fig. 5. A smooth surface of the ZIF-L flakes could be seen, which agrees with the previous reports.25,37,38 The hZIF-L flakes retained the leaf-like morphology, but the surface of the hZIF-L flakes became rough as the TA etched the ZIF-L.
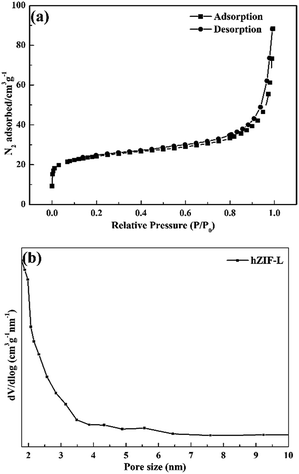
Fig. 6(a) shows that the adsorption isotherms of hZIF-L flakes belong to type I. The pore distribution shown in Fig. 6(b) indicated that fewer mesopores and many microporous structures exist in the hZIF-L flakes, with sizes of 5.6 nm and 1.8 nm, respectively. The surface and pore properties of the hZIF-L flakes were as follows: a specific surface area of 87.98 m2 g−1; a pore diameter of 3.28 nm; and a pore volume of 0.07 cm3 g−1. The pore size of ZIF-L flakes reported in the literature was 0.34 nm.28
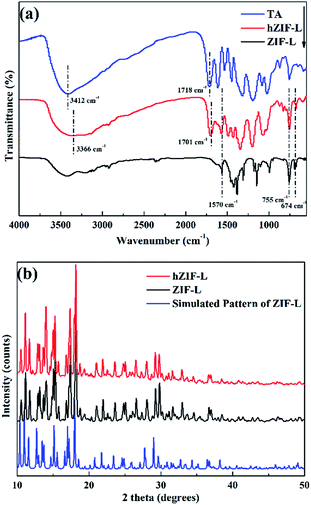
The FT-IR spectra of the ZIF-L flakes and hZIF-L flakes are shown in Fig. 7(a). Peaks were assigned as follows: 1570 cm−1, C![[double bond, length as m-dash]](https://www.rsc.org/images/entities/char_e001.gif) N stretching; 755 cm−1, Zn–O imidazole ring bending; 674 cm−1, Zn–N imidazole ring bending. In the TA spectrum, peaks appeared at 1718 cm−1 (C
N stretching; 755 cm−1, Zn–O imidazole ring bending; 674 cm−1, Zn–N imidazole ring bending. In the TA spectrum, peaks appeared at 1718 cm−1 (C![[double bond, length as m-dash]](https://www.rsc.org/images/entities/char_e001.gif) O stretching) and 3412 cm−1 (–OH stretching). The characteristic peaks of ZIF-L flakes and TA also appeared in the spectrum of hZIF-L flakes. Compared to the pure TA, the peaks of hZIF-L flakes at 3412 cm−1 and 1718 cm−1 shifted to lower wavenumbers, i.e., 3366 cm−1 and 1701 cm−1, respectively. These shifts may have been caused by the chelation of the carbonyl (C
O stretching) and 3412 cm−1 (–OH stretching). The characteristic peaks of ZIF-L flakes and TA also appeared in the spectrum of hZIF-L flakes. Compared to the pure TA, the peaks of hZIF-L flakes at 3412 cm−1 and 1718 cm−1 shifted to lower wavenumbers, i.e., 3366 cm−1 and 1701 cm−1, respectively. These shifts may have been caused by the chelation of the carbonyl (C![[double bond, length as m-dash]](https://www.rsc.org/images/entities/char_e001.gif) O) groups of TA with Zn2+ on the surface of the ZIF-L flakes. The polar groups on the surface of the hZIF-L flakes promoted compatibility with the polymer matrix, which also enhanced the solubility of CO2 molecules.
O) groups of TA with Zn2+ on the surface of the ZIF-L flakes. The polar groups on the surface of the hZIF-L flakes promoted compatibility with the polymer matrix, which also enhanced the solubility of CO2 molecules.
The XRD patterns of ZIF-L and hZIF-L flakes are shown in Fig. 7(b). It could be seen from the XRD pattern that the characteristic peaks of ZIF-L and hZIF-L flakes were consistent with the characteristic peaks of the simulated ZIF-L flakes,39,40 and the patterns also confirmed the formation of ZIF-L and hZIF-L flakes with high crystallinity.
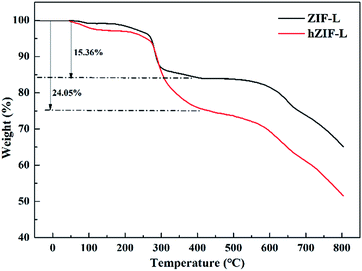
Thermogravimetric analyses of ZIF-L and hZIF-L flakes were undertaken, and the results are shown in Fig. 8. The ZIF-L and hZIF-L flakes exhibited about a 3 wt% weight loss before 270 °C, which indicates the removal of residual solvent from the flakes. The sharp weight loss occurring between 200 and 450 °C indicates the removal of weakly linked Hmim in the hZIF-L flakes. The weight loss (24.05 wt%) of hZIF-L flakes was much higher than that of ZIF-L flakes, which may be caused by the degradation of TA molecules on the surface of hZIF-L flakes.
3.2. Characterization of Pebax/hZIF-L membranes
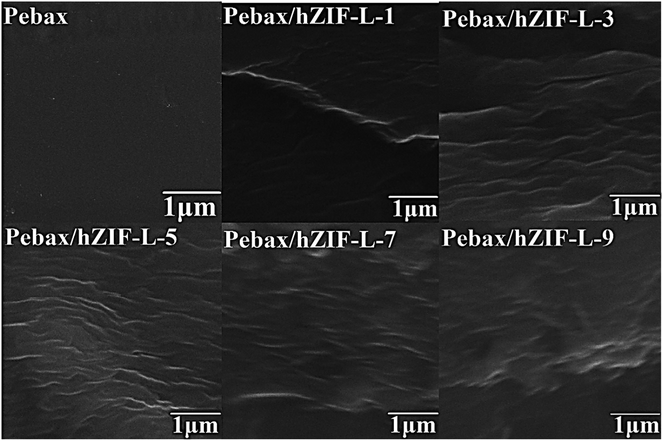
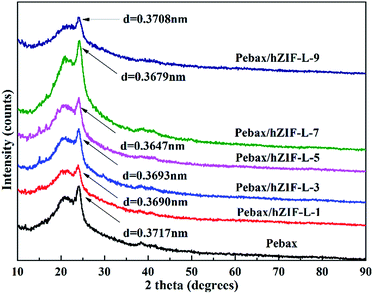
SEM was used to study the cross-section of the pure Pebax membrane. It was observed to be even and uniform (Fig. 9). In contrast, the cross section of the Pebax/hZIF-L membranes presents a uniform horizontal strip. The hZIF-L flakes form a homogeneous dispersion in the Pebax matrix when the loading is below 5 wt%. This phenomenon indicates that a high aspect ratio of hZIF-L flakes could be easily arranged horizontally in the Pebax matrix, which showed good compatibility with Pebax. However, when the content of filler exceeded 5 wt%, the hZIF-L flakes showed an apparent agglomeration and were no longer present in a parallel arrangement.The orientation of hZIF-L flakes in the Pebax matrix and the intervention effect of hZIF-L flakes on the Pebax chain crystallization region were investigated by using XRD. In Fig. 10, a broad and strong peak at 2θ = 24.1° can be observed, which may originate from the crystalline structures of the polyamide (PA6) segment of the Pebax matrix. The Pebax/hZIF-L membranes showed a lower d-spacing than that of the pure Pebax membrane, which indicates that the introduction of hZIF-L flakes limited the mobility of the Pebax chain and could improve the selectivity for gas mixtures.
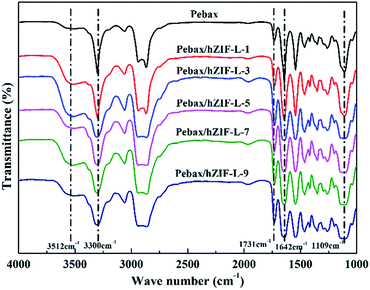
The chemical structures of the pure Pebax membranes and MMMs were characterized by using FT-IR spectroscopy. As can be seen in Fig. 11, the MMMs have the same characteristic peak as the pure Pebax membrane except for the broad peak at 3512 cm−1. This peak was assigned to the –OH stretching vibration of the hZIF-L flakes, which indicated that the hydrophilic groups of TA were successfully introduced into the MMMs.
Changes in the glass-transition temperature (Tg) are often used for estimating the interfacial interaction of polymer-filler in MMMs. An increase in Tg indicates good interfacial interaction between the polymer matrix and filler and also suggests that the polymer chains have restricted mobility. The rigidification of polymer chains is conducive to an increase in selectivity.41 DSC was used to find the Tg of the Pebax and Pebax/hZIF-L membranes. The curves are shown in Fig. 12. The Pebax and Pebax/hZIF-L membranes present similar endothermic peaks at 18.7 and 206.3 °C, which correspond to the melting of the poly[ethylene oxide] (PEO) block and PA6 block in the Pebax matrix, respectively. Fig. 12(b) shows that the Pebax/hZIF-L membranes all have higher Tg values than the pure Pebax membrane, which indicates good interface compatibility between Pebax polymer and hZIF-L flakes. For filler contents higher than 5 wt%, the Tg of the MMMs showed a downward trend due to the agglomeration of hZIF-L flakes in the membrane matrix.42 These results agree with the SEM observations of the MMMs (Fig. 9).
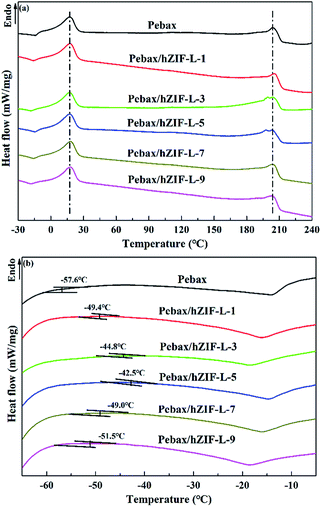 | ||
| Fig. 12 DSC curves of membranes with different contents of filler: (a) high temperature region and (b) low temperature region. | ||
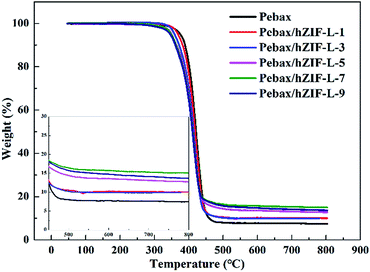
The thermal stability results of the pure Pebax and Pebax/hZIF-L membranes with different contents of filler are shown in Fig. 13. They indicated that the membranes lose weight in a two-stage process. The first stage was due to the evaporation of the solvent (50–320 °C). The second stage was the degradation of the main chains of Pebax (320–460 °C). It could be seen that the membranes doped with hZIF-L flakes had better thermal stability than the Pebax membrane. There was good interaction at the interface between the Pebax matrix and hZIF-L flakes, where the polymer chains exhibited partial chain rigidity, so a higher temperature was needed to break down the polymer chains, resulting in increasing the thermal stability.
3.3. Performance of membrane separation
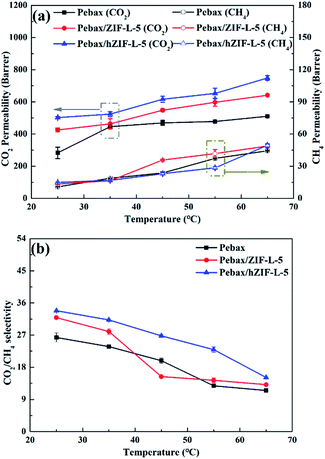
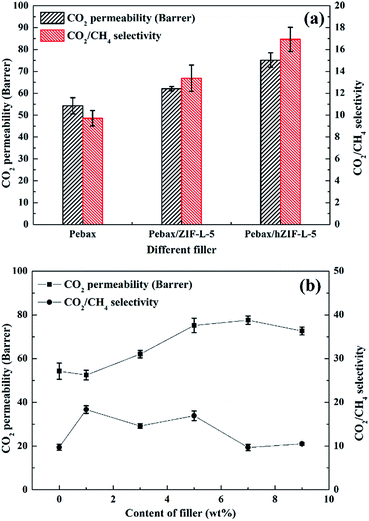 | ||
| Fig. 14 Pure gas separation performance of Pebax/hZIF-L membranes: (a) different fillers and (b) different contents of filler. | ||
The solubility and diffusion coefficients (S and D, respectively) of CO2 and CH4, and the selectivity for solubility and diffusion of the mixture, are shown in Table 1. Upon an increase in the filler content, the diffusion coefficient of CO2 molecules increased at first and then decreased, and the diffusion coefficient of the CH4 molecule increased. This trend could be mainly due to the pore structure of the hZIF-L flakes, which promotes the diffusion of both molecules; but as the content increased, TA introduces more and more functional groups and the number of sites of action with CO2 increases, which limits the diffusion of CO2 molecules. Therefore, the diffusion selectivity of MMMs has an inverse relationship with the filler content. The solubility coefficient of CO2 molecules increased, and the solubility coefficient of CH4 molecules generally remains the same with an increase in the content of hZIF-L flakes. These results could be attributed to an increase in the content of pro-CO2 sites on the hZIF-L flakes, increasing the solubility selectivity of the MMMs. Comprehensively, the highest gas separation performance was achieved at 5 wt% loading of hZIF-L flakes in the polymer matrix with a CO2 permeability of 75.17 barrer and CO2/CH4 selectivity of 16.93.
| Membrane | DCO2 | DCH4 | SCO2 | SCH4 | DCO2/DCH4 | SCO2/SCH4 |
|---|---|---|---|---|---|---|
| a D: diffusion coefficients, ×10−7 cm2 s−1; S: solubility coefficients, ×10−2 cm3 (STP) cm−3 cmHg−1. | ||||||
| Pebax | 3.95 | 5.08 | 1.37 | 0.11 | 0.78 | 12.45 |
| Pebax/hZIF-L-1 | 1.69 | 1.43 | 3.11 | 0.20 | 1.18 | 15.55 |
| Pebax/hZIF-L-3 | 2.09 | 2.25 | 2.98 | 0.19 | 0.93 | 15.68 |
| Pebax/hZIF-L-5 | 2.02 | 2.23 | 3.72 | 0.20 | 0.91 | 18.60 |
| Pebax/hZIF-L-7 | 1.96 | 3.53 | 3.97 | 0.23 | 0.56 | 17.26 |
| Pebax/hZIF-L-9 | 1.90 | 3.47 | 3.82 | 0.20 | 0.55 | 19.10 |
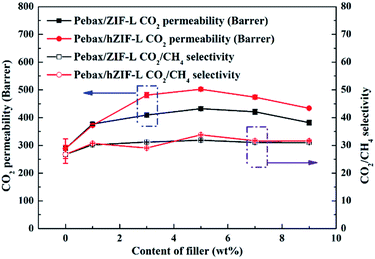 | ||
| Fig. 15 Effect of the content of fillers on the mixed-gas separation performance of Pebax/hZIF-L membranes with different contents of filler. | ||
| Membrane | Pebax | Pebax/ZIF-L-5 | Pebax/hZIF-L-5 |
|---|---|---|---|
| Contact angle (°) | 75.94 | 73.85 | 70.49 |
4. Conclusions
In this investigation, ultra-thin ZIF-L flakes were successfully prepared by an ultrasonication method, and then the functionalized auxiliary etching of the ZIF-L surface was carried out using TA to form hZIF-L flakes. The TA etching of ZIF-L flakes not only enlarged the surface pores but also incorporated hydrophilic groups on the surface of the ZIF-L flakes. The hydrophilic groups had strong binding affinities for water and CO2 molecules, which improved the solubility, selectivity, and permeability of CO2. Also, the hZIF-L flakes showed good interfacial affinity with the polymer matrix. The mixed-gas test results at 0.2 MPa and 25 °C gave a CO2 permeability of 502.44 barrer and a CO2/CH4 selectivity of 33.82. Compared with the pure Pebax membrane, the CO2 permeability increased by 74.4%, and the CO2/CH4 selectivity increased by 5.02% for Pebax/hZIF-L-5. The primary contribution of this work is that it provides a viable strategy for the application of hydrophobic ZIF-L materials in CO2/CH4 gas separation.Conflicts of interest
There are no conflicts to declare.Acknowledgements
The authors gratefully acknowledge the support from the National High Technology Research and Development Program of China (2012AA03A611) and the Program for Changjiang Scholars and Innovative Research Team in University (No. IRT-15R46).References
- W. Zhu, Y. Qin, Z. Wang, J. Zhang, R. Guo and X. Li, J. Energy Chem., 2019, 31, 1–10 CrossRef.
- N. Du, H. B. Park, M. M. Dal-Cin and M. D. Guiver, Energy Environ. Sci., 2012, 5, 7306–7322 RSC.
- L. M. Robeson, J. Membr. Sci., 2008, 320, 390–400 CrossRef CAS.
- K. Yang, Y. Dai, W. Zheng, X. Ruan, H. Li and G. He, Sep. Purif. Technol., 2019, 214, 87–94 CrossRef CAS.
- X. Fu, X. Li, R. Guo, J. Zhang and X. Cao, High Perform. Polym., 2018, 30, 1064–1074 CrossRef CAS.
- D. Wu, C. Yi, Y. Wang, S. Qi and B. Yang, J. Membr. Sci., 2018, 551, 191–203 CrossRef CAS.
- P. Salehian, F. Wai and T. Chung, J. Membr. Sci., 2016, 518, 110–119 CrossRef CAS.
- N. Zhang, D. Peng, H. Wu, Y. Ren, L. Yang, X. Wu, Y. Wu, Z. Qu, Z. Jiang and X. Cao, J. Membr. Sci., 2018, 549, 670–679 CrossRef CAS.
- R. Xu, Z. Wang, M. Wang, Z. Qiao and J. Wang, J. Membr. Sci., 2019, 573, 455–464 CrossRef CAS.
- X. Li, L. Ma, H. Zhang, S. Wang, Z. Jiang, R. Guo, H. Wu, X. Cao, J. Yang and B. Wang, J. Membr. Sci., 2015, 479, 1–10 CrossRef CAS.
- L. Dong, M. Chen, J. Li, D. Shi, W. Dong, X. Li and Y. Bai, J. Membr. Sci., 2016, 520, 801–811 CrossRef CAS.
- J. Zhang, Q. Xin, X. Li, M. Yun, R. Xu, S. Wang, Y. Li, L. Lin, X. Ding, H. Ye and Y. Zhang, J. Membr. Sci., 2019, 570–571, 343–354 CrossRef CAS.
- J. E. Shin, S. K. Lee, Y. H. Cho and H. B. Park, J. Membr. Sci., 2019, 572, 300–308 CrossRef CAS.
- X. Li, Y. Cheng, H. Zhang, S. Wang, Z. Jiang, R. Guo and H. Wu, ACS Appl. Mater. Interfaces, 2015, 7, 5528–5537 CrossRef CAS PubMed.
- S. Quan, S. Li, Y. Xiao and L. Shao, Int. J. Greenhouse Gas Control, 2017, 56, 22–29 CrossRef CAS.
- J. Hou, X. Li, R. Guo, Z. Wang and J. Zhang, Nanotechnology, 2018, 29, 125706 CrossRef PubMed.
- B. P. Biswal, H. D. Chaudhari, R. Banerjee and U. K. Kharul, Chem.–Eur. J., 2016, 22, 4695–4699 CrossRef CAS PubMed.
- Z. Kang, Y. Peng, Y. Qian, D. Yuan, M. A. Addicoat, T. Heine, Z. Hu, L. Tee, Z. Guo and D. Zhao, Chem. Mater., 2016, 28, 1277–1285 CrossRef CAS.
- Y. Liu, C. Chen, G. Lin, C. Chen, K. C. Wu, C. Lin and K. Tung, J. Membr. Sci., 2019, 582, 358–366 CrossRef CAS.
- M. Zhao, Q. Lu, Q. Ma and H. Zhang, Small Methods, 2017, 1, 1600030 CrossRef.
- T. Rodenas, I. Luz, G. Prieto, B. Seoane, H. Miro, A. Corma, F. Kapteijn, F. X. L. Xamena and J. Gascon, Nat. Mater., 2015, 14, 48–55 CrossRef CAS PubMed.
- Y. Cheng, X. Wang, C. Jia, Y. Wang, L. Zhai, Q. Wang and D. Zhao, J. Membr. Sci., 2017, 539, 213–223 CrossRef CAS.
- G. Huang, A. P. Isfahani, A. Muchtar, K. Sakurai, B. B. Shrestha, D. Qin, D. Yamaguchi, E. Sivaniah and B. Ghalei, J. Membr. Sci., 2018, 565, 370–379 CrossRef CAS.
- D. Zhao, J. Ren, Y. Qiu, H. Li, K. Hua, X. Li and M. Deng, J. Appl. Polym. Sci., 2015, 132, 42624 CrossRef.
- R. Chen, J. Yao, Q. Gu, S. Smeets, C. Baerlocher, H. Gu, D. Zhu, W. Morris, O. M. Yaghi and H. Wang, Chem. Commun., 2013, 49, 9500 RSC.
- B. Motevalli, H. Wang and J. Z. Liu, J. Phys. Chem. C, 2015, 119, 16762–16768 CrossRef CAS.
- B. Motevalli, N. Taherifar, H. Wang and J. Z. Liu, J. Phys. Chem. C, 2017, 121, 2221–2227 CrossRef CAS.
- S. Kim, E. Shamsaei, X. Lin, Y. Hu, G. P. Simon, J. G. Seong, J. S. Kim, W. H. Lee, Y. Moo-Lee and H. Wang, J. Membr. Sci., 2018, 549, 260–266 CrossRef CAS.
- M. Hu, Y. Ju, K. Liang, T. Suma, J. Cui and F. Caruso, Adv. Funct. Mater., 2016, 26, 5827–5834 CrossRef CAS.
- C. Lin, M. Zhou, W. Hung, B. Zhu, K. Lee, L. Zhu and L. Fang, Sep. Purif. Technol., 2018, 207, 435–442 CrossRef CAS.
- H. Sun, B. Tang and P. Wu, J. Membr. Sci., 2018, 551, 283–293 CrossRef CAS.
- K. Duan, J. Wang, Y. Zhang and J. Liu, J. Membr. Sci., 2019, 572, 588–595 CrossRef CAS.
- W. Zheng, R. Ding, K. Yang, Y. Dai, X. Yan and G. He, Sep. Purif. Technol., 2019, 214, 111–119 CrossRef CAS.
- Z. Wang, J. Hou, R. Guo and X. Li, J. Chin. Chem. Soc., 2018, 65, 1347–1355 CrossRef CAS.
- H. Zhang, R. Guo, J. Zhang and X. Li, ACS Appl. Mater. Interfaces, 2018, 10, 43031–43039 CrossRef CAS PubMed.
- H. Zhang, R. Guo, J. Hou, Z. Wei and X. Li, ACS Appl. Mater. Interfaces, 2016, 8, 29044–29051 CrossRef CAS PubMed.
- Z. Low, A. Razmjou, K. Wang, S. Gray, M. Duke and H. Wang, J. Membr. Sci., 2017, 460, 9–17 CrossRef.
- G. Liu, Z. Jiang, K. Cao, S. Nair, X. Cheng, J. Zhao, H. Gomaa, H. Wu and F. Pan, J. Membr. Sci., 2016, 523, 185–196 CrossRef.
- L. Valencia and H. N. Abdelhamid, Carbohydr. Polym., 2019, 213, 338–345 CrossRef CAS PubMed.
- H. N. Abdelhamid and X. Zou, Green Chem., 2018, 20, 1074–1084 RSC.
- Y. Li, H. Guan, T. Chung and S. Kulprathipanja, J. Membr. Sci., 2006, 275, 17–28 CrossRef CAS.
- Y. Cheng, Y. Ying, L. Zhai, G. Liu, J. Dong, Y. Wang, M. P. Christopher, S. Long, Y. Wang and D. Zhao, J. Membr. Sci., 2019, 573, 97–106 CrossRef CAS.
- R. Vaidhyanathan, S. S. Iremonger, G. K. H. Shimizu, P. G. Boyd, S. Alavi and T. K. Woo, Science, 2010, 330, 650–653 CrossRef CAS PubMed.
- Q. Xin, T. Liu, Z. Li, S. Wang, Y. Li, Z. Li, J. Ouyang, Z. Jiang and H. Wu, J. Membr. Sci., 2015, 488, 67–78 CrossRef CAS.
| This journal is © The Royal Society of Chemistry 2019 |


