 Open Access Article
Two zinc(II) coordination polymers based on flexible co-ligands featuring assembly imparted sensing abilities for Cr2O72− and o-NP†
Meili Zhang *,
Yanjin Zheng,
Min Liu,
Yixia Ren
 *,
Zhixiang Wang,
Jia Cao and
Jijiang Wang
Department of Chemistry and Chemical Engineering, Laboratory of New Energy & New Function Materials, Yan'an University, Yan'an, Shaanxi 716000, P. R. China. E-mail: ydzml2332041@163.com; Renyixia1@163.com; Fax: +86 911-2332037; Tel: +86 911-2332037
First published on 5th July 2019
Abstract
Two new Zn(II) coordination complexes, formulated as [Zn(opda)(pbib)] (1) and [Zn(ppda)(pbib)(H2O)] (2), (H2opda = 1,2-phenylenediacetic acid, H2ppda = 1,4-phenylene-diacetic acid, pbib = 1,4-bis(1-imidazoly)benzene), have been synthesized. The opda ligands extend a 1D chain containing (Zn-pbib) polymer chains into a 2D layer in 1. In 2, the ppda ligands link Zn(II) atoms to form a 2D network, then the rigid bis(imidazole) ligands give rise to the 3D structure. The fluorescence property application and mechanisms of two complexes for detecting Cr2O72− and o-NP have been researched. For two complexes, the high quenching percentage in low concentration aqueous solution are 95.75% (Cr2O72−, 1), 95.28% (Cr2O72−, 2) and 97.56% (o-NP, 1), 96.59% (o-NP, 2). Compared with 2, complex 1 has higher quenching percentage, this could be because 1 is a 3D supramolecular with a large hole. The detection limits have been measured to be 2.992 × 10⁻⁷ M (Cr2O72−, 1), and 4.372 × 10⁻⁷ M (Cr2O72−, 2), 2.103 × 10⁻⁷ M (o-NP, 1), 1.862 × 10⁻⁷ M (o-NP, 2), respectively. The emissions of two complexes could be effectively and selectively quenched by o-NP and Cr2O72−, showing their potential as multi-responsive luminescent sensors.
Introduction
Metal organic frameworks (MOFs) are crystalline solids constructed via self-assembly of metal cations and organic ligands containing multiple binding sites, forming two or three dimensional extended coordination networks. They have been extensively studied for their rich structural chemistry1–5 and potential applications in numerous areas, gas storage and separations, optical waveguides, catalysis, luminescence, sensing, and energy storage conversion.6–19 Among these applications, fluorescent sensing based on fluorescent MOFs shows great promise due to its short response time, excellent sensitivity, operability and reusability.20–22 Selective sensing is very important for the control of environmental pollution and human health. In recent years, a variety of fluorescent MOFs was designed and applied for sensing of different types of environmental pollution analyses, including small molecules, metal cations, inorganic and organic anions, solvents, gases, explosives and so on.23,24 The detection mechanism is generally based on the quenching of the luminescence of MOFs.Organic ligands play a very important role in design and preparation of fluorescent coordination polymers. The organic ligands often contain aromatic or conjugated π moieties that are subject to excitation, giving rise to optical emission or photoluminescence (PL) upon irradiation.25 The multi-carboxyl and bis(imidazole) organic ligands containing aromatic or conjugated π moieties have been employed in many reported fluorescent coordination polymers.26–29 In our recent works, a series of fluorescent coordination polymers based on flexible phenylenediacetate and different bis(imidazole) ligands have also been successfully obtained.30–32 However, there is little research on relevant fluorescent probe sensors, and only a few Zn/Cd-MOFs has been used as fluorescent probe sensors to detect metal ions, nitroaromatics, and other pollutants.33–35 So Zn/Cd-MOFs could be potential excellent sensitivity fluorescence sensor materials and need to be studied further. In this work, we adopt two similar fluorescent flexible phenylenedicarboxyl ligands (H2opda and H2ppda) as the main ligands, accompanied by a N-donor bis(imidazole) ligand (pbib), to construct two new Zn-MOFs [Zn(opda)(pbib)] (1), [Zn(ppda)(pbib)(H2O)] (2). Furthermore, their luminescent properties and sensing behaviors have also been investigated in water solution. The as-synthesized samples of these MOFs could be used directly as nitrophenol and dichromate sensors because of their sensitive and specific fluorescence response to nitrophenol and dichromate. With the comparison among two complexes and free ligands, we show that the formation of the MOFs structure is beneficial to their luminescence and sensing behaviors.
Experimental section
General procedures
Commercially obtained reagents and solvents were used. The hydrothermal reaction were performed in a 25 mL Teflon-lined stainless steel autoclave under autogenous pressure. The IR spectra were recorded as KBr pellets on a Nicolet Avatar-360 spectrometer in the range of 4000 to 400 cm−1. Elemental analyses for C, H, and N were carried out on a Flash 2000 elemental analyzer. Thermal gravimetric analyses (TGA) were carried out on a SDT Q600 thermogravimetric analyzer. A platinum pan was used for heating the sample with a heating rate of 10 °C min−1 under a N2 atmosphere. Fluorescent spectra were recorded with a Hitachi F4500 fluorescence spectrophotometer at room temperament equipped with a xenon lamp. Both excitation and emission band passes were set at 5 nm. Powder X-ray diffraction (PXRD) measurements were performed on a Bruker D8-ADVANCE X-ray diffractometer with Cu Kα radiation (λ = 1.5418 Å). Simulation of the XRPD spectra were carried out by the single-crystal data and diffraction-crystal module of the Mercury (Hg) program.Synthesis of complex [Zn(opda)(pbib)] (1)
A mixture of opda (0.0096 g, 0.05 mmol), Zn(NO3)2·6H2O (0.0297 g, 0.1 mmol), H2pbib (0.0210 g, 0.1 mmol) and KOH (0.056 g, 0.1 mmol) were added to water (12 mL) in a 25 mL Teflon-lined stainless steel vessel. The mixture was heated at 150 °C for 72 h. After the reactive mixture was slowly cooled to room temperature, colourless block crystals of 1 were obtained (yield: 45% based on Zn). Elemental analysis calcd (%) for C22H20N4O5Zn: C 54.39, H 4.15, N 11.53; found (%): C 54.28, H 4.12, N 11.45. IR (KBr pellet, ν/cm−1): 3141 w, 2379 w, 1608 s, 1577 s, 1519 m, 1396 m, 1352 s, 1112 m, 1026 w, 950 m, 853 m, 654 s.Synthesis of complex [Zn(ppda)(pbib)(H2O)] (2)
Complex 2 was synthesized by a procedure similar to that of 1, except H2ppda (0.0238 g, 0.1 mmol) replaced H2opda. Colourless block crystals of 2 were obtained (yield: 43% based on Zn). Elemental analysis calcd (%) for C22H18N4O4Zn: C 56.48, H 3.88, N 11.98; found (%): C 56.32, H 3.80, N 11.85. IR (cm−1): 3455 m, 3128 m, 2379 w, 1616 s, 1526 m, 1367 s, 1283 m, 1237 m, 1089 s, 951 m, 837 w, 712 s.Crystal structural determination
X-ray single-crystal diffraction data for two complexes were collected on a Bruker Smart 1000 CCD area-detector diffractometer with Mo-Kα radiation (λ = 0.71073 Å) by ω scan mode. The crystal structure was solved by direct methods, using SHELXS-2014 and least-squares refined with SHELXL-2014 using anisotropic thermal displacement parameters for all non-hydrogen atoms.36,37 Metal atoms were located from the E-maps and the other non-hydrogen atoms were located in successive difference Fourier syntheses and refined with anisotropic thermal parameters on F2. Further details for structural analysis are summarized in Table 1.| Complex | 1 | 2 |
|---|---|---|
| a R1 = Σ||Fo| − |Fc||/Σ|Fo|.b wR2 = [Σw(Fo2 − Fc2)2/Σw(Fo2)2]1/2. | ||
| Empirical formula | C22H20N4O5Zn | C22H18N4O4Zn |
| Formula weight | 485.82 | 467.81 |
| Crystal system | Monoclinic | Monoclinic |
| Space group | P21/n | P21/n |
| a (Å) | 12.474(3) | 11.8375(9) |
| b (Å) | 13.755(3) | 12.1648(9) |
| c (Å) | 12.771(3) | 13.9559(10) |
| α (°) | 90 | 90 |
| β (°) | 105.090(3) | 102.868(10) |
| γ (°) | 90 | 90 |
| V (Å3) | 2115.6(7) | 1959.2(3) |
| Z | 4 | 4 |
| ρ (g cm−3) | 1.5252 | 1.5859 |
| μ (mm−1) | 1.625 | 1.1425 |
| Rint | 0.0144 | 0.0130 |
| Goodness-of-fit on F2 | 1.0371 | 1.0468 |
| R1a/wR2b [I > 2σ(I)] | 0.0474/0.1516 | 0.0571/0.2030 |
| R1a/wR2b (all data) | 0.0513/0.1570 | 0.0609/0.2071 |
Fluorescent probe detection experiment
Results and discussion
Synthesis and characterization
The employment of mixed-ligands strategy has been proven a feasible method to construct new complexes structures and functional applications. However, the direct mixing of the solutions of metal salts and organic ligands usually results in precipitations that are difficult to be structurally characterized. To overcome this problem, hydrothermal method was applied in this study, which has been proven to be a powerful approach for the preparation of various crystalline materials. Complexes 1 and 2 are stable in air and common solution. The IR spectra usually show features attributable to each component of the complexes. The broad bands centered at 3455 cm−1 for complex 2 can be assigned to the coordination water molecule. The characteristic bands of carboxylate groups in complexes 1–2 appeared in the usual region at 1616–1526 cm−1 for the antisymmetric stretching vibrations and at 1519–1367 cm−1 for the symmetric stretching vibrations.Structure description of complexes
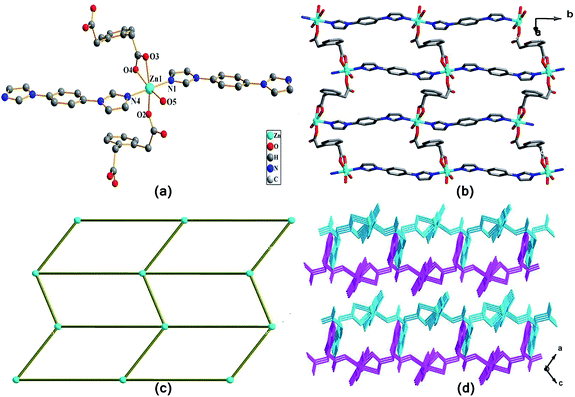
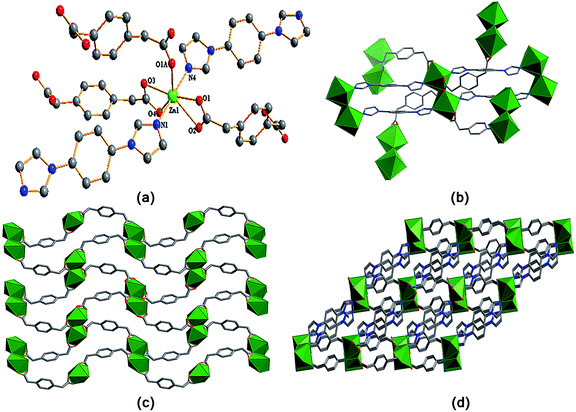
In 1, the opda ligand has a trans-conformation with two carboxyl groups locating two sides of the benzene ring plan, which can be viewed as a linear building block. Interestingly, the ppda ligand in 2 shows a cis-conformation and acts as a “V” type building block. In 2, the carboxylate groups of ppda ligand adopt μ1-η1:η1 and μ2-η2:η1 coordination modes, respectively. They link a pair of Zn(II) ions to form [Zn2O8] unit with the Zn⋯Zn separation of 3.853 Å (Fig. 2b). Each [Zn2O8] unit is fused to four neighboring units by the ppda ligands with different orientation forming a 2D plane. Such polymeric planes are extended into a 3D framework by pbib ligands with a bis-monodentate bridging mode.
The structural difference of two complexes are significantly effect by the coordination geometries of the central metal ions and the coordination modes, conformations of the organic ligands. Compared with ppda ligand, the two carboxyl groups of opda ligand have larger steric hindrance, so its dimensional performance of linking metal ions is weak. Therefore, two complexes exhibit a variety of architectures from 2D network (complex 1) to 3D framework (complex 2) due to different opda and ppda ligands.
Thermal analysis and PXRD patterns
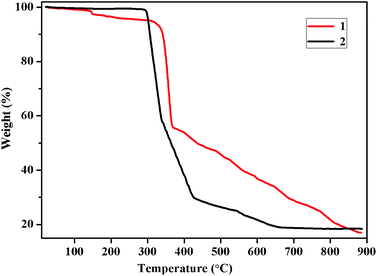
In order to check the phase purity of two complexes for the further luminescent measurements, powder X-ray diffraction (PXRD) patterns of complexes 1–2 have been carried out at room temperature (Fig. S1†). The peak positions of the experimental PXRD patterns match well with the simulated one, indicating the single-phase of corresponding materials. To examine the thermal stability of complexes 1–2, thermal gravimetric analysis (TGA) experiments for complexes 1–2 were performed by heating the corresponding samples from room temperature to 900 °C with a heating rate of 10 °C min−1 under a nitrogen atmosphere as shown in Fig. 3. In complex 1, the weight loss occurred from room temperature to 152 °C (obsd 3.46%, calcd 3.70%), which corresponds to the decomposition of framework structure on one coordinated water molecules. The TGA curve for complexes 1–2 suggested that two complexes can be stable up to 315, 292 °C, and the final residues are ZnO (obsd 17.02%, calcd 16.76%) of 1, ZnO (obsd 18.43%, calcd 17.31%) of 2, respectively.Luminescent properties
Since complexes 1 and 2 are constructed with a d10 electron configured Zn2+ ion and fluorescent multi-carboxyl, bis(imidazole) organic ligands containing aromatic or conjugated π moieties, it is highly possible for them to exhibit photoactivity. To examine the luminescent properties of these d10 metal complexes, the luminescence spectra of complexes 1 and 2, the free opda, ppda and pbib ligands have been measured at room temperature. As shown in Fig. 4, the free opda and ppda ligands display main emission peak at 368 nm (λex = 300 nm) and 451 nm (λex = 375 nm) respectively. While the pbib ligand display main emission band at 380 nm (λex = 310 nm), the emission intensities is relatively weak, so its curve does not appear in the graph. In contrast, the emission peak of complexes 1 [435 nm (λex = 370 nm)], 2 [490 nm (λex = 420 nm)], is red-shifted by 67 and 39 nm relative to the opda and ppda ligands. The closeness in the emission wavelength between pda and the two complexes indicates that the photoluminescence of 1 and 2 could be mainly attributed to pda ligand centred electronic excitation perturbed by the Zn2+ ion and other components. These shifts of the emission bands can be attributed to the deprotonated effect of opda and the coordination interactions of the organic ligands to Zn(II) ions as well as C–H⋯π interactions in two complexes network.40 The emission intensities of 1 and 2 are much stronger than that of a free pda ligand, that is the formation of complexes enhances the fluorescence of the ligand. This phenomenon is a typical example of aggregation-induced emission (AIE) and may be explained with that the coordination to metal ions in a complexes restricted the deformation of the ligand and the induced nonradiative relaxation.41,42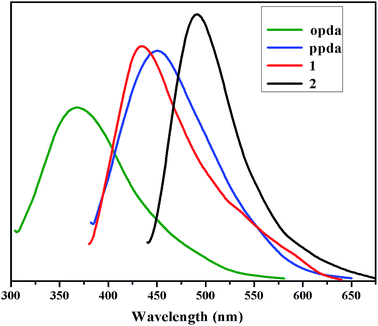 | ||
| Fig. 4 Solid-state fluorescent emission spectra of complexes 1–2, free opda and ppda ligands at room temperature. | ||
Sensing of Cr2O72− and o-NP
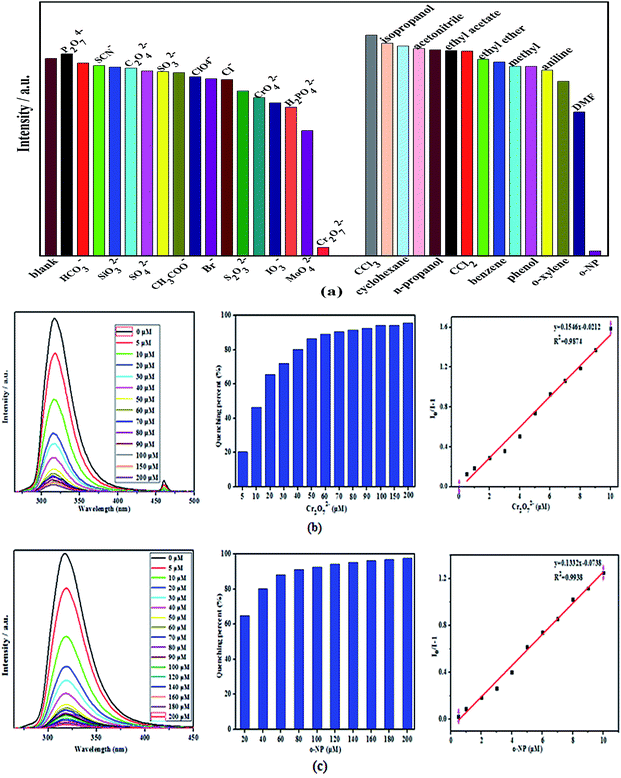
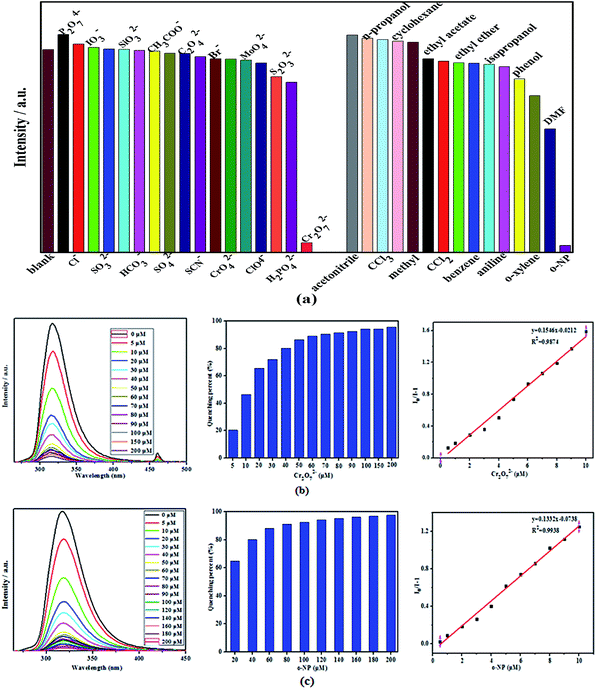
Because of the excellent water stability and strong fluorescence of two complexes, their application in sensing/detecting ions in water system were explored. Firstly, the sensing/detecting ability of two complexes toward different anions were investigated by adding the aqueous solutions of P2O7 4−, HCO32−, SCN−, SiO32−, C2O42−, SO42−, SO32−, AcO−, ClO4−, Br−, Cl−, S2O32−, CrO42−, IO3−, H2PO42−, MoO42−, and Cr2O72− with Na+ or K+ as counter cations into the suspension of two complexes (Fig. 5a and 6a). Interestingly, only Cr2O72− afforded a quite obvious luminescent quenching effect, with the percentage of quenching of complexes 1 and 2 being 95.75% and 95.28%, respectively (Fig. 5b and 6b). Secondly, the organic small molecules ethanol solution (acetonitrile, n-propanol, CCl3, cyclohexane, methyl, ethyl acetate, CCl2, ethyl ether, benzene, isopropanol, aniline, phenol, o-xylene, DMF, o-NP) was added to the complexes 1 and 2 suspension to study the sensing/detection ability of complexes 1 and 2 for different organic solvents (Fig. 5a and 6a). It was found that only o-NP had a very significant luminescence quenching effect, and the percentages of quenching of complexes 1 and 2 were 97.56% and 96.59%, respectively (Fig. 5c and 6c). However, other anions or organic small molecules only led to slight fluorescent intensity change of complexes 1 and 2 suspension. Compared with complex 2, complex 1 has higher quenching percentage, this may be attributed to the higher adsorption capacity of complex 1 with larger holes (with 10.22 × 10.89 Å window).In addition, competitive fluorescence titration experiments have been conducted, in which the emission intensity of complexes 1 and 2 were consecutively recorded upon the gradual addition of Cr2O72− aqueous solution or o-NP ethanol solution into its uniform aqueous suspension containing competing anions or small organic molecules. It should be noted that after Cr2O72− or o-NP were added to the above solution, the fluorescence was almost completely quenched. Therefore, complexes 1 and 2 have high sensitivity, selectivity, and resistance to interference from other coexisting ions in detecting Cr2O72− and o-NP in aqueous solution. More noteworthy is that the fluorescence intensity of the complexes 1 and 2 suspension significantly reduced in the first 1 min after o-NP was added and then retained an almost constant value, suggesting that the o-NP induced fluorescence quenching progress is very fast. These results indicate that complexes 1 and 2 can serve as a sensitive sensor for the selective and rapid detection of Cr2O72− and o-NP in water system.
Furthermore, we explored the quantitative detection ability of complexes 1 and 2 toward Cr2O72− or o-NP, respectively. Concentration-based quenching experiments were conducted by documenting the decrease of emission intensity of complexes 1 and 2 suspension upon the addition of Cr2O72− or o-NP, with incremental concentrations in the range of 5−200 μM. These titration curves show that the emission intensities of complexes 1 and 2 decreases with increasing Cr2O72− or o-NP concentration (Fig. 5b and 6c).The fluorescent quenching efficiency was then quantitatively evaluated by the Stern–Volmer equation, I0/I = Ksv[M] + 1, where I0 and I are the maximum luminescent intensities before and after the addition of the probe, [M] is the molar concentration of probe solution, and Ksv is the quenching constant (M−1).43–47 As shown in Fig. 6b and c, the luminescen intensity of complexes 1 and 2 suspension quenched by Cr2O72− or o-NP well follow the equation in lower concentration range, with a nearly linear correlation. Complexes 1 and 2 present the highest Ksv values (complex 1: Ksv (Cr2O72−) = 1.546 × 10⁷ M −1, R2 = 0.9874; Ksv (o-NP) = 1.332 × 10⁷ M −1, R2 = 0.9938; complex 2: Ksv (Cr2O72−) = 9.778 × 10⁸ M −1, R2 = 0.9732; Ksv (o-NP) = 1.422 × 10⁷ M −1, R2 = 0.9907) Cr2O72− or o-NP suggesting high quenching efficiency. The detection limits of Cr2O72− or o-NP were calculated using the equation: detection limit = 3σ/Ksv (σ is the standard deviation of fluorescent intensity of blank solution). Accordingly, the detection limits of complexes 1-2 for Cr2O72− or o-NP were calculated to be 2.992 × 10⁻⁷ M (Cr2O72−, complex 1), 2.103 × 10⁻⁷ M (o-NP, complex 1), 4.372 × 10⁻⁷ M (Cr2O72−, complex 2), 1.862 × 10⁻⁷ M (o-NP, complex 2), respectively. The quenching constants and detection limits of two complexes as fluorescent sensing materials for detecting Cr2O72− and o-NP surpass most of the reported CP-based fluorescent sensing materials ([Zn7(TPPE)2(SO42−)7](DMF.H2O): 1.2 × 10⁻⁶ M for Cr2O72−, {Cd(2,6-NDC)(H2O)}n: 9.2 × 10⁻⁵ M for o-NP),48,49 indicating the high sensitivity of complexes 1-2 for sensing Cr2O72− and o-NP. This result demonstrates that two complexes can be highly effective and selective luminescent sensors for Cr2O72− and o-NP, with improved or comparable performance to those of the reported Zn/Cd-MOFs probes.
In order to study the quenching mechanism of complexes 1-2 to detect Cr2O72− and o-NP, the UV-vis absorption of Cr2O72−, o-NP and complexes 1-2 in aqueous solution was determined experimentally. The energy transfer mechanism can enhance the fluorescence quenching efficiency and improve sensitivity. Energy transfer mainly depends on the extent of overlap of the absorption spectrum of the acceptor and the excitation or emission of the donor (complexes).50–55 As shown in Fig. 7a, the UV-vis absorption spectrum of Cr2O72− and o-NP showed an extensive overlap with the emission spectrum of complexes 1-2 respectively. Cr2O72− ions have wide absorption bands (from 230 to 450 nm) in the UV-vis region, which overlap with the emission bands of complexes 1-2. And o-NP can also be explained based on the photoinduced electron transfer mechanism. The nitro group of o-NP is an electron withdrawing substituent, the electron present in the excited state of complexes 1-2 is transferred to the LUMO of the electron-deficient o-NP, leading to fluorescence quenching of complexes 1-2. Thus, the predominant quenching mechanism of complexes 1-2 to detect Cr2O72− and o-NP are attributed to electron transfer.
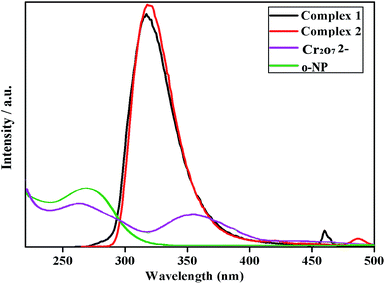 | ||
| Fig. 7 Spectral overlap between the UV-vis absorption spectra of Cr2O72− and o-NP with the emission spectrum of complexes 1-2 in aqueous solution. | ||
Conclusion
In summary, two new zinc(II) coordination polymers based on the flexible phenylenedicarboxyl acid and bis(imidazole) ligands have been synthesized under hydrothermal conditions. Two complexes exhibit different architectures from 2D network (complex 1) to 3D framework (complex 2) due to different flexible H2pda ligand. Two complexes have shown to be excellent discriminative probe for the highly selective and sensitive detection of Cr2O72− and o-NP based on their sensitive fluorescence quenching. The diversities of the structures for two complexes have some effects on the fluorescence properties to accelerate the quenching rate of Cr2O72− and o-NP, especially complex 1. The high quenching percentage and the low detection limit of Cr2O72− or o-NP may make complexes 1-2 excellent candidates for multi-responsive fluorescent probe materials.Conflicts of interest
There are no conflicts to declare.Acknowledgements
This work was financially supported by the National Natural Science Foundation of China (21573189), the Nature Scientific Foundation of the Shaanxi Province of China (2016XT-24), and the Yan'an University Undergraduate Training Programs of Innovation and Entrepreneurship (D2018010).Notes and references
- L. Xu, J. Yang, Y.-Y. Liu, G.-H. Xu and J.-F. Ma, J. Lumin., 2019, 209, 398–403 CrossRef CAS.
- J. Seco, P. Sonia, D. Briones, J. Garcia, J. Cepeda and A. Rodriguez-Dieguez, Cryst. Growth Des., 2017, 17, 3893–3906 CrossRef CAS.
- X.-Y. Liu, F.-F. Li, X.-H. Ma, P.-P. Cen, S.-C. Luo, Q. Shi, S.-R. Ma, Y.-W. Wu, C.-C. Zhang, G. Xie and S.-P. Chen, Dalton Trans., 2017, 46, 1207–1217 RSC.
- W. Lustig, S. Mukherjee, N. Rudd, A. Desai, J. Li and S. Ghosh, Chem. Soc. Rev., 2017, 46, 3242–3285 RSC.
- X.-Y. Ren and L.-H. Lu, Chin. Chem. Lett., 2015, 26, 1439–1445 CrossRef CAS.
- B. Li, H.-M. Wen, Y. Cui, W. Zhou, G. Qian and B. Chen, Adv. Mater., 2016, 28, 8819–8860 CrossRef CAS PubMed.
- W.-J. Shi, L.-Y. Du, H.-Y. Yang, K. Zhang, L. Hou and Y.-Y. Wang, Inorg. Chem., 2017, 56, 10090–10098 CrossRef CAS.
- L.-Y. Du, H. Wang, G. Liu, D. Xie, F.-S. Guo, L. Hou and Y.-Y. Wang, Dalton Trans., 2015, 44, 1110–1119 RSC.
- Y.-Z. Li, H.-H. Wang, H.-Y. Yang, L. Hou, Y.-Y. Wang and Z.-H. Zhu, Chem.–Eur. J., 2018, 24, 865–871 CrossRef CAS PubMed.
- R.-W. Huang, Y.-S. Wei, X.-Y. Dong, X.-H. Wu, C.-X. Du, S.-Q. Zang and T. Mak, Nat. Chem., 2017, 9, 689–697 CrossRef CAS.
- Y. Li, H. Song, Q. Chen, K. Liu, F.-Y. Zhao, W.-J. Ruan and Z. Chang, J. Mater. Chem. A, 2014, 2, 9469–9473 RSC.
- P.-C. Li, L. Zhang, M. Yang and K.-L. Zhang, J. Lumin., 2019, 207, 351–360 CrossRef CAS.
- O.-B. Le, S. Kitagawa and T. Uemura, J. Am. Chem. Soc., 2017, 139, 7886–7892 CrossRef PubMed.
- D. Liu, J.-P. Lang and B. Abrahams, J. Am. Chem. Soc., 2011, 133, 11042–11045 CrossRef CAS.
- P. Ghorai, S. Banerjee, D. Nag, S. Mukhopadhyay and A. Saha, J. Lumin., 2019, 205, 197–209 CrossRef CAS.
- Q. Tang, S. Liu, Y. Liu, J. Miao, S. Li, L. Zhang, Z. Shi and Z. Zheng, Inorg. Chem., 2013, 52, 2799–2801 CrossRef CAS.
- W.-J. Gong, R. Yao, H.-X. Li, Z.-G. Ren, J.-G. Zhang and J.-P. Lang, Dalton Trans., 2017, 46, 16861–16871 RSC.
- H. Guo, Y. Zhang, Z. Zheng, H. Lin and Y. Zhang, Talanta, 2017, 170, 146–151 CrossRef CAS.
- K. Sumida, D. Rogow, J. Mason, T. McDonald, E. Bloch, Z. Herm, T. Bae and J.-R. Long, Chem. Rev., 2012, 112, 724–781 CrossRef CAS.
- J. Yu, L.-H. Xie, J.-R. Li, Y. Ma, J. Seminario and P. Balbuena, Chem. Rev., 2017, 117, 9674–9754 CrossRef CAS PubMed.
- N. Huang, K. Wang, H. Drake, P. Cai, J. Pang, J. Li, S. Che, L. Huang, Q. Wang and H.-C. Zhou, J. Am. Chem. Soc., 2018, 140, 6383–6390 CrossRef CAS.
- R.-W. Huang, Y.-S. Wei, X.-Y. Dong, X.-H. Wu, C.-X. Du, S.-Q. Zang and T. Mak, Nat. Chem., 2017, 9, 689–697 CrossRef CAS.
- Z. Lv, C. Liang, J. Cui, Y. Zhang and S. Xu, RSC Adv., 2015, 5, 18213–18217 RSC.
- P. Ju, E. Zhang, L. Jiang, Z. Zhang, X. Hou, Y. Zhang, H. Yang and J. Wang, RSC Adv., 2018, 8, 21671–21678 RSC.
- B. Parmar, Y. Rachuri, K. Bisht, R. Laiya and E. Suresh, Inorg. Chem., 2017, 56, 2627–2638 CrossRef CAS.
- G.-X. Wen, M.-L. Han, X.-Q. Wu, Y.-P. Wu, W.-W. Dong, J. Zhao, D.-S. Li and L.-F. Ma, Dalton Trans., 2016, 45, 15492–15499 RSC.
- K. Wang, X.-L. Lv, D. Feng, L. Jian, S. Chen and J. Sun, J. Am. Chem. Soc., 2016, 138, 914–919 CrossRef CAS.
- J.-C. Jin, X.-R. Wu, Z.-D. Luo, F.-Y. Deng, J.-Q. Liu, A. Singh and A. Kumar, CrystEngComm, 2017, 19, 4368–4377 RSC.
- B. Guo, L. Li, Y. Wang, Y. Zhu and G. Li, Dalton Trans., 2013, 42, 14268–14280 RSC.
- M.-L. Zhang, Y.-J. Zheng, Z.-Z. Ma, Y.-X. Ren and J.-J. Wang, Polyhedron, 2018, 154, 473–479 CrossRef CAS.
- M.-L. Zhang, J.-J. Wang, Z.-Z. Ma and L. Qiao, New J. Chem., 2017, 41, 12139–12146 RSC.
- M.-L. Zhang, Y.-J. Zheng, Z.-Z. Ma, Y.-X. Ren, J. Cao, Z.-X. Wang and J.-J. Wang, Polyhedron, 2018, 146, 180–186 CrossRef CAS.
- X. Wang, Y. Han, X.-X. Han, X. Hou, J.-J. Wang and F. Fu, New J. Chem., 2018, 42, 19844–19852 RSC.
- W.-M. Chen, X.-L. Meng, G.-L. Zhuang, Z. Wang, M. Kurmoo, Q.-Q. Zhao, X.-P. Wang, B. Shan, C.-H. Tung and D. Sun, J. Mater. Chem. A, 2017, 5, 13079–13085 RSC.
- S. Nagarkar, B. Joarder, A. Chaudhari, S. Mukherjee and S. Ghosh, Angew. Chem., Int. Ed., 2013, 52, 2881–2885 CrossRef CAS.
- G. M. Sheldrick, SHELXL-2014/7, Program for Crystal Structure Determination, University of Gottingen, Germany, 2014 Search PubMed.
- G. M. Sheldrick, SHELXL-2014/7, Program for Crystal Structure Refinement, University of Gottingen, Germany, 2014 Search PubMed.
- S.-B. Miao, Z.-H. Li, C.-Y. Xu and B.-M. Ji, Chin. J. Struct. Chem., 2016, 35, 1960–1966 CAS.
- C. Qin, X.-L. Wang, L. Carlucci, M.-L. Tong, E.-B. Wang, C.-W. Hu and L. Xu, Chem. Commun., 2004, 16, 1876–1877 RSC.
- B. Barros, J. Chojnacki, A. Macedo Soares, J. Kulesza, L. Lourenço and S. Junior, Mater. Chem. Phys., 2015, 162, 364–371 CrossRef CAS.
- J. Meisner, J. Karwounopoulos, P. Walther, K. Johannes and N. Stefan, Molecules, 2018, 23, 432–446 CrossRef.
- W. Hong, L. Li, R. Xue, X. Xu, H. Wang and J. Zhou, J. Colloid Interface Sci., 2017, 485, 175–182 CrossRef CAS PubMed.
- R. Lv, J. Wang, Y. Zhang, H. Li, L. Yang, S. Liao, W. Gu and X. Liu, J. Mater. Chem. A, 2016, 4, 15494–15500 RSC.
- T. He, Y.-Z. Zhang, X.-J. Kong, J. Yu, X.-L. Lv, Y. Wu, Z.-J. Guo and J.-R. Li, ACS Appl. Mater. Interfaces, 2018, 10, 16650–16659 CrossRef CAS.
- J.-N. Hao and B. Yan, New J. Chem., 2016, 40, 4654–4661 RSC.
- S. Yao, T. Xu, N. Zhao, L. Zhang, Q. Huo and Y. Liu, Dalton Trans., 2017, 46, 3332–3337 RSC.
- W.-J. Gong, R. Yao, H.-X. Li, Z.-G. Ren, J.-G. Zhang and J.-P. Lang, Dalton Trans., 2017, 46, 16861–16871 RSC.
- X.-X. Wu, H.-R. Fu, M.-L. Han, Z. Zhou and L.-F. Ma, Cryst. Growth Des., 2017, 17, 6041–6048 CrossRef CAS.
- P. Ghosh, S. K. Saha, A. Roychowdhury and P. Banerjee, Eur. J. Inorg. Chem., 2015, 2851–2857 CrossRef CAS.
- B.-B. Lu, W. Jiang, J. Yang, Y.-Y. Liu and J.-F. Ma, ACS Appl. Mater. Interfaces, 2017, 9, 39441–39449 CrossRef CAS.
- D. Gao, Z. Wang, B. Liu, L. Ni, M. Wu and Z. Zhang, Anal. Chem., 2008, 80, 8545–8553 CrossRef CAS.
- S.-S. Jin, X. Han, J. Yang, H.-M. Zhang, X.-L. Liu and J.-F. Ma, J. Lumin., 2017, 188, 346–355 CrossRef CAS.
- Z.-J. Lin, H.-Q. Zheng, H.-Y. Zheng, L.-P. Lin, Q. Xin and R. Cao, Inorg. Chem., 2017, 56, 14178–14188 CrossRef CAS.
- Y. Rachuri, B. Parmar, K. Bisht and E. Suresh, Cryst. Growth Des., 2017, 17, 1363–1372 CrossRef CAS.
- S. Mukherjee, W. Lustig, N. Rudd, A. Desai, J. Li and S. Ghosh, Chem. Soc. Rev., 2017, 46, 3242–3285 RSC.
Footnote |
| † Electronic supplementary information (ESI) available. CCDC 1895715 and 1895714. For ESI and crystallographic data in CIF or other electronic format see DOI: 10.1039/c9ra03822a |
| This journal is © The Royal Society of Chemistry 2019 |

