 Open Access Article
Synthesis and appraisal of a hydroxyapatite/pectin hybrid material for zinc removal from water†
Pan Ni and
John T. Fox *
*
Department of Civil and Environmental Engineering, Lehigh University, 1 West Packer Avenue, Bethlehem, PA 18015, USA. E-mail: jtf211@lehigh.edu; Tel: +1-610-758-2593
First published on 5th July 2019
Abstract
A simple method to modify hydroxyapatite and pectin into an efficient zinc sorbent was investigated. Process and formulation modifications enabled the formation of a flower-like hydroxyapatite/pectin hybrid material. The hybrid material was characterized with scanning electron microscopy, elemental analysis, and zeta potential tests. Sorption data were analyzed with different kinetic and isotherm models. The results showed that the pseudo-second order kinetic model and two-staged isotherm curves with Langmuir at the first stage and a Freundlich model the at second stage could best describe the zinc sorption on the hybrid. The maximum experimental sorption capacity was 330.4 mg Zn2+ per gram of sorbent, which was obtained with an initial concentration of 260 mg L−1 Zn2+ at pH 5.0. pH monitoring and Zeta potential tests suggested surface complexation and electrostatic attraction were fundamental in the zinc sorption process.
1. Introduction
Aquatic heavy metal pollutants are of environmental significance due to non-degradability and toxicity to both humans and the ecosystem.1 Although technologies such as membrane systems,2 ion exchange,3 and electrodeposition4 are widely utilized for metal removal, adsorption processes are still considered more competitive due to costs and ease of operation. There are many adsorbents available for metal removal.5 Among those adsorbents investigated, hydroxyapatite (Ca10(PO4)6(OH)2, HAP) is widely utilized for metals, due to the strong affinity towards Pb2+, Cd2+, Ni2+, Zn2+,6,7 low water solubility,8 biological compatibility (low eco-toxicity)9 and the ease of regeneration.10,11 However, the limited surface area of HAP (e.g. 16.1 m2 g−1),6 as well as the reported weak electrostatic attraction toward metal cations12 undermine their applications in the heavy metal removal process.In order to overcome these shortcomings, many investigations have been focused on HAP modification. For instance, Pakade and Chand7 used apple pomace as a scaffold for HAP loading. The modified HAP was efficient at removing Pb2+ (303 mg g−1), Cd2+ (250 mg g−1) and Ni2+ (100 mg g−1). However, the sorption ability of precursor materials, HAP and apple pomace, was not tested yet, making it difficult to tell whether the modification effective or not. Interestingly, Fernando et al.13 observed a sharp drop in Pb2+ sorption capacity when they compared HAP coated granular activated carbon (14 mg g−1) with that of the precursor material of needle-like HAP (83 mg g−1). The advantage of their modification as they emphasized in the article, was lower Ca2+ leaching and thus less concern on water hardness. Other researchers use biological molecules, such as chitosan or amino-phosphate molecules to modify HAP in order to form new composites for metal removal from water.8,14 It was reported that composite sorbents made via in situ incorporation of 2.5 wt% nitrilotris (methylene) triphosphonic acid (NTP) molecules in the HAP, demonstrated better Zn2+ and, Pb2+ sorption than HAP alone, as the capacity was increased by 30.7% for Zn2+ and 47.5% for Pb2+. The material property enhancement attributed with the performance improvement was increased surface area, which increased from 120 m2 g−1 to 160 m2 g−1, and the external phosphate groups enhanced by NTP. However, the maximum capacity of the composite was obtained when 10 wt% NTP was used, yet the surface area was 23.3% lower than the synthesized HAP.14 One potential concern with the modification is that the additive, NTP, is an amino-phosphate compound and may cause eutrophication if leached to surface waters.
Compared to NTP or chitosan, pectin is an alternative bio-material for HAP modification, which is available at a low cost; possesses high levels of oxygen enriched groups like –OH and –COOH; and poses negligible environmental risk.15,16 Previously, Gong et al.17 synthesized a Fe3O4–pectin composite by a simple iron salt co-precipitation method for copper removal. The maximum adsorption capacity was 48.99 mg g−1. Since higher pH promoted Cu2+ adsorption and a decrease in pH followed copper uptake, electrostatic forces and ion exchange were determined to drive the adsorption process.17 As to the investigations of pectin, collagen or chitosan HAP based material, many studies focused on the medical field applications such as bone tissue scaffold development,9 drug delivery, cell immobilization,18,19 anti-bacteria material20 or even the crystal growth affection of HAP itself.15 As far as we know, no one applied pectin modified HAP in zinc removal.
In the present work, a novel HAP/pectin hybrid material was developed as a metal sorbent for water treatment. The metal sorption ability of the hybrid was tested and compared with the precursor materials of pectin and HAP. Herein, Zn2+ was selected as the target heavy metal since it was well reported that zinc ions are more difficult to remove than Cu2+, Pb2+, Cd2+ by various adsorbents, including moss, peat, hydrous manganese oxide nanoparticles, activated carbon, activated phosphate rock and soil. The challenge with zinc removal is due to the small ionic radius, low electronegativity and classification of a borderline Lewis acid.21–25
2. Experiments
2.1. Materials
The powder hydroxyapatite (34–40% Ca), NaOH pellets (98%) were purchased from Alfa Aesar (Haverhill, MA). KNO3 (≥99%) and ZnCl2 (98.7%) were purchased from Fisher Scientific (Hampton, NH). Nitric acid (65%, 2.5 L) was purchased from EMD Millipore (Burlington, MA). Pectin derived from citrus peels, containing galacturonic acid ≥ 74.0%, was purchased from Sigma-Aldrich (St. Louis, MO). Ethanol, 190 Proof, was purchased from VWR (Radnor, PA).2.2. Preparation of the HAP/pectin hybrid
HAP/pectin hybrids were synthesized by measuring 3 grams of HAP, which was added into 30 mL deionized water. Then, 65% HNO3 was added dropwise to dissolve the HAP. After the HAP was completely dissolved and the solution became transparent, 100 mL of 0.5% (w/v) pectin was added and mixed with a magnetic stirrer for 10 minutes. The pectin solution was prepared by heating the mixture at 60 °C for 2 hours. Then the resulting mixture was precipitated with concentrated NaOH (2 M) at pH 10, leading to a milk-like suspension. Subsequently, the suspension was added dropwise into 300 mL ethanol (95%, 190 proof), filtered and dried at 60 °C for 12 hours. This synthesized hybrid was rinsed using deionized water to wash off the residual NaOH until the pH of the rinsing water was neutral, and was once-again filtered and dried at 60 °C in the oven for 24 hours. Finally, the HAP/pectin hybrid materials were ground and sieved via no. 200 mesh sieve for further use (the commercial HAP was sieved in the same way).2.3. Characterization methods
The surface zeta potential of HAP/pectin hybrids were appraised under a range of pH conditions, as described elsewhere,26 by using a Malvern Zeta-Sizer. Specifically, the suspensions were prepared by adding 0.05 grams of adsorbent into 100 mL of 1 mM KNO3 solution. The suspensions were ultra-sonicated for 2 minutes, then the suspensions were aged for 12 hours at ambient temperature. The pH was then adjusted to the desired set-points, ranging from 4.5 to 10.0. Subsequently, those suspensions were aged for 30 min and the zeta potential of each samples were tested immediately after the pH was tested (the pH tested here was used as the final pH). The morphology and elemental analysis studies of all adsorbent samples were carried out by utilizing the Phenom XL Scanning Electron Microscope (SEM) equipped with an Energy Dispersive X-ray detector (EDX). The instrument was operated under high vacuum with a backscatter electron detector (BSD). The accelerating voltage was set to 15 kV throughout the analysis. The surface area was quantified by Micromeritics ASAP 2020 based on N2 adsorption/desorption isotherms collected at 87 K using the BET method. Fourier transformed infrared spectroscopy (FT-IR) of the adsorbents were collected using a Thermo-Scientific™ Nicolet™ iS™ 10 FT-IR spectrometer scanning between 650-4000 cm−1. The powder samples were oven dried at 80 °C for 12 hours before analysis. The X-ray diffraction (XRD) analysis was performed by using Rigaku MiniFlex II diffractometer with graphite monochromatized Cu-Kα radiation (λ = 1.5406 Å) under 30 kV, 15 mA and scanning between 10° to 70° (2θ) with a step of 0.02°. The identification of crystalline phases was determined by MDI Jade 6 (Materials Data Inc.).2.4. Sorption studies
Batch tests were performed to determine the kinetics of the sorption. Specifically, 1.0 L of 180 mg L−1 Zn2+ solution was prepared and adjusted to pH 5.0 with 1 M HNO3. At time zero, 0.5 grams of adsorbent was added to the solution. The mixture was then placed in a New Brunswick Scientific incubator shaker at 25 ± 1 °C, set to a mixing speed of 200 rpm. At desired time intervals a 10 mL sample solution was withdrawn from the 1.0 L solution at 5 min, 15 min, 30 min, 1 h, 3 h, 6 h, 12 h, 24 h, and 48 h. The samples were then filtered with 0.45 μm glass fiber filters and analyzed by a PerkinElmer Analyst 200 AAS. The reproducibility of the zinc concentration was ensured by repeating the experiments twice, and the average values are reported herein.The sorption capacity was appraised experimentally by placing 50 mg of adsorbents in a 250 mL conical flask containing 100 mL of the desired zinc solution. The samples were placed in a New Brunswick Scientific incubator shaker at 25 ± 1 °C with a rotation speed set at 200 rpm. The zinc solution was designed to start at concentrations ranging from 40 to 260 mg L−1 of Zn2+ (40–180 mg L−1 for the commercial HAP, 120–260 mg L−1 for the HAP/pectin hybrid), and the pH was adjusted to 5.0 using 1 M HNO3. The authors utilized nine different concentrations for each isotherm. After 48 hours of treatment, the adsorbents were separated from the solution using a 0.45 μm glass fiber filter. At equilibrium, both the zinc concentrations and pH were measured by a PerkinElmer Analyst 200 AAS and pH meter. The isotherms were modeled by utilizing the initial zinc concentration, the equilibrium zinc concentration, the liquid volume, the mass of adsorbent, and were then fit to the Langmuir (eqn (1)), Freundlich (eqn (2)), and Temkin (eqn (3)) isotherm equations:
 | (1) |
| qe = KfCen | (2) |
 | (3) |
The reproducibility in the zinc concentration and pH measurements was ensured by repeating the experiments twice, and the average values are reported.
3. Results and discussion
3.1. Synthesis optimization
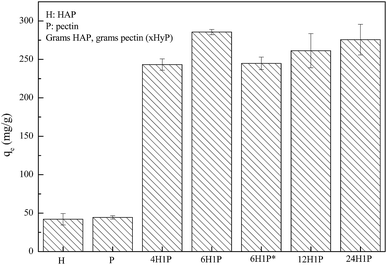
Our preliminary work demonstrated that the HAP/pectin hybrid material performed better in aqueous zinc removal than the precursor materials, HAP or pectin. As is illustrated in Fig. 1, after 48 hours treatment, 1 gram of HAP can remove 42.1 ± 7.5 mg of Zn2+ while pectin removed a comparable amount at 44.4 ± 2.2 mg of Zn2+. These results were consistent with the previous investigations on HAP6,11,27 and pectin.28,29 However, under the same experimental conditions, the capacity of five different HAP/pectin hybrids averaged more than 225 mg Zn2+ per gram of adsorbent. By adjusting the mass ratio of HAP and pectin; and modifying the synthesis procedure (with or without ethanol dehydration treatment), the best performing hybrid (6H1P) achieved 285.6 ± 3.3 mg Zn2+ per gram of hybrid adsorbent.3.2. XRD analysis
XRD patterns are displayed in Fig. 2, for the native HAP, compared to the synthesized HAP/pectin hybrid powders. As is shown in HAP's diffractogram, the typical diffraction peaks at 26°, 32°, 33°, 34° and 64° corresponding to the HAP structure were detected (JCPDS no. 09-0432). The strong and sharp peaks suggested that HAP was well crystallized. For the hybrid material, a mixture of three calcium phosphates: HAP, brushite (CaPO3(OH)·2H2O) and monetite (CaPO3(OH)) were confirmed based on MDI Jade 6 database. It's reported that the brushite and monetite are common impurities in the synthesis of HAP under mild conditions.30 The peaks standing for HAP became significantly short and broadened indicating a less crystalized status. The low temperature used to dry the material (60 °C) as well as the introduction of organic molecules (pectin) may contribute to this phenomenon. Saoiabi et al.31 reported a similar crystallinity decrease when they used nitrilotris (methylene) triphosphonic acid as an additive in their HAP modification process. However, the principal peaks at 11.8°, 21°, 29°, 35° standing for brushite (JCPDS no. 09-0077) and those at 13°, 26.5°, 30°, 33°, 36° standing for monetite (JCPDS no. 09-0080) were pretty strong and sharp in our case, indicating a high crystallinity inside these two phosphates, brushite and monetite.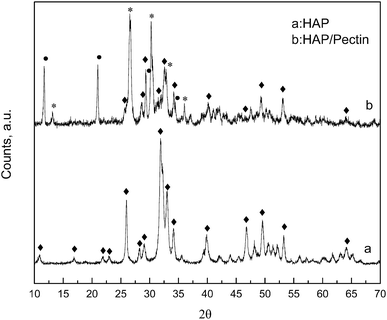 | ||
| Fig. 2 XRD patterns of HAP and optimized HAP/pectin hybrid. Principal diffractions of HAP (◆); CaPO3(OH)·2H2O (●); CaPO3(OH) (*). | ||
3.3. FTIR analysis
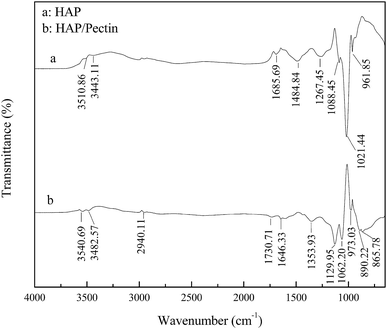
The recorded FTIR spectra of HAP and HAP/pectin hybrid are shown in Fig. 3 in the wavelength range 650–4000 cm−1. The broad and not intense O–H stretching band in the region 3550–3400 cm−1 is caused by the presence of lattice water in the solid.32 The bands corresponding to the vibration of carbonate was observed in both HAP and HAP/pectin powder. For the HAP, the carbonate impurities is likely to cause the broad pit at 1485, 1686 cm−1 (ref. 10) and is reflected by the floating mass ratio of calcium (34–40%) in the commercial product. For the hybrid, the characteristic pits of carbonate group at 866, 890 cm−1 (ref. 10 and 32) was suggested to be caused in the hybrid synthesis procedure when 2 M of NaOH was used to promote the precipitation of HAP, inducing CO2 absorption from the atmosphere.33 The band at 1267 cm−1 was likely derived from HPO42−.34 The pits at 1088, 1021, 962 cm−1 for HAP and the 1130, 1062, 973 cm−1 for the hybrid were suggested to be the typical bands of PO43−.35 It should be noted that a 11–42 cm−1 blue shift of PO43− pits occurred when HAP/pectin hybrid was compared with HAP, indicating a possible strong interaction between HAP and pectin inside the hybrid.36 Previously, Fu et al.37 reported the strong chemisorption of tartaric acid toward HAP via carboxylic acid groups chelating with calcium from HAP. Since the pectin used in our HAP/pectin hybrid contains galacturonic acid ≥ 74.0%, a similar process was expected to occur in this case. Moreover, the alkyl (–CHn) pit at 2940 cm−1, carboxylate (COO–) pits at 1354, 1646 cm−1, carboxyl-ester (COOR) pit at 1731 cm−1 were detected,37,38 indicating the successful loading of the pectin onto the HAP.3.4. SEM-EDX analysis
The HAP and HAP/pectin hybrid powder were examined by SEM. Significant differences in morphology were observed. For commercial HAP, spherical-like aggregates with diameters less than 30 μm were exhibited in Fig. 4A and B. The HAP/pectin hybrid appeared as large flower-like particles consisting of sheet-like subunits (∼650 nm in thickness). As is illustrated in Fig. 4D and E, the size of the hybrid is larger than that of the HAP. Some of the hybrid particles were larger than 60 μm in diameter.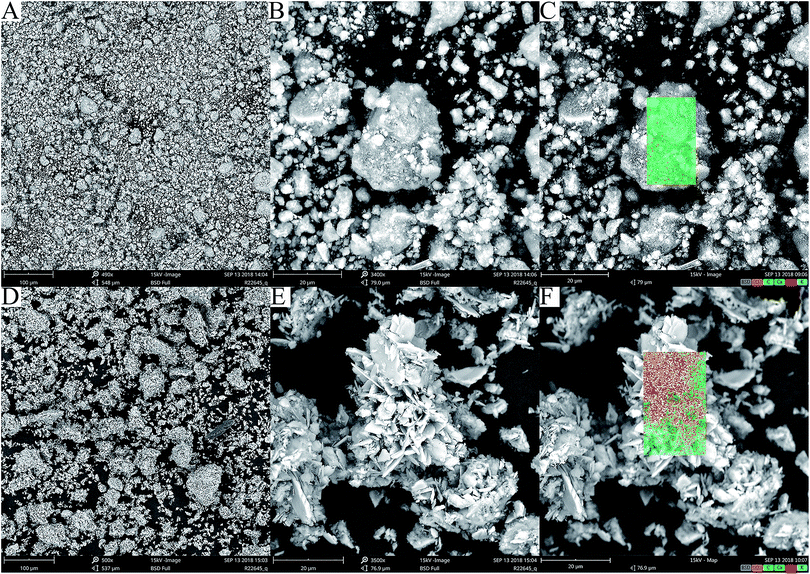 | ||
| Fig. 4 SEM images of HAP (A and B); and HAP/pectin hybrids (D and E), with elemental mapping by EDX detector was shown in (C) HAP and (F) HAP/pectin. | ||
Elemental mapping by EDX was also performed and repeated on 10 different particles of HAP or hybrid. In all cases, EDX analysis showed the presence of Ca, O, C, P, K (Table 1 and Fig. 4C and F). The atomic ratio of Ca to P on the surface of the materials was 2.1 for HAP and 1.3 for the hybrid, indicating impurities inside the adsorbents based on the stoichiometric ratio of Ca to P (1.67) in the hydroxyapatite.39 The detected carbonate bands by FTIR spectrum shown in Fig. 3 may explain the higher Ca/P ratio inside the HAP since the existence of CaCO3 will absolutely increase the ratio. Sebei et al.39 reported a similar result caused by calcium carbonate in the synthesized HAP. For the low atomic ratio of Ca to P in the hybrid, the reason may be related to the phosphate impurities detected by XRD (see Fig. 2). The stoichiometric ratio of Ca/P in brushite and monetite is 1 while that of HAP is 1.67. Based on atomic ratio of Ca to P in hybrid shown in Table 1, the chemical components composition can be calculated with the hybrid containing 44.8% HAP and 55.2% brushite & monetite. Previously, Minh et al.30 also observed the similar low Ca/P atomic ratio on the surface of their synthesized HAP and suggested the reason was related to the existence of brushite and monetite.
| Adsorbents | Atomic% | |||||
|---|---|---|---|---|---|---|
| Ca | O | C | P | K | Ca/P | |
| HAP | 18.3 ± 3.1 | 52.3 ± 2.7 | 20.8 ± 4.2 | 8.6 ± 1.0 | 0.06 ± 0.00 | 2.1 ± 0.1 |
| HAP/pectin | 12.9 ± 2.7 | 54.3 ± 3.6 | 23.1 ± 2.0 | 9.7 ± 2.6 | 0.03 ± 0.01 | 1.3 ± 0.1 |
Additionally, compared to the HAP, the carbon and oxygen atomic level in the hybrid was higher (Table 1). Possible reasons that may contribute to the higher carbon and oxygen levels include the formation of carbonate via CO2 absorption from the atmosphere in the synthesis of HAP/pectin hybrid; and the loading of pectin onto the HAP. Based on the fact that O increased by 2% and C increased by 2.3%, the loading of pectin is more likely to be the reason since pectin with a low esterification can induce equivalent atomic increase of element C and O when pectin's fundamental unit C6O6 was considered.15 The rest of the carbon detected in both HAP and the hybrid was likely from carbonate impurities based on the FTIR analysis.
3.5. Sorption kinetics
The amount of Zn2+ adsorbed onto HAP and HAP/pectin hybrid as a function of time at pH 5.0, at an initial zinc concentration of 180 mg L−1, is illustrated in Fig. 5A. The figure demonstrates a sharp sorption increase in both adsorbents within the first hour, then the sorption rate slowed down until pseudo equilibrium after 48 hours. It is noteworthy that the zinc sorption ability of the hybrid was more than 6 times as much as that of its parental HAP, indicating the effectiveness of the modification process.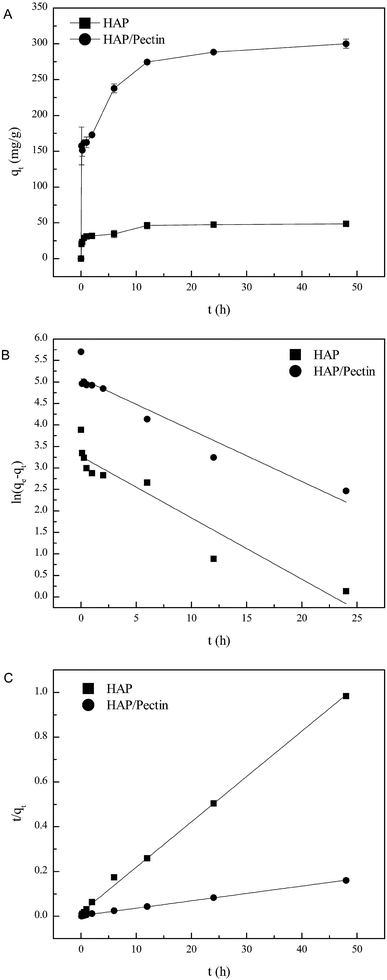 | ||
| Fig. 5 (A) Adsorbed zinc as a function of time, (B) linear fit using pseudo-first order model and (C) linear fit using pseudo-second order model. | ||
In order to gain insight into the Zn2+ sorption rate and the potential rate-controlling steps, the modified pseudo first and second order models40,41 were employed to fit the sorption data shown in Fig. 5A.
For the pseudo first order model:
ln(qe − qt) = ln![[thin space (1/6-em)]](https://www.rsc.org/images/entities/char_2009.gif) qe − k1t qe − k1t
| (4) |
For the pseudo second order model:
 | (5) |
As is shown in Table 2, the correlation coefficient (R2) values of pseudo second order were 0.998 for HAP and 0.999 for the hybrid while those of the pseudo first order were 0.893 for HAP and 0.904 for the hybrid, which is also visually apparent in the difference between Fig. 5B compared to Fig. 5C improved fit. Additionally, the calculated qe via pseudo second order (49.4 mg g−1 for HAP, 303.0 mg g−1 for the hybrid) were much closer to the actual experimental ones than those derived from the pseudo first order model. The zinc sorption by HAP and HAP/pectin matches pseudo second order kinetics, indicating that chemisorption is the rate controlling step and more than one-step may be involved in the sorption processes.42,43 The initial sorption rate was 61.50 (mg (g−1 h−1)) for HAP and 353.4 (mg (g−1 h−1)) for the hybrid, consistent with observations from Fig. 5A where more than half of the Zn2+ adsorbed within the first hour. Also, the much higher capacity of HAP/pectin than that of HAP is apparent. Adsorbents with higher sorption capacities often have lower k2 values.41
| Adsorbents | qe,exp (mg g−1) | Pseudo-1st order | Pseudo-2nd order | |||||
|---|---|---|---|---|---|---|---|---|
| k1 (h−1) | qe,cal (mg g−1) | R2 | k2 (g (mg−1 h−1)) | qe,cal (mg g−1) | h (mg (g−1 h−1)) | R2 | ||
| HAP | 48.8 | 0.143 | 26.21 | 0.892 | 0.025 | 49.40 | 61.50 | 0.998 |
| HAP/pectin | 300.2 | 0.120 | 160.3 | 0.901 | 0.0038 | 303.0 | 353.4 | 0.999 |
The performance of the HAP/pectin hybrid in this work with other HAP or pectin-based adsorbents in the literature for the removal of Zn2+ is provided in Table 3. As shown, the pectin modified HAP in this work has a higher capacity than most of the adsorbents reported, with the exception of nitrilotris (methylene) triphosphonic acid (NTP) modified natural phosphate which reported a 300.7 mg g−1 experimental capacity toward Zn2+.31 It should be noted, however, that pectin used is lower cost than that of NTP.
| Adsorbents | Surface area (m2 g−1) | pH0 | Temperature (°C) | Capacity (mg g−1) | Ref. |
|---|---|---|---|---|---|
| a Denotes that 333.3 mg g−1 was obtained based on the data fitted in Langmuir model in Table 5. The highest experimental capacity was 330.4 mg g−1 at initial zinc concentration of 260 mg L−1 shown in Fig. 6.b Denotes the maximum experimental capacity as the authors did not fit their data in Langmuir model; pH0 is the initial pH; room is short for room temperature; NA is short for not available. | |||||
| HAP/pectin | 26.4 | 5.0 | 25 | 333.3a | This work |
| HAP | 46.6 | 5.0 | 25 | 63.3 | This work |
| HAP | 56 | 5.0 | Room | 228.8b | 44 |
| Mineral apatite | 27 | 6.5 | Room | 108b | 45 |
| Natural phosphate | 150 | 5.0 | 25 | 150 | 31 |
| Natural phosphate-NTP | 145 | 5.0 | 25 | 300 | 31 |
| HAP | 76.6 | 6.0 | 30 | 102 | 10 |
| HAP | 148 | 4.9 | Room | 123b | 39 |
| HAP | 77 | 6.8 | 26 | 37 | 11 |
| HAP | 40 | 4.7 | 23 | 17.7 | 46 |
| HAP-NTP | 92 | 5.0 | 25 | 297 | 14 |
| HAP | 120 | 5.0 | 25 | 158.5 | 14 |
| HAP | 85.4 | 6.0 | Room | 33b | 6 |
| Pectin | NA | 6.0 | 30 | 131.6 | 16 |
| Pectin-polysaccharide | NA | 5.0 | 22 | ≤25.4b | 29 |
3.6. Sorption isotherms
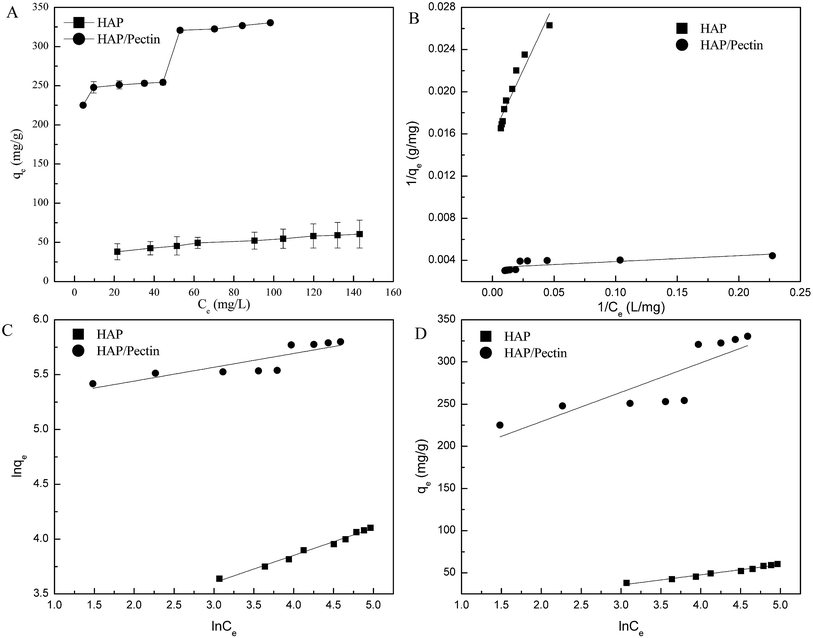
In this case, the Langmuir (eqn (6)), Freundlich (eqn (7)) and Temkin isotherm models (eqn (8))47,48 were adopted to analyze the experimental data, and the results are provided in Fig. 6 and Table 4.
 | (6) |
lnqe = ln![[thin space (1/6-em)]](https://www.rsc.org/images/entities/char_2009.gif) kf + n kf + n![[thin space (1/6-em)]](https://www.rsc.org/images/entities/char_2009.gif) ln ln![[thin space (1/6-em)]](https://www.rsc.org/images/entities/char_2009.gif) Ce Ce
| (7) |
 | (8) |
| Adsorbents | Langmuir | Freundlich | Temkin | ||||||
|---|---|---|---|---|---|---|---|---|---|
| qm (mg g−1) | k (L mg−1) | R2 | n | kf | R2 | b (kJ mol−1) | kT | R2 | |
| HAP | 63.3 | 0.06 | 0.91 | 0.249 | 17.4 | 0.99 | 0.204 | 0.93 | 0.97 |
| HAP/pectin | 300.3 | 0.59 | 0.48 | 0.126 | 179.3 | 0.72 | 0.071 | 97.9 | 0.69 |
The equilibrium concentration is Ce (mg L−1), qe is the equilibrium adsorption capacity (mg g−1), qm is the maximum adsorption capacity (mg g−1), k is a Langmuir constant (L mg−1) related to binding energy and affinity toward adsorbate of the sorption system;48 kf is the Freundlich constant ((mg1−n Ln) g−1) related to relative adsorption capacity of the adsorbent;43 n is the Freundlich exponent that indicates the favourability of the adsorption process;41 T is the absolute temperature (K), R is the gas constant, kT (L mg−1) is the equilibrium binding constant related to the maximum binding energy, b (kJ mol−1) is Temkin isotherm constant that relates to the adsorption heat.47
Based on the R2 values shown in Table 4, it is clear that Zn2+ sorption data in this case was better fitted using Freundlich and Temkin models though the value of R2 for HAP/pectin hybrid was not as good as that of the HAP. The reason behind the poorly Freundlich and Temkin fitting of the hybrid was suggested to be related to the possible multiple sorption mechanisms (e.g. ionic exchange, surface complexation with phosphate, dissolution and re-precipitation10) in the system. As is shown in Fig. 6A, a stair-like curve was clearly divided by two different ranges of equilibrium zinc concentrations: stage one with Ce less than 50 mg L; stage two with Ce above 60 mg L−1. Lee et al.44 observed this similar two-stage sorption phenomenon at pH 5.0 using HAP to adsorb Zn2+ and pointed out that a Langmuir type behaviour occurred when the Ce was less than 750 μM (49 mg L−1) while precipitation dominated the adsorption when the Ce exceeded 49 mg L−1. Given these facts, the data of hybrid alone in Fig. 6A was refitted at stage one (Ce ≤ 50 mg L−1) and stage two (Ce ≥ 60 mg L−1) separately and the results were shown in Table 5. It turned out that the Langmuir model fit the data better when Ce was less than 50 mg L−1, which was almost the same as the result reported by Lee et al.44 To further confirm this two-staged isotherm observed in Fig. 6, the HAP/pectin hybrid adsorbents were collected from the 3rd replicate of the isotherm test (Fig. S1†) so that SEM-EDX analysis could be performed and the results are shown in Fig. S2.† The brown color depicts oxygen, green depicts carbon, light blue represents calcium, dark red represents phosphate and dark blue depicts zinc. Compared to the HAP/pectin material exposed to lower zinc concentrations (C0 ≤ 185 mg L−1), the intensity of zinc present in the counterparts exposed to higher concentrations of zinc, show significantly higher presence of zinc as a dark blue, as shown in Fig. S2G–J.† The abrupt zinc color intensity changes seen in the SEM-EDX analysis corresponds with when the zinc concentration increased from 185 mg/to 212 mg L−1, which overlays with the abrupt step observed in Fig. 6. These abrupt color intensity changes observed with SEM-EDX are consistent with the two-stage, step-wise feature observed in Fig. 6, indicating a different zinc removal mechanism may occur when Ce is larger than 60 mg L−1.44
| Ce (mg L−1) | Langmuir | Freundlich | Temkin | ||||||
|---|---|---|---|---|---|---|---|---|---|
| qm (mg g−1) | k (L mg−1) | R2 | n | kf | R2 | b (kJ mol−1) | kT | R2 | |
| 0–50 | 333.3 | 1.5 | 0.94 | 0.047 | 215.1 | 0.74 | 0.219 | 1.6 × 10⁸ | 0.75 |
| >60 | 500.0 | 0.2 | 0.79 | 0.048 | 263.7 | 0.87 | 0.158 | 1.3 × 10⁷ | 0.87 |
3.7. Discussion on sorption mechanism
Mechanisms involved in zinc or other heavy metal sorption process by HAP has been well investigated and fundamental mechanisms consist of dissolution and reprecipitation; ionic exchange; and surface complexation.11,39,44 However, the introduction of large polysaccharide or organic acids molecules into the HAP structure may change the physiochemical properties of HAP (e.g. size, morphology, cytotoxicity15,49,50).Therefore, it is possible that the mechanisms used to explain the heavy metal sorption by HAP may be different than the HAP/pectin hybrid. Equilibrium pH after 48 hours of zinc sorption by HAP and HAP/pectin hybrid is shown in Fig. 7. The decrease in pHe values observed, coupled with the increase of Zn2+ loading on both sorbents, indicate that surface complexation mechanism occurred (eqn (9) and (10)39).
![[triple bond, length as m-dash]](https://www.rsc.org/images/entities/char_e002.gif) POH + Zn2+ ↔ POH + Zn2+ ↔ ![[triple bond, length as m-dash]](https://www.rsc.org/images/entities/char_e002.gif) POZn+ + H+ POZn+ + H+
| (9) |
![[triple bond, length as m-dash]](https://www.rsc.org/images/entities/char_e002.gif) CaOH2+ + Zn2+ ↔ CaOH2+ + Zn2+ ↔ ![[triple bond, length as m-dash]](https://www.rsc.org/images/entities/char_e002.gif) CaOHZn2+ + H+ CaOHZn2+ + H+
| (10) |
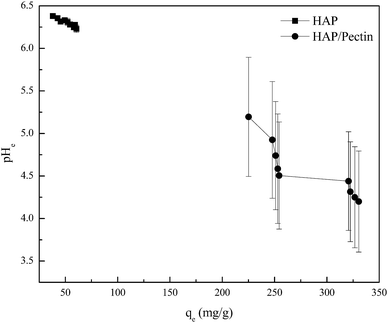 | ||
| Fig. 7 he equilibrium pH (pHe) vs. the corresponding equilibrium zinc sorption capacity (qe). The pHe data was collected simultaneously during the isotherm tests shown in Fig. 6. | ||
For the HAP, the equilibrium pH was around 6 and almost remain constant with only 2.4% decrease as the qe varied from 38.0 mg g−1 to 60.5 mg g−1. It seems that the surface complexation may not play a dominant role for the HAP we used. But it was well reported that HAP has a strong buffer ability at point of zero charge (pHPZC ∼6.0–7.0) in a wide pH range from 4–10,11,51 so the surface complexation induced pH decrease may be offset by HAP's own buffering ability. For the HAP/pectin hybrid, unlike the HAP, the pHe, compared to the initial pH 5.0, dropped to 4.2 at qe = 330.4 mg g−1 (initial Zn2+ concentration was 263 mg L−1), indicating that the buffer balance was broken and a much stronger surface complexation occurred. Theoretically, if surface complexation was the only mechanism behind the zinc sorption by our hybrid, the final pHe would drop to 2.6 based on qe = 330.4 mg g−1, Csorbent = 0.5 g L−1 and stoichiometric ratio between adsorbed Zn2+ and released H+ in eqn (9) and (10). The buffer capacity of the HAP inside the hybrid, other sorption mechanisms as well as the experimental error may be the reason to that difference between the experimental pHe and the theoretical pHe calculated above.
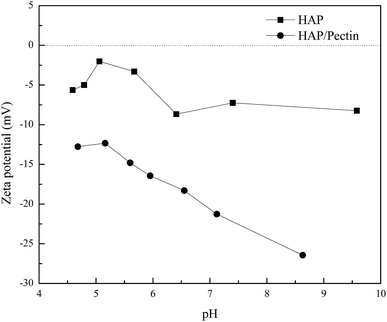
In order to have a further understanding of the sorption mechanism behind, the zeta potential of both sorbents was tested, and the results were exhibited in Fig. 8. The pH ranges from ∼4.5 to ∼6.5 was actually the working pH based on pHe data in Fig. 7 in our study. Therefore, more attention should be focused on the corresponding zeta potential in this pH range. It is clear that the surface of HAP/pectin was more negatively charged than that of the precursor HAP, illustrating the existence of a stronger electrostatic attraction in the sorption process when the hybrid was used. Gong et al.17 used pectin to modify iron oxides nanoparticles and observed similar zeta potential values. The isoelectric point for their materials was around pH 2.50. Unlike their iron oxide nanoparticles, both HAP and HAP/pectin hybrid in this work can not exist if pH is less than 3.0, which may explain the failure of identifying the isoelectric point of our own materials. Furthermore, the enhancement of the negative charge on the surface of the hybrid may come from the enriched oxygen groups of the pectin as reported by Li et al.52
Eqn (11)6,11,39 describes the ion-exchange mechanism for the HAP component of the material:
| xZn2+ + Ca10(PO4)6(OH)2 ↔ xCa2+ + (Znx,Ca10−x)(PO4)6(OH)2 | (11) |
Based on eqn (11), sorption of 1 mole of Zn2+ would lead to 1 mole of Ca2+ release without any pH change. A decrease of calcium inside the HAP/pectin adsorbent can be expected if an increase amount of zinc is sorbed. However, the equilibrium pH values shown in Fig. 7 decreased as the zinc removal capacity increased. Also, we did not observe a continuous decrease of calcium on the surface of HAP/pectin adsorbent when the sorbed zinc increased (see Fig. S3†). Instead, the calcium remained nearly constant when the equilibrium zinc concentration was higher than 40 mg L−1. Moreover, the molar concentration of dissolved Ca2+ detected by AAS was higher than that of sorbed Zn2+ (see Fig. S4†). Given these observations, the ion-exchange mechanism did not occur alone. While the ion exchange mechanism contributes to calcium presence in the solution, some calcium may in part be due to dissolution of the adsorbent. When surface complexation occurs, this may impart lower pH conditions (as seen in Fig. 7), which in turn promotes the dissolution and re-precipitation process of the zinc with the adsorbent, which is described in eqn (12) and (13):39
| Ca10(PO4)6(OH)2 + 14H+ ↔ 10Ca2+ + 6H2PO4− + 2H2O | (12) |
| xZn2+ + 10Ca2+ + 6H2PO4− + 2H2O ↔ (Znx,Ca10−x)(PO4)6(OH)2 + xCa2+ + 14H+ | (13) |
The two-staged isotherm observed in Fig. 6 might be explained in the following way: when the zinc concentration Ce ≥ 60 mg L−1 (the qe > 300 mg g−1), the pH dropped to 4.4–4.2 due to the mechanisms of surface complexation (see Fig. 7, eqn (9) and (10)). This acidic condition subsequently promoted the dissolution and re-precipitation process. This may be the reason why precipitation was suggested to dominate the adsorption in the previous work by Lee et al.44
One paradoxical fact should be noted that the surface area of the HAP/pectin hybrid was 26.4 m2 g−1 by BET method, only 56.7% of its parenting HAP in our work while the zinc sorption capacity of the hybrid was 300.2 mg g−1 (initial Zn2+ was 182.7 mg L−1) or even 330.4 mg g−1 (initial Zn2+ was 263 mg L−1), over 6 times than that of HAP. Saoiabi et al.14,31 also observed a 3.3% or 23.3% decrease of surface area when they use 10% of NTP to modify natural phosphate or HAP to obtain the maximum zinc removal capacity. But they did not explain this paradoxical fact and instead, they tried to illustrate another phenomenon: the pore diameter of their NTP modified HAP decreased from 11 nm to 1.8 nm with the increased level of NTP used (0–10%). They suggested that the high molecular disorder induced by the organic molecules in the apatite network as well as the surface passivation with NTP contributed to that result. In light of their work and the much larger size of pectin molecules we used in our work, it is possible to believe a smaller pore diameter (less than 1.8 nm, even lower than 0.375 nm) may be induced. Accordingly, the diameter of N2 molecule is 3.75 Å (ref. 53) while that of zinc ion is 1.38–1.48 Å.11,21 It would be reasonable to suggest the paradoxical phenomenon of the low surface area HAP/pectin performance is attributed to a pore diameter of our HAP/pectin hybrid less than 0.375 nm but higher than 0.138–0.148 nm. The small pore size induced by pectin will prevent N2 gas molecules from entering the hybrid, leading to a poor BET surface area value while on the other hand allowing Zn2+ sorption inside the pore spaces, leading to a high loading capacity.
4. Conclusions
The synthesis method of flower-like HAP/pectin hybrid sorbent has demonstrated a maximum experimental zinc sorption capacity of 330.4 mg g−1 when 0.5 g L−1 sorbent was used to treat 260 mg L−1 Zn2+ solution at 25 ± 1 °C with an initial pH 5.0. The characterization of the hybrid HAP/pectin possessed brushite, monetite and carbonates. The zinc sorption kinetics are best described as a pseudo second order model. A two-stage isotherm curve was observed, which best fits the results with a Langmuir model fitting best when the equilibrium zinc concentration was less than 50 mg L; otherwise, the Freundlich model fits best at zinc concentrations above 60 mg L−1, illustrating different mechanisms may occur at different concentrations of aqueous zinc. The pH monitoring and the zeta potential test indicate that at least surface complexation, electrostatic attraction were involved in the zinc sorption process.This study demonstrated a simple and low-cost method to convert HAP into a highly effective zinc sorbent. Further investigations will appraise the operation, and recycling of the hybrid adsorbent material.
Conflicts of interest
The authors declare no conflicts of interest within this work.Acknowledgements
The authors would like to thank Dr Adam Redding and Kyle Trewitz from Evoqua Water Technologies LLC for the BET surface area characterization. The authors would like to thank Lehigh University for supporting this work.References
- M. K. Uddin, Chem. Eng. J., 2017, 308, 438–462 CrossRef CAS.
- S. Bolisetty and R. Mezzenga, Nat. Nanotechnol., 2016, 11, 365–371 CrossRef CAS PubMed.
- S. Sarkar, P. K. Chatterjee, L. H. Cumbal and A. K. SenGupta, Chem. Eng. J., 2011, 166, 923–931 CrossRef CAS.
- R. Camarillo, J. Llanos, L. Garcia-Fernandez, A. Perez and P. Canizares, Sep. Purif. Technol., 2010, 70, 320–328 CrossRef CAS.
- F. L. Fu and Q. Wang, J. Environ. Manage., 2011, 92, 407–418 CrossRef CAS PubMed.
- M. Peld, K. Tonsuaadu and V. Bender, Environ. Sci. Technol., 2004, 38, 5626–5631 CrossRef CAS.
- P. Chand and Y. B. Pakade, Environ. Sci. Pollut. Res., 2015, 22, 10919–10929 CrossRef CAS.
- T. A. Salah, A. M. Mohammad, M. A. Hassan and B. E. El-Anadouli, J. Taiwan Inst. Chem. Eng., 2014, 45, 1571–1577 CrossRef CAS.
- J. J. Li, H. Sun, D. Sun, Y. L. Yao, F. L. Yao and K. D. Yao, Carbohydr. Polym., 2011, 85, 885–894 CrossRef CAS.
- R. R. Sheha, J. Colloid Interface Sci., 2007, 310, 18–26 CrossRef CAS.
- Y. P. Xu, F. W. Schwartz and S. J. Traina, Environ. Sci. Technol., 1994, 28, 1472–1480 CrossRef CAS.
- A. Bengtsson, A. Shchukarev, P. Persson and S. Sjoberg, Geochim. Cosmochim. Acta, 2009, 73, 257–267 CrossRef CAS.
- M. S. Fernando, R. M. de Silva and K. M. N. de Silva, Appl. Surf. Sci., 2015, 351, 95–103 CrossRef CAS.
- S. Saoiabi, A. Gouza, H. Bouyarmane, A. Laghzizil and A. Saoiabi, J. Environ. Chem. Eng., 2016, 4, 428–433 CrossRef CAS.
- W. C. Fang, H. Zhang, J. W. Yin, B. G. Yang, Y. B. Zhang, J. J. Li and F. L. Yao, Cryst. Growth Des., 2016, 16, 1247–1255 CrossRef CAS.
- M. Y. Khotimchenko, E. A. Kolenchenko and Y. S. Khotimchenko, J. Colloid Interface Sci., 2008, 323, 216–222 CrossRef CAS.
- J. L. Gong, X. Y. Wang, G. M. Zeng, L. Chen, J. H. Deng, X. R. Zhang and Q. Y. Niu, Chem. Eng. J., 2012, 185, 100–107 CrossRef.
- F. Munarin, P. Petrini, G. Barcellona, T. Roversi, L. Piazza, L. Visai and M. C. Tanzi, Mater. Sci. Eng., C, 2014, 45, 154–161 CrossRef CAS.
- F. Munarin, P. Petrini, R. Gentilini, R. S. Pillai, S. Dire, M. C. Tanzi and V. M. Sglavo, Int. J. Biol. Macromol., 2015, 72, 199–209 CrossRef CAS PubMed.
- D. Gopi, K. Kanimozhi and L. Kavitha, Spectrochim. Acta, Part A, 2015, 141, 135–143 CrossRef CAS.
- Z. Elouear, J. Bouzid, N. Boujelben, M. Feki, F. Jamoussi and A. Montiel, J. Hazard. Mater., 2008, 156, 412–420 CrossRef CAS.
- G. McKay and J. F. Porter, J. Chem. Technol. Biotechnol., 1997, 69, 309–320 CrossRef CAS.
- Z. H. Ding, X. Hu, Y. S. Wan, S. S. Wang and B. Gao, J. Ind. Eng. Chem., 2016, 33, 239–245 CrossRef CAS.
- M. Hua, S. J. Zhang, B. C. Pan, W. M. Zhang, L. Lv and Q. X. Zhang, J. Hazard. Mater., 2012, 211, 317–331 CrossRef.
- A. Alfarra, E. Frackowiak and F. Beguin, Appl. Surf. Sci., 2004, 228, 84–92 CrossRef CAS.
- M. Erdemoglu and M. Sarikaya, J. Colloid Interface Sci., 2006, 300, 795–804 CrossRef CAS.
- I. Smiciklas, A. Onjia, S. Raicevic, D. Janackovic and M. Mitric, J. Hazard. Mater., 2008, 152, 876–884 CrossRef CAS.
- A. Jakobik-Kolon, A. Szybaj, K. Mitko and J. Bok-Badura, Molecules, 2017, 22, 2274 CrossRef.
- A. Jakobik-Kolon, J. Bok-Badura, K. Karon, K. Mitko and A. Milewski, Carbohydr. Polym., 2017, 169, 213–219 CrossRef CAS.
- D. P. Minh, H. Sebei, A. Nzihou and P. Sharrock, Chem. Eng. J., 2012, 198, 180–190 CrossRef.
- S. Saoiabi, S. El Asri, A. Laghzizil, A. Saoiabi, J. L. Ackerman and T. Coradin, Chem. Eng. J., 2012, 211, 233–239 CrossRef.
- C. C. Ribeiro, I. Gibson and M. A. Barbosa, Biomaterials, 2006, 27, 1749–1761 CrossRef CAS.
- Y. Suetsugu, K. Hirota, K. Fujii and J. Tanaka, J. Mater. Sci., 1996, 31, 4541–4544 CrossRef CAS.
- S. Meski, S. Ziani, H. Khireddine, S. Boudboub and S. Zaidi, J. Hazard. Mater., 2011, 186, 1007–1017 CrossRef CAS.
- A. Z. Alshemary, M. Akram, Y. F. Goh, M. R. A. Kadir, A. Abdolahi and R. Hussain, J. Alloys Compd., 2015, 645, 478–486 CrossRef CAS.
- X. D. Kong, F. Z. Cui, X. M. Wang, M. Zhang and W. Zhang, J. Cryst. Growth, 2004, 270, 197–202 CrossRef CAS.
- B. Fu, Q. Shen, W. Qian, Y. Zeng, X. Sun and M. Hannig, J. Mater. Sci.: Mater. Med., 2005, 16, 827–831 CrossRef CAS.
- A. Balaria and S. Schiewer, Sep. Purif. Technol., 2008, 63, 577–581 CrossRef CAS.
- H. Sebei, D. P. Minh, A. Nzihou and P. Sharrock, Appl. Surf. Sci., 2015, 357, 1958–1966 CrossRef CAS.
- B. Alyuz and S. Veli, J. Hazard. Mater., 2009, 167, 482–488 CrossRef.
- Y. B. Yan, Y. P. Wang, X. Y. Sun, J. S. Li, J. Y. Shen, W. Q. Han, X. D. Liu and L. J. Wang, Appl. Surf. Sci., 2014, 317, 946–954 CrossRef CAS.
- Y. S. Ho and G. McKay, Process Saf. Environ. Prot., 1998, 76, 332–340 CrossRef CAS.
- H. Wang, X. Z. Yuan, Y. Wu, H. J. Huang, G. M. Zeng, Y. Liu, X. L. Wang, N. B. Lin and Y. Qi, Appl. Surf. Sci., 2013, 279, 432–440 CrossRef CAS.
- Y. J. Lee, E. J. Elzinga and R. J. Reeder, Environ. Sci. Technol., 2005, 39, 4042–4048 CrossRef CAS PubMed.
- X. B. Chen, J. V. Wright, J. L. Conca and L. M. Peurrung, Environ. Sci. Technol., 1997, 31, 624–631 CrossRef CAS.
- K. Viipsi, S. Sjoberg, K. Tonsuaadu and A. Shchukarev, J. Hazard. Mater., 2013, 252, 91–98 CrossRef PubMed.
- D. Doulia, C. Leodopoulos, K. Gimouhopoulos and F. Rigas, J. Colloid Interface Sci., 2009, 340, 131–141 CrossRef CAS.
- O. Rahmanian, M. Dinari and M. K. Abdolmaleki, Appl. Surf. Sci., 2018, 428, 272–279 CrossRef CAS.
- N. H. de Leeuw and J. A. L. Rabone, CrystEngComm, 2007, 9, 1178–1186 RSC.
- W. P. Feng, G. F. Liang, S. Y. Feng, Y. M. Qi and K. Y. Tang, Int. J. Biol. Macromol., 2015, 74, 218–223 CrossRef CAS.
- I. Smiciklas, A. Onjia and S. Raicevic, Sep. Purif. Technol., 2005, 44, 97–102 CrossRef CAS.
- J. J. Li, D. W. Zhu, J. W. Yin, Y. X. Liu, F. L. Yao and K. D. Yao, Mater. Sci. Eng., C, 2010, 30, 795–803 CrossRef CAS.
- National Physical Laboratory, http://www.kayelaby.npl.co.uk/general_physics/2_2/2_2_4.html, accessed 2017.
Footnote |
| † Electronic supplementary information (ESI) available. See DOI: 10.1039/c9ra03710a |
| This journal is © The Royal Society of Chemistry 2019 |

