 Open Access Article
Preparation of a poly(acrylic acid) based hydrogel with fast adsorption rate and high adsorption capacity for the removal of cationic dyes†
Zhenyu Yuana,
Jie Wang *a,
Yiming Wangb,
Qian Liub,
Yujie Zhonga,
Yu Wanga,
Li Li
 a,
Stephen F. Lincolnc and
Xuhong Guo
 ad
ad
aState Key Laboratory of Chemical Engineering, East China University of Science and Technology, 200237 Shanghai, P. R. China. E-mail: jiewang2010@ecust.edu.cn
bDepartment of Chemical Engineering, Delft University of Technology, 2629 HZ Delft, The Netherlands
cSchool of Physical Sciences, University of Adelaide, Adelaide, SA 5005, Australia
dEngineering Research Center of Materials Chemical Engineering of Xinjiang Bingtuan, Shihezi University, 832000 Xinjiang, P. R. China
First published on 5th July 2019
Abstract
A biocompatible Dex-MA/PAA hydrogel was prepared through copolymerization of glycidyl methacrylate substituted dextran (Dex-MA) with acrylic acid (AA), which was applied as the adsorbent to remove cationic dyes from aqueous solutions. Dex-MA/PAA hydrogel presented a fast adsorption rate and the removal efficiency of Methylene Blue (MB) and Crystal Violet (CV) reached 93.9% and 86.4%, respectively within one minute at an initial concentration of 50 mg L−1. The adsorption equilibrium data fitted the Sips isotherm model well with high adsorption capacities of 1994 mg g−1 for MB and 2390 mg g−1 for CV. Besides, dye adsorption occurred efficiently over the pH range 3–10 and the temperature range 20–60 °C. Moreover, the removal efficiencies for MB and CV were still >95% even after five adsorption/desorption cycles which indicates the robust nature of the Dex-MA/PAA hydrogel and its potential as an eco-friendly adsorbent for water treatment.
1. Introduction
The growing use of dyes in cosmetics, papermaking, medicine and food has caused serious environmental pollution, especially in water sources and aquatic ecosystems.1,2 Most of these dyes are aromatic compounds which exhibit varying degrees of toxicity and are not readily degraded by light, heat, oxidizing agents, and biological agents.3 Consequently, it is necessary to remove these dyes from the polluted water generated during their usage.A series of physicochemical techniques, such as adsorption,4 photocatalytic degradation,5 electro-kinetic coagulation,6 precipitation,7 membrane filtration,8 and flocculation,9 have been developed for the removal of dyes from waste water. Of these methods, adsorption emerges as a superior industrial water treatment method due to the simplicity of design, low cost, stability and reusability of the adsorbents.10,11 In some cases the adsorbent is biodegradable.12
In designing dye adsorbents, we are particularly interested in hydrogels which are three-dimensional hydrophilic polymer networks which absorb large amounts of water.13 These characteristics, in combination with the substitution of appropriate functional groups to give the required adsorbent properties, render hydrogels versatile adsorbents which earlier studies have shown to be readily regenerated for reuse. Thus, substituent hydroxyl and carboxylate groups can selectively interact with cationic dyes or metal ions at appropriate pH values.14
Natural polysaccharides are attractive materials for adsorbent hydrogel construction for water purification because of their ready availability and biodegradability. Chitosan,15 cellulose,16 starch17 and guar gum18 have been widely applied for construction of adsorbents and shows good adsorption properties, such as those combined with amino, carboxyl, cyclodextrin and other inorganic composition. Among various natural polysaccharides, dextran is an important starting material for new functional materials with promising properties.19 Due to its common solubility, biocompatibility, and biodegradability, dextran is already successfully applied in the medical and biomedical field,20–22 however, the applications in adsorbents were seldom reported. Here, we synthesized a hydrogel adsorbent based on dextran. The numerous hydroxyl groups of dextran render it amenable to substitution with other groups according to the requirements of the substituted product. Accordingly, we substituted dextran through reaction with glycidyl methacrylate (GMA) to produce the double bond modified dextran (Dex-MA), which has been used for building hydrogel or micro-gels and recently applied in the area of hemostatic agent and micro carriers.23 Then Dex-MA was copolymerized with acrylic acid (AA) to give the Dex-MA/PAA hydrogel. The carboxylic group can interact with various cationic pollutants, especially the cationic dyes and the regeneration process can be easily realized by changing the solution pH.
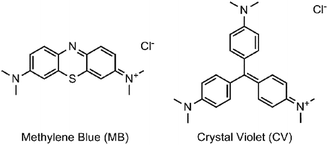
The structure and thermal behavior of Dex-MA/PAA were characterized by 1H NMR, FT-IR, TGA/DTG and SEM. The ability of Dex-MA/PAA to act as an adsorbent for the removal of the cationic dyes, Methylene Blue (MB) and Crystal Violet (CV) (Fig. 1) from aqueous solution was characterized through thermodynamic and kinetic studies. The effects of pH variation and sodium chloride concentration on the dye adsorption process were also determined. Overall, Dex-MA/PAA showed a rapid dye adsorption rate and a high absorption capacity which remained higher than 95% after five-adsorption/desorption-cycles.
2. Materials and methods
2.1 Materials
All chemicals, including dextran with an average molecular weight of 150 kDa, were purchased from Sigma-Aldrich. Aqueous solutions of Methylene Blue and Crystal Violet were prepared using deionized water. The pH of the solutions was adjusted with 0.1 M sodium hydroxide and 0.1 M hydrochloric acid.2.2 Synthesis of glycidyl methacrylate modified dextran (Dex-MA)
The preparation of Dex-MA followed literature methods.24,25 Dextran (10.0 g, 0.067 mmol) was dissolved in DMSO (90 mL) with stirring after which 4-dimethylaminopyridine (DMAP) (2.0 g, 16.37 mmol) and glycidyl methacrylate (GMA) (1.58 g, 11.11 mmol) were added and stirring was continued at room temperature for 24 h. The resulting viscous solution was transferred into a dialysis tube (molecular weight cut off = 8000–12![[thin space (1/6-em)]](https://www.rsc.org/images/entities/char_2009.gif) 000 Da) and dialyzed against deionized water for two days to remove DMSO and unreacted material. The resulting aqueous solution was lyophilized to obtain a white product. The 400 MHz 1H NMR spectrum of a D2O solution exhibited resonances at 6.25, 5.80 (2H, CH2
000 Da) and dialyzed against deionized water for two days to remove DMSO and unreacted material. The resulting aqueous solution was lyophilized to obtain a white product. The 400 MHz 1H NMR spectrum of a D2O solution exhibited resonances at 6.25, 5.80 (2H, CH2![[double bond, length as m-dash]](https://www.rsc.org/images/entities/char_e001.gif) C), 5.35, 5.01 (anomeric proton), 1.99 (3H, –CH3) δ, ppm.
C), 5.35, 5.01 (anomeric proton), 1.99 (3H, –CH3) δ, ppm.
2.3 Synthesis of the Dex-MA/PAA hydrogel
To prepare the Dex-MA/PAA hydrogel, 0.5 g Dex-MA and 2 g AA were dissolved in 20 mL phosphate buffer (0.01 M, pH 8.0) followed by the addition of 10 mg of ammonium peroxydisulfate (APS) as initiator. This mixture was reacted at 70 °C under nitrogen for 2 h to form the Dex-MA/PAA hydrogel which was then cooled to room temperature and rinsed with deionized water to remove unreacted monomers and other impurities. Then the Dex-MA/PAA hydrogel were immersed in 0.1 M sodium hydroxide followed by washing with a large amount of water. Finally, the hydrogel was freeze dried, ground and stored at room temperature in a dry environment.2.4 Characterization
1H NMR spectra were obtained in D2O solutions using a Bruker Avance DRX-400 at room temperature. Fourier transform infrared (FT-IR) spectra were obtained from KBr pellets on a NICOLET 6700 spectrometer in transmittance mode in the range 400–4000 cm−1. The network morphology of the hydrogel was observed using a SEM-JEOL6010LA scanning electron microscope. Thermogravimetric analysis (TGA) and derivative thermogravimetric analysis (DTG) were conducted on a Mettler Toledo TGA/SDTA851 instrument in the temperature range 20 to 1000 °C with a ramp of 10 °C min−1 under a N2 flow (100 mL min−1).2.5 Swelling study
To measure the hydrogel swelling ratio, 100 mg of freeze-dried Dex-MA/PAA hydrogel was immersed in 200 mL deionized water. After the swelling hydrogel reached equilibrium, it was removed from the deionized water, residual surface water was removed and it was weighed. The swelling ratio (SR) was calculated through eqn (1):
 | (1) |
2.6 Determination of active carboxyl group content
The active carboxyl group content of the Dex-MA/PAA hydrogel was determined by titration.26,27 A 40 mg sample of the hydrogel was added to 200 mL hydrochloric acid (10 mM) and stirred overnight to convert the sodium salt to the carboxylic acid form. After filtering, 50 mL of the filtrate was titrated with sodium hydroxide (5 mM). The titration was carried out in triplicate. The Dex-MA/PAA hydrogel carboxyl group content, C (mmol g−1), was calculated through eqn (2):
 | (2) |
2.7 Determination of pH at the point of zero charge for Dex-MA/PAA (pHPZC)
The pH at which Dex-MA/PAA was uncharged, the point of zero charge, pHPZC, was determined by the pH-drift method.28 Nitrogen was bubbled through 50 mL of each of nine sodium chloride solutions (10 mM) at room temperature for several minutes to expel dissolved CO2. The pH of the solutions was adjusted to nine different initial values (pHinitial) in the range 2.0–10 with 0.1 M hydrochloric acid or 0.1 M sodium hydroxide. Subsequently, 50 mg of Dex-MA/PAA was added to each solution which was stirred for 4 hours at 250 rpm. The solutions were then filtered and the final pH (pHfinal) of each filtrate was measured and the pHfinal–pHinitial values were plotted against pHinitial of the solutions. The pHPZC (6.6 for Dex-MA/PAA) was the point at which the value of pHfinal–pHinitial is zero.2.8 Dye adsorption experiments
All dye adsorption experiments were initiated by adding 20 mg of Dex-MA/PAA to 20 mL dye solutions at a selected pHinitial followed by stirring at 200 rpm for 3 h. The mixture was then filtered and the residual dye content was determined by UV-vis absorption at 664 nm for MB and 590 nm for CV using a UV-1800, SHIMADZU spectrophotometer.The influence of the variation of pH (2–10), salt concentration (0–400 mM), temperature (20–60 °C) and contact time (0–60 min) on the adsorption of MB and CV were investigated at an initial dye concentration of 50 mg mL−1. The pH of each dye solution was adjusted with either 0.1 M hydrochloric acid or 0.1 M sodium hydroxide. The salt concentration was adjusted by adding sodium chloride into the dye solution. The influence of initial dye concentrations (MB 20–2200 mg L−1, CV 50–2600 mg mL−1) on adsorption was studied at 20 °C and pH 8.0. In kinetic studies, the mixture was immediately stirred and 3 mL of suspension were taken at specific intervals via syringe and filtrated immediately by a 1 μm filter. All experiments were performed in triplicate. The dye removal efficiency (R%) was calculated through eqn (3):
 | (3) |
The adsorption capacity (qe, mg g−1) of Dex-MA/PAA was calculated through eqn (4):
 | (4) |
2.9 Regeneration tests
A sample of 40 mg of dry Dex-MA/PAA was added to 40 mL of MB or CV solution (50 mg L−1) at an initial of pH 8.0, and the mixture was stirred for 3 h at 20 °C to obtain dye saturation of the hydrogel. Then, Dex-MA/PAA was separated from the mixture and immersed in 50 mL hydrochloric acid (0.1 M) for 3 h to release the adsorbed dyes. The separated Dex-MA/PAA was washed with deionized water and the adsorption sites were reactivated by soaking in 50 mL of 0.1 M sodium hydroxide for 1 hour. It was then separated again, washed with deionized water and freeze dried before repeating the above described dye adsorption experiment. This adsorption/desorption cycle was repeated five times for each dye.3. Results and discussion
3.1 Characterization of Dex-MA and the Dex-MA/PAA hydrogel
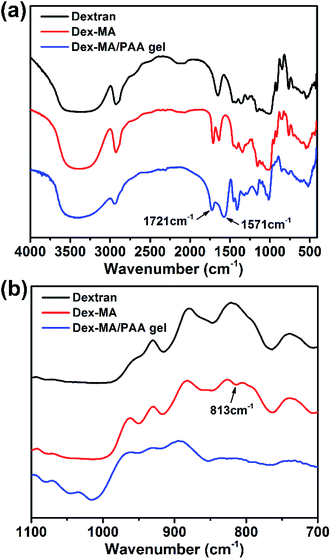
The preparations of Dex-MA and Dex-MA/PAA hydrogel are shown in Scheme 1. The chemical structure of Dex-MA was confirmed by FT-IR and the degree of substitution (DS) of the methacrylate group on dextran was calculated to be 10.5% from its 1H NMR spectrum (Fig. S1†).29 The FT-IR spectra of dextran, Dex-MA and Dex-MA/PAA hydrogel in Fig. 2 show the progressive changes as the synthesis proceeded. After soaking the Dex-MA/PAA hydrogel in sodium hydroxide solution, the peak at 1571 cm−1 arising from the deprotonation of the Dex-MA/PAA acrylic acid groups appeared together with that from methacrylate (from the Dex-MA (C![[double bond, length as m-dash]](https://www.rsc.org/images/entities/char_e001.gif) O) component) at 1721 cm−1 in Fig. 2a.30 The double bond peak at 813 cm−1 in the Dex-MA spectrum was absent from the Dex-MA/PAA spectrum after copolymerization with acrylic acid to give the hydrogel. The effect of degree of substitution and AA content were studied before systematically studying the adsorption properties of hydrogels, which was shown in Fig. S3 and S4.†
O) component) at 1721 cm−1 in Fig. 2a.30 The double bond peak at 813 cm−1 in the Dex-MA spectrum was absent from the Dex-MA/PAA spectrum after copolymerization with acrylic acid to give the hydrogel. The effect of degree of substitution and AA content were studied before systematically studying the adsorption properties of hydrogels, which was shown in Fig. S3 and S4.†
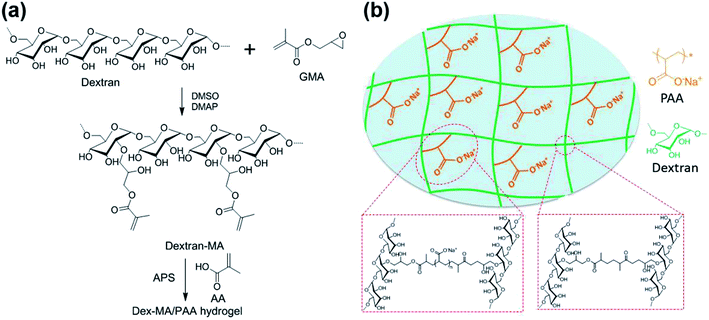 | ||
| Scheme 1 (a) Synthesis of Dex-MA and Dex-MA/PAA hydrogel and (b) the structure of Dex-MA/PAA hydrogel in sodium salt form. | ||
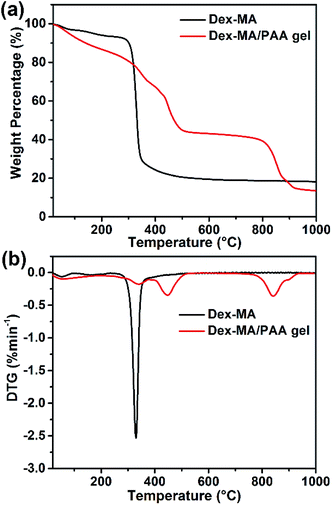
The thermostabilities of Dex-MA and Dex-MA/PAA were analyzed by TGA/DTG. As shown in Fig. 3a, the loss of bonded water in Dex-MA leads to a very small weight loss at ∼100 °C. When the temperature was increased to ∼300 °C, Dex-MA began to decompose, leading to 72% loss of weight when the temperature increased to 450 °C. For the Dex-MA/PAA hydrogel, multiple thermal decomposition regions were observed. The initial weight loss (about 10.1%) below 160 °C was ascribed to water loss. The second weight loss of 21.5% occurred between 160 °C and 380 °C and was attributed to anhydride formation by PAA chains and the decomposition of the Dex-MA components. The third weight loss of 25.8% occurred between 380 °C and 554 °C and was assigned to thermal degradation of the polyacrylic anhydride. The final weight loss of 29.24% occurred as the residual Dex-MA/PAA hydrogel decomposed above 720 °C.4 The weight losses are clearly seen in the DTG curves in Fig. 3b.
The SEM images of the Dex-MA/PAA hydrogel showed a three-dimensional network with large pore sizes in the range of 100–1000 μm as seen in Fig. 4a. In aqueous solution, these large pore sizes facilitate the exchange of water between the interior and exterior of the hydrogel.
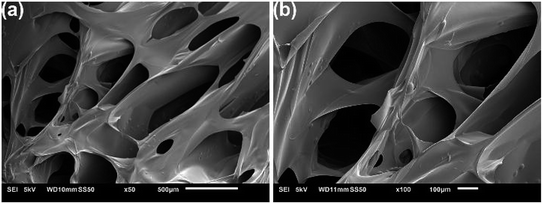 | ||
| Fig. 4 SEM images of the fracture surface of the freeze-dried Dex-MA/PAA hydrogel at two magnifications. | ||
3.2 Effect of pH on dye adsorption
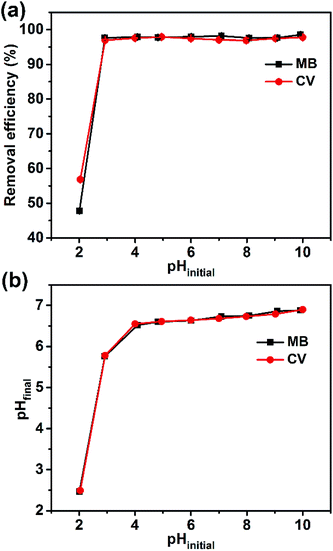
The active carboxyl group content of the Dex-MA/PAA hydrogel adsorbent was found to be 6.21 mmol g−1 and the mass ratio between Dex-MA and PAA was calculated to be 1.23. Given this high carboxyl group content, the pH of the solution is one of the most significant factors affecting the surface charge of the Dex-MA/PAA hydrogel.27 So, the pH at which an adsorbent has zero charge (pHPZC) is an important parameter as it effectively predicts the surface charge at different pH values. The pHPZC for the Dex-MA/PAA hydrogel adsorbent was determined to be 6.6, as shown in Fig. S2.† All of the Dex-MA/PAA carboxyl groups were protonated at pH < 6.6 but become increasingly deprotonated at pH > 6.6 such that the adsorbent surface is increasingly negatively charged as required for the adsorption of cationic dyes.31,32The variation of the dye removal efficiency of the Dex-MA/PAA hydrogel adsorbent at pHinitial ranging from 2 to 10 for MB and CV is shown in Fig. 5a. At pHinitial 2.0 the removal efficiency for MB and CV were 47.8% and 56.9%, respectively. When the pHinitial slightly increased to 3.0, the removal efficiency for both dyes were higher than 96%. However, further increases in pHinitial to 10.0 produced no additional increase in the removal efficiency for the dyes. Overall, these data show that the Dex-MA/PAA hydrogel adsorbs MB and CV particularly effectively over the pHinitial range of 3–10 due to its strong buffer ability.
This dye adsorption pattern coincided with changes from pHinitial to pHfinal, after adding the Dex-MA/PAA hydrogel to the dye solutions as a consequence of variations in the extent of protonation of the carboxylate groups. Thus, there was a larger increase of pHfinial from pHinitial = 3 to 4, lesser increases from pHinitial = 4 to 10 (Fig. 5b). These changes are a consequence of buffering by the Dex-MA/PAA hydrogel centered on pHPZC = 6.6. The adsorption of MB and CV in solutions with pHfinal < pHPZC in particular indicates that both dyes strongly compete with protons for electrostatic interaction with Dex-MA/PAA carboxylate groups.
3.3 Effect of NaCl concentration on dye adsorption
The differing effects of NaCl concentration on the absorption of Dex-MA/PAA hydrogel for MB and CV are shown Fig. 6. The removal efficiency of MB changed from >97% to 4.3% when sodium chloride concentration was increased from 0 to 400 mM, and that of CV changed from >97% to 43.9%. This is consistent with Na+ competitively interacting with the Dex-MA/PAA carboxylate groups to produce a screening effect which decreases cationic dye adsorption as found in other studies.33,34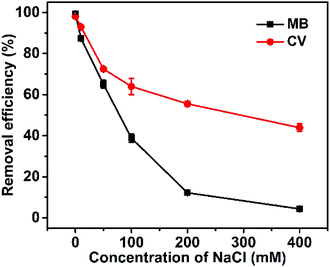 | ||
| Fig. 6 Effect of NaCl concentration on removal efficiency of Dex-MA/PAA hydrogel (Dex-MA/PAA hydrogel dose: 1 g L−1, dye concentration: 50 mg L−1, contact time: 3 h, initial pH 8.0). | ||
3.4 Effect of temperature on dye adsorption
The adsorption of the dyes onto the Dex-MA/PAA hydrogel decreased slightly with increase in temperature from 293 K to 333 K as shown by the decreases of 1.3% and 2.2% in the removal efficiency for MB and CD, respectively, in Fig. 7. A similarly small absorption decrease has been reported for MB adsorption on other adsorbents.15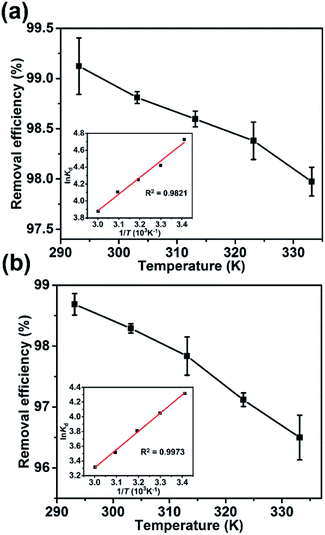 | ||
| Fig. 7 The effect of temperature on the removal efficiency: (a) MB and (b) CV (inset: Van't Hoff plots for the adsorption of MB and CV on Dex-MA/PAA). | ||
The free energy change, enthalpy change and entropy change for dye adsorption, ΔG0, ΔH0 and ΔS0, were determined through the following equations:
 | (5) |
ΔG0 = −RT![[thin space (1/6-em)]](https://www.rsc.org/images/entities/char_2009.gif) ln ln![[thin space (1/6-em)]](https://www.rsc.org/images/entities/char_2009.gif) Kd Kd
| (6) |
| ΔG0 = ΔH0 − TΔS0 | (7) |
 | (8) |
![[thin space (1/6-em)]](https://www.rsc.org/images/entities/char_2009.gif) Kd against 1/T shown as insets in Fig. 7 and the ΔH0 and ΔS0 were calculated from the slope (−ΔH0/R) and intercept (ΔS0/R). The derived thermodynamic parameters appear in Table 1. For both dyes ΔG0 becomes less negative with increase in temperature consistent with the corresponding decrease in removal efficiency and dye adsorption was a spontaneous process.4,27 The negative ΔH0 for adsorption indicated that the dye adsorption process was exothermic, while the negative ΔS0 were indicated the decreased randomness at the solid/liquid interface in the adsorption process.35,36
Kd against 1/T shown as insets in Fig. 7 and the ΔH0 and ΔS0 were calculated from the slope (−ΔH0/R) and intercept (ΔS0/R). The derived thermodynamic parameters appear in Table 1. For both dyes ΔG0 becomes less negative with increase in temperature consistent with the corresponding decrease in removal efficiency and dye adsorption was a spontaneous process.4,27 The negative ΔH0 for adsorption indicated that the dye adsorption process was exothermic, while the negative ΔS0 were indicated the decreased randomness at the solid/liquid interface in the adsorption process.35,36
| Parameters | ΔG0 (kJ mol−1) of dyes | |
|---|---|---|
| T (K) | MB | CV |
| 293 | −11.52 | −10.52 |
| 303 | −11.14 | −10.21 |
| 313 | −11.07 | −9.92 |
| 323 | −11.03 | −9.45 |
| 333 | −10.74 | −9.19 |
| ΔH0 (kJ mol−1) | −16.38 | −20.61 |
| ΔS0 (J mol−1 K−1) | −16.84 | −34.34 |
Response surface methodology was also applied for optimization of dyes, and pH (A), salt concentration (B) and temperature (C) were selected as three factors. The results of variance analyses were shown in Table S3 and S4.† According to p value, the A, B, AB, B2 were significant for removal efficiency of MB, and A, B, AB, A2, B2 were significant for removal efficiency of CV, which were also confirmed by F value.
3.5 Adsorption kinetics
The adsorption kinetics were characterized by monitored the amount of dye adsorbed against time. Within the first minute the removal efficiencies of MB and CV have reached 93.9% and 86.4%, respectively (Fig. 8). Thereafter, the removal efficiency of MB and CV leveled off at ∼98% within ∼5 min and ∼15 min, respectively, as is seen qualitatively for MB and CV solutions before and after adsorption by Dex-MA/PAA in Fig. S6.† This rapid adsorption process is ascribed to the large pore size of the hydrogel networks and their multiple carboxylate groups, indicating the potential usefulness of the Dex-MA/PAA hydrogel as an adsorbent in wastewater treatment.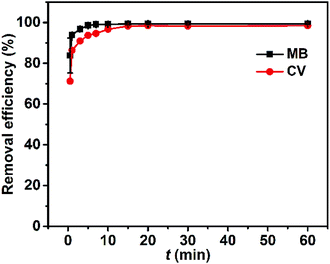 | ||
| Fig. 8 Effect of contact time, t, on the dye removal efficiency. Hydrogel adsorbent dose: 1 g L−1, dye concentration: 50 mg L−1, pHinitial 8.0. | ||
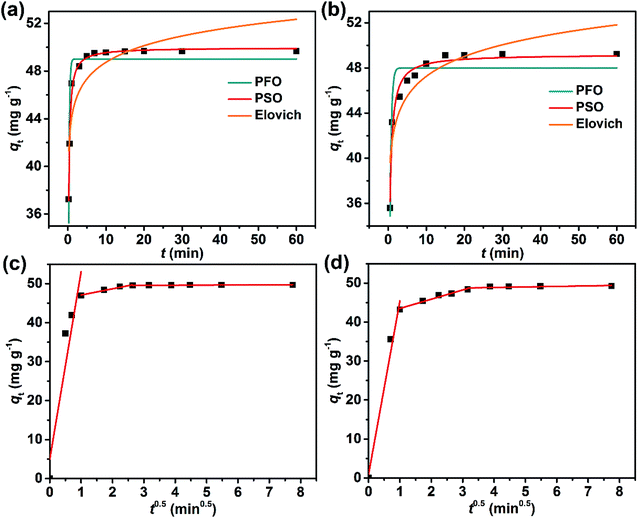
Generally, the dye adsorption processes are considered to occur in three steps: (1) bulk diffusion of the dye from solution to the adsorbent surface; (2) intra-particle diffusion and electrostatic interactions between the dye and the adsorbent; and (3) the equilibrium state wherein the dye exchanges on and off adsorption sites.26,37 To determine the nature of the kinetics of adsorption, the experimental qt data were fitted to a pseudo-first order (PFO),38 a pseudo-second order (PSO),39 and the Elovich kinetic model,40,41 and then to the intra-particle diffusion model (Fig. 9).28,42
For the PFO kinetic model:
| qt = qe(1 − e−k1t) | (9) |
For the PSO kinetic model:
 | (10) |
The Elovich kinetic model:
 | (11) |
The intra-particle diffusion model:
| qt = kdit0.5 + Ci | (12) |
The best fits of the four kinetic models to the experimental data are shown in Fig. 9 and the derived kinetic parameters and determination coefficients (R2) appear in Table 2. It is seen from Fig. 9a and b that the PSO kinetic model best fits experimental data, which is consistent with the high R2 values and the theoretical adsorption capacities (qe(cal)) calculated from the PSO model being comparable to the experimental values (qe(exp)) (Table 2). This implies that the adsorption rate is controlled by chemisorption due to electron sharing or exchange between the dyes and the Dex-MA/PAA hydrogel.40,43,44
| Parameter | Adsorbing dye | ||
|---|---|---|---|
| MB | CV | ||
| Pseudo-first order | qe(cal) | 49.0 | 48.0 |
| k1 | 5.08 | 2.60 | |
| R2 | 0.8664 | 0.8912 | |
| Pseudo-second order | qe(cal) | 49.9 | 49.2 |
| k2 | 0.23 | 0.11 | |
| R2 | 0.9896 | 0.9666 | |
| Elovich | α(×109) | 6.63 | 0.03 |
| β | 0.50 | 0.40 | |
| R2 | 0.6997 | 0.7716 | |
![[thin space (1/6-em)]](https://www.rsc.org/images/entities/char_2009.gif) |
|||
| Intra-particle diffusion | |||
| Stage 1 | kd1 | 48.2 | 44.5 |
| C1 | 4.95 | 0.93 | |
| R2 | 0.8491 | 0.9698 | |
| Stage 2 | kd2 | 1.60 | 2.37 |
| C2 | 45.5 | 41.1 | |
| R2 | 0.9528 | 0.9661 | |
| Stage 3 | kd3 | 0.028 | 0.032 |
| C3 | 49.5 | 49.0 | |
| R2 | 0.5653 | 0.7519 | |
The fitting plots for the intra-particle diffusion model for the adsorption of MB and CV were displayed in Fig. 9c and d. The experimental data for MB and CV adsorption separate into three linear regions indicative of a three-stage adsorption process. It is seen from Table 2 that the diffusion rate constants for MB and CV for each step follows the order of: kd1 > kd2 > kd3, while the intercept C follows the order of: C1 < C2 < C3 and provides the information about the thickness of the boundary layer or resistance to diffusion45 The first stage had the highest diffusion constant, kd1, and lowest intercept, C1, consistent with rapid diffusion of the dye from the bulk solution to the Dex-MA/PAA hydrogel surface. In the second stage, adsorption slows as the dye diffuses less rapidly into the pores of the hydrogel (intra-particle diffusion) where it adsorbs through electrostatic interactions. With increasing dye adsorption onto the hydrogel surface, dye adsorption slows further as equilibrium is reached and dye adsorption and desorption reach a kinetic balance in the third stage. Consequently, kd3 decreases while C3 increases. All these observations are consistent with the MB and CV adsorption processes occurring in three stages and being partially controlled by intra-particle diffusion.37,45 The adsorption kinetics at 100 mg mL−1 of dyes were also confirmed and showed similar results (Fig. S7, S8 and Table S5†).
3.6 Dye adsorption isotherms for Dex-MA/PAA
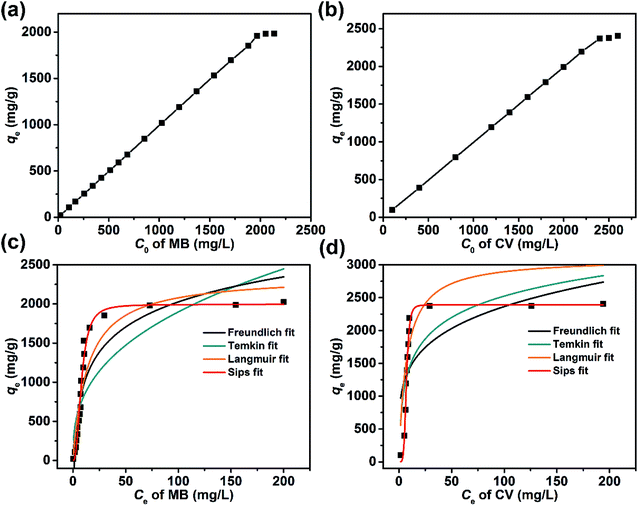
The character of the dye adsorption isotherms for the Dex-MA/PAA hydrogel was determined from the equilibrium qe and Ce at different initial concentration of dyes. The variations of qe with Ci for MB and CV are shown in Fig. 10a and b, respectively. In both cases qe increased linearly for most of the Ci range before reaching a plateau at 1800 mg L−1 for MB and 2300 mg L−1 for CV consistent with saturation of the Dex-MA/PAA carboxylate sites. The qe at saturation were 1984 mg g−1 for MB and 2405 mg g−1 for CV.These adsorption data were fitted to four adsorption isotherm models expressed as follows:
The Freundlich isotherm model:
 | (13) |
The Temkin isotherm model:
 | (14) |
The Langmuir isotherm model:
 | (15) |
The Sips isotherm model:
 | (16) |
The isotherm parameters calculated through fitting the adsorption data to the four models appear in Table 3, and the best-fit curves for MB and CV adsorption appear in Fig. 10c and d respectively. On the basis of the R2 values, the experimental data were best-fitted by the Sips isotherm model. The maximum adsorption capacity qm(cal) of MB (1994 mg g−1, 6.23 mmol) and CV (2390 mg g−1, 5.86 mmol) calculated through the Sips isotherm model are similar to the experimental maximum adsorption capacities qm(exp) (Table 3). The calculated kS of MB (0.12 L mg−1) was less than that of CV (0.19 L mg−1), indicating that CV has a higher affinity for adsorption by the Dex-MA/PAA hydrogel than MB. The heterogeneity factor, nS for both MB (0.40) and CV (0.14) are both significantly less than unity indicating that their adsorption processes are only moderately heterogeneous in nature.47
| Isotherm | Parameters | Adsorbing dye | |
|---|---|---|---|
| MB | CV | ||
| qe(exp) (mg g−1) | 1984 | 2405 | |
| Freundlich | kF | 350 | 856 |
| nF | 2.72 | 4.53 | |
| R2 | 0.6992 | 0.4734 | |
| Temkin | kT | 0.80 | 2.13 |
| bT | 5.27 | 5.18 | |
| R2 | 0.8415 | 0.5915 | |
| Langmuir | qm(max) | 2364 | 3380 |
| kL | 0.073 | 0.10 | |
| R2 | 0.8838 | 0.5730 | |
| Sips | qm(max) | 1994 | 2390 |
| kS | 0.12 | 0.19 | |
| nS | 0.40 | 0.14 | |
| R2 | 0.9861 | 0.9838 | |
3.7 Comparison with other polysaccharide based adsorbents
The maximum adsorption capacities of Dex-MA/PAA hydrogel adsorbent for MB and CV are compared with other polysaccharide based adsorbents in Table 4. On the basis of the qm data it is seen that the Dex-MA/PAA hydrogel possessed a relative high adsorption capacity for MB and an even higher one for CV by comparison with other adsorbents. These results indicated that the Dex-MA/PAA hydrogel can be recognized as a promising adsorbent for removing the cationic dyes.| Dye | Adsorbent | qm(cal) (mg g−1) | Reference |
|---|---|---|---|
| MB | Chitosan-g-poly(acrylic acid)/rice husk ash | 1841 | 15 |
| Polyacrylic acid-grafted quaternized cellulose | 1735 | 16 | |
| Gum ghatti-g-poly(acrylic acid) | 909 | 18 | |
| Salecan-g-(acrylamide-co-itaconic acid) | 107 | 49 | |
| Starch-g-poly(acrylic acid) | 1532 | 17 | |
| Dex-MA/PAA hydrogel | 1994 | This study | |
| CV | Triphenylene-modified chitosan | 2283 | 50 |
| Oxidized cellulose | 1118 | 51 | |
| Xanthan gum-g-poly(N-vinyl imidazole) | 453 | 14 | |
| Alginate/acid activated bentonite beads | 582 | 52 | |
| Starch-derived carbon aerogels | 1515 | 53 | |
| Dex-MA/PAA hydrogel | 2390 | This study |
The performance of Dex-MA/PAA hydrogel in the presence of both cationic dyes were also measured (MB 50 mg L−1, CV 50 mg L−1). The results showed that both removal efficiency of MB and CV were higher than 98% due to the high adsorption capacity of Dex-MA/PAA hydrogel (Fig. S9†). Besides, humic acid is one of the natural organic matter (NOM) existing in the river and soil. Several studies have shown that the presence of humic acid can significant affect the adsorption of organic pollutant from their aqueous solutions, and the pollutants will gradually accumulate in the river and soil.47,48 Here, humic acid was mixed with MB and CV and the removal efficiency was investigated under Dex-MA/PAA hydrogel. As shown in Fig. S10,† the removal efficiency of MB and CV were nearly invariant even at 50 mg L−1 of humic acid, and the Dex-MA/PAA hydrogel presented strong adsorption ability to MB and CV. This was probably because the humic acid could not compete with MB and CV onto adsorption sites. Meanwhile, the pH of the solution was stable due to the excellent buffer ability, which decrease the influence of humic acid.
3.8 Dye desorption and reuse studies
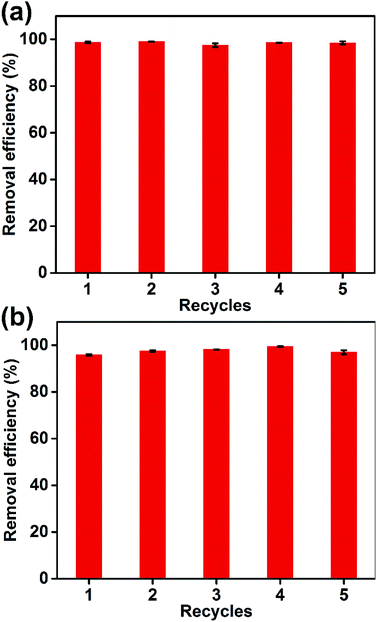
The regeneration of an adsorbent is crucial for its practical applications. As shown in Fig. 11, five adsorption/desorption cycles were performed with the Dex-MA/PAA hydrogel to evaluate its reusability. The removal efficiencies for MB and CV were >95% and showed very small variations over the five cycles, demonstrating the excellent recycling performance and stability of the Dex-MA/PAA hydrogel.4. Conclusions
In this study, the Dex-MA/PAA hydrogel adsorbent was prepared by using glycidyl methacrylate modified dextran (Dex-MA) as the biocompatible cross-linker and acrylic acid as the functional group. Dex-MA/PAA hydrogel presented high removal efficiency on Methylene Blue (MB) and Crystal Violet (CV) over a wide range of pH (3–10) due to the strong buffer ability. The adsorbent presented fast adsorption rate with short equilibrium for MB (5 min) and CV (15 min). Besides, the equilibrium data were well simulated by Sips model, and the calculated maximum adsorption capacity was 1994 mg g−1 for MB and 2390 mg g−1 for CV, which were higher than other polysaccharides based adsorbents. Moreover, the adsorbents were regenerated and reused for 5 times without a significant efficiency loss. These data show that the Dex-MA/PAA hydrogel is a promising candidate for a use as an efficient adsorbent in water treatment.Conflicts of interest
There are no conflicts to declare.Acknowledgements
This work was supported by the NSFC Grants (51761135128, 51403062, and 51773061) and Key Scientific and Technological Project of Xinjiang Bingtuan (2018AB025), China Scholarship Council (CSC).References
- T. Ngulube, J. R. Gumbo, V. Masindi and A. Maity, J. Environ. Manage., 2017, 191, 35–57 CrossRef CAS.
- W. S. W. Ngah, L. C. Teong and M. Hanafiah, Carbohydr. Polym., 2011, 83, 1446–1456 CrossRef.
- A. Kausar, M. Iqbal, A. Javed, K. Aftab, Z. I. H. Nazli, H. N. Bhatti and S. Nouren, J. Mol. Liq., 2018, 256, 395–407 CrossRef CAS.
- Y. Chen, F. He, Y. Ren, H. Peng and K. Huang, Chem. Eng. J., 2014, 249, 79–92 CrossRef CAS.
- Y. Zhang, Z.-R. Tang, X. Fu and Y.-J. Xu, ACS Nano, 2010, 4, 7303–7314 CrossRef CAS.
- H. Sarkka, A. Bhatnagar and M. Sillanpaa, J. Electroanal. Chem., 2015, 754, 46–56 CrossRef CAS.
- M. Ali, A. Sarkar, M. D. Pandey and S. Pandey, Anal. Sci., 2006, 22, 1051–1053 CrossRef CAS.
- Y. Han, Z. Xu and C. Gao, Adv. Funct. Mater., 2013, 23, 3693–3700 CrossRef CAS.
- A. K. Verma, R. R. Dash and P. Bhunia, J. Environ. Manage., 2012, 93, 154–168 CrossRef CAS.
- M. A. M. Salleh, D. K. Mahmoud, W. Karim and A. Idris, Desalination, 2011, 280, 1–13 CrossRef CAS.
- T. I. Tikhomirova, G. R. Ramazanova and V. V. Apyari, J. Anal. Chem., 2017, 72, 917–934 CrossRef CAS.
- M. T. Yagub, T. K. Sen, S. Afroze and H. M. Ang, Adv. Colloid Interface Sci., 2014, 209, 172–184 CrossRef CAS PubMed.
- Y. M. Wang, J. Wang, Z. Y. Yuan, H. Y. Han, T. Li, L. Li and X. H. Guo, Colloids Surf., B, 2017, 152, 252–259 CrossRef CAS.
- R. R. Mohamed, M. H. Abu Elella, M. W. Sabaa and G. R. Saad, Cellulose, 2018, 25, 6513–6529 CrossRef CAS.
- M. G. Vaz, A. G. B. Pereira, A. R. Fajardo, A. C. N. Azevedo and F. H. A. Rodrigues, Water, Air, Soil Pollut., 2017, 228, 1–14 CrossRef CAS.
- Y. Wang, C. Zhang, L. Zhao, G. Meng, J. Wu and Z. Liu, Fibers Polym., 2017, 18, 891–899 CrossRef CAS.
- X. W. Liu and Q. Y. Wei, RSC Adv., 2016, 6, 79853–79858 RSC.
- E. Fosso-Kankeu, H. Mittal, S. B. Mishra and A. K. Mishra, J. Ind. Eng. Chem., 2015, 22, 171–178 CrossRef CAS.
- M. Naessens, A. Cerdobbel, W. Soetaert and E. J. Vandamme, J. Chem. Technol. Biotechnol., 2005, 80, 845–860 CrossRef CAS.
- E. Cho, M. N. Tahir, J. M. Choi, H. Kim, J.-H. Yu and S. Jung, Carbohydr. Polym., 2015, 133, 221–228 CrossRef CAS.
- C. Demirbilek and C. O. Dinc, Carbohydr. Polym., 2012, 90, 1159–1167 CrossRef CAS.
- E. Cho, M. N. Tahir, H. Kim, J.-H. Yu and S. Jung, RSC Adv., 2015, 5, 34327–34334 RSC.
- Q. Liu, M. Zhao, S. Mytnyk, B. Klemm, K. Zhang, Y. Wang, D. Yan, E. Mendes and J. H. van Esch, Angew. Chem., Int. Ed., 2019, 58, 547–551 CrossRef CAS.
- H. C. Chiu, Y. F. Lin and Y. H. Hsu, Biomaterials, 2002, 23, 1103–1112 CrossRef CAS.
- A. Abbadessa, M. M. Blokzijl, V. H. M. Mouser, P. Marica, J. Malda, W. E. Hennink and T. Vermonden, Carbohydr. Polym., 2016, 149, 163–174 CrossRef CAS.
- Y. Zhou, M. Zhang, X. Hu, X. Wang, J. Niu and T. Ma, J. Chem. Eng. Data, 2013, 58, 413–421 CrossRef CAS.
- F. Zhao, E. Repo, D. Yin, Y. Meng, S. Jafari and M. Sillanpää, Environ. Sci. Technol., 2015, 49, 10570–10580 CrossRef CAS.
- J. Ma, G. Zhou, L. Chu, Y. Liu, C. Liu, S. Luo and Y. Wei, ACS Sustainable Chem. Eng., 2017, 5, 843–851 CrossRef CAS.
- W. N. E. van Dijk-Wolthuis, O. Franssen, H. Talsma, M. J. van Steenbergen, J. J. Kettenes-van den Bosch and W. E. Hennink, Macromolecules, 1995, 28, 6317–6322 CrossRef CAS.
- C. J. Yan, T. H. Yang, S. K. Zhu and H. Wu, J. Mater. Chem. B, 2017, 5, 3697–3705 RSC.
- S. Chowdhury and P. Das, Environ. Prog. Sustainable Energy, 2012, 31, 415–425 CrossRef CAS.
- S. Y. Wang, K. M. Chen, Y. S. Xu, X. J. Yu, W. H. Wang, L. Li and X. H. Guo, Soft Matter, 2013, 9, 11276–11287 RSC.
- H. Mittal, A. Maity and S. S. Ray, Chem. Eng. J., 2015, 279, 166–179 CrossRef CAS.
- W. Wang, L. Li, K. Henzler, Y. Lu, J. Wang, H. Han, Y. Tian, Y. Wang, Z. Zhou, G. Lotze, T. Narayanan, M. Ballauff and X. Guo, Biomacromolecules, 2017, 18, 1574–1581 CrossRef CAS.
- V. K. Gupta, A. Mittal, V. Gajbe and J. Mittal, Ind. Eng. Chem. Res., 2006, 45, 1446–1453 CrossRef CAS.
- Y. Shao, L. Zhou, C. Bao, J. Ma, M. Liu and F. Wang, Chem. Eng. J., 2016, 283, 1127–1136 CrossRef CAS.
- P. Wu, Z. Cai, H. Jin and Y. Tang, Sci. Total Environ., 2019, 650, 671–678 CrossRef CAS.
- X. X. Ruan, Y. H. Chen, H. Chen, G. R. Qian and R. L. Frost, Chem. Eng. J., 2016, 297, 295–303 CrossRef CAS.
- J.-P. Simonin, Chem. Eng. J., 2016, 300, 254–263 CrossRef CAS.
- K. C. Bedin, A. C. Martins, A. L. Cazetta, O. Pezoti and V. C. Almeida, Chem. Eng. J., 2016, 286, 476–484 CrossRef CAS.
- X. L. Li, Y. Zhang, L. Y. Jing and X. H. He, Chem. Eng. J., 2016, 292, 326–339 CrossRef CAS.
- W. Konicki, K. Cendrowski, X. C. Chen and E. Mijowska, Chem. Eng. J., 2013, 228, 824–833 CrossRef CAS.
- Y. S. Ho and G. McKay, Process Biochem., 1999, 34, 451–465 CrossRef CAS.
- L. M. Cui, Y. G. Wang, L. Gao, L. H. Hu, L. G. Yan, Q. Wei and B. Du, Chem. Eng. J., 2015, 281, 1–10 CrossRef CAS.
- Z. Wu, H. Zhong, X. Yuan, H. Wang, L. Wang, X. Chen, G. Zeng and Y. Wu, Water Res., 2014, 67, 330–344 CrossRef CAS.
- B. Chen, H. N. Zhao, S. J. Chen, F. X. Long, B. Huang, B. Q. Yang and X. J. Pan, Chem. Eng. J., 2019, 356, 69–80 CrossRef CAS.
- W. Huang, Y. Hu, Y. Li, Y. Zhou, D. Niu, Z. Lei and Z. Zhang, J. Taiwan Inst. Chem. Eng., 2018, 82, 189–197 CrossRef CAS.
- Z. D. Wen, D. W. Gao, Z. Li and N. Q. Ren, Chem. Eng. J., 2013, 223, 298–303 CrossRef CAS.
- X. Qi, W. Wei, T. Su, J. Zhang and W. Dong, Carbohydr. Polym., 2018, 195, 368–377 CrossRef CAS.
- F. Yang, X. Bai, B. Xu and H. Guo, Cellulose, 2013, 20, 895–906 CrossRef CAS.
- L. R. Martins, J. A. V. Rodrigues, O. F. H. Adarme, T. M. S. Melo, L. V. A. Gurgel and L. F. Gil, J. Colloid Interface Sci., 2017, 494, 223–241 CrossRef CAS.
- A. A. Oladipo and M. Gazi, J. Water Process Eng., 2014, 2, 43–52 CrossRef.
- X. H. Chang, D. R. Chen and X. L. Jiao, Polymer, 2010, 51, 3801–3807 CrossRef CAS.
Footnote |
| † Electronic supplementary information (ESI) available. See DOI: 10.1039/c9ra03077h |
| This journal is © The Royal Society of Chemistry 2019 |

