 Open Access Article
Effects of wall velocity slip on droplet generation in microfluidic T-junctions
Xinlong Li ,
Liqun He
 ,
Song Lv,
Chi Xu,
Peng Qian,
Fubo Xie and
Minghou Liu*
Department of Thermal Science and Energy Engineering, University of Science and Technology of China, Hefei 230027, China. E-mail: mhliu@ustc.edu.cn
First published on 26th July 2019
Abstract
The effect of the slip lengths of both continuous and dispersed phases on droplet formation in microfluidic T-junctions is investigated by a volume of fluid method. Results reveal that, in a dripping regime, the droplet size is mainly influenced by the slip length of the continuous phase and increases with it. In a squeezing regime, the droplet size decreases with the slip lengths of both phases. The effects of the slip lengths of both phases on droplet generation are systematically discussed and summarized. The elongation rate of the thread can be decreased with an increase of slip lengths in both dripping and squeezing regimes, which is beneficial to improve droplet monodispersity. The monodispersity of droplets can deteriorate when the slip length of either phase is small and can be improved by increasing the slip length of the other phase.
1. Introduction
Droplet-based microfluidic devices that are characterized by microchannels with widths around 100 μm always contain two or more immiscible fluids with a low Reynolds number (Re). As an efficient way to produce small droplets of uniform size, droplet-based microfluidic devices have drawn extensive attention for many applications in recent years, such as chemical reaction,1–3 biotechnology,4,5 and food engineering.6,7 Since small and uniform droplets can be individual microreactors,8,9 rapid reactions will be obtained even for very few molecules. Therefore, waste of resources will be drastically reduced. Benefiting from the high surface to volume ratio of droplets, heat and mass transfer can be enhanced,10,11 providing the possibility of precise control of chemical reactions. Based on the controllable droplet size, the quantitative mixing and reaction of paired droplets could be expediently performed.12 More recently, Zhu et al.13 created a porous membrane with excellent liquid repellency and mechanical durability using a bottom-up microfluidic emulsion templating technique. All of these applications need high quality of droplets which have small and uniform sizes to get better performance. Thus, for the droplet size to be controllable, the mechanism of droplet generation should be clear.Microfluidic devices are of many forms in terms of droplet generation, and the T-junction is the most popular one for its performance being highly dependent on its geometric structure,14 after the first report of T-junction for droplet generation.15 In a T-junction device, the dispersed phase usually enters the side branch, while the continuous phase enters the main channel. Besides the high geometry-dependent performance, both the viscosities and flow rates of the two phases were found to influence the droplet generation greatly.16,17 As extensions of Newtonian fluids, non-Newtonian fluids are investigated numerically, for applications of polymers in fabricating complex delicate structures.18,19 It is also found that the high inertial flow can bring some differences in droplet generation, for the case of water-in-air systems.20 An enormous amount of research reveals that the viscosity ratio λ and flow rate ratio Q of the dispersed phase to continuous phase, surface tension between the two phases, and contact angle have significant influences on droplet generation.21–24 Whereas the ratio of surface to volume is high, the interaction between solid wall and fluids can significantly affect droplet generation25,26 and many researchers have found that the geometry of the T-junction is a crucial factor in droplet formation.27,28
For the interaction between fluid and wall, most researchers employed the contact angle to represent the wetting property in two-phase flow. A typical example is droplet motion on a solid wall enveloped by air. The contact area between droplet and solid wall decreases with increasing contact angle as shown in Fig. 1. Thus, the total adhesion exerted on the droplet from the wall decreases with contact angle. This is also applicable to the dispersed phase in droplet-based microfluidics where the continuous phase replaces the air above. In addition to the macroscopic parameter of contact angle, velocity slip could delicately describe the microscopic interaction between the wall and liquids (both dispersed and continuous phases). Some researchers found that the slip length of a liquid was not always correlated to contact angle,29,30 which means the contact angle cannot fully represent the wall velocity slip. This velocity slip can appear on the microchannel wall,31,32 which is caused by micro- or nanoscale surface roughness. As shown in the local enlarged view in Fig. 1, the air can be trapped within the contours of a rough surface. As a consequence, these sandwiched air films lead to velocity slip for both dispersed and continuous phases as long as they are in contact with the solid wall. In conclusion, the contact angle is the external expression of interaction among dispersed phase, continuous phase and solid wall, while the velocity slip is caused by the gas film sandwiched between liquid and solid wall. This slip property has been used for many applications. For example, based on the drag reduction effect of velocity slip, Choo et al.33 constructed a low-load bearing and found that liquid slip could considerably reduce friction in full-film, hydrodynamic conditions. Similarly, Zhang et al.34 investigated the performance of a submarine model with and without superhydrophobic surface under water and found that the drag reduction rate could reach 15% with superhydrophobic surface. Furthermore, liquid slip also has non-ignorable effects on hydraulic fracturing and liquid loss in shale;35 with consideration of the slip length of fluid, the calculated apparent liquid permeability in shale could be much greater than the intrinsic permeability.
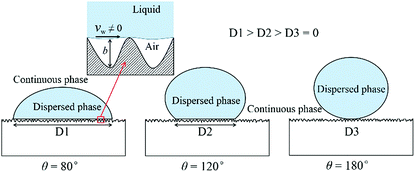 | ||
| Fig. 1 Dispersed phase and continuous phase in contact with the solid wall for different contact angles and a local enlarged view of the contact area of the liquid and solid wall. | ||
Indeed, many researchers have made their contributions to wall velocity slip research in microchannels with single-phase flow.32,36 By using μ-PIV technology, Tretheway et al.37 confirmed that the velocity slip of deionized water in a hydrophobic channel is real and the slip length is about 1 μm in their experiment. In their later research,38 Zhu et al. employed the lattice Boltzmann method (LBM) to reproduce this slip phenomenon in the earlier experiment and the simulation result agreed with the experiment quite well. Besides, they also implemented multi-component LBM simulation to investigate the effect of gas on liquid slip and found that the hydrophobic force from the wall can repulse water and leave an air film near the wall which also leads to velocity slip of water. Combined with the analysis of Fig. 1, we can say that the wall velocity slip of liquid in microchannels is common. Further research shows that velocity slip can significantly affect the flow field. Malvandi et al.39 found that with an increase of slip parameter of a microchannel, the heat transfer rate increases while the pressure drop decreases. Roy et al.36 numerically investigated the effect of slip length on water slip phenomena in rotating microchannels. They found that an increase of slip length could decrease the Coriolis force, thus the secondary flow diminishing with the slip length. To directly measure the liquid slip in a polydimethylsiloxane (PDMS) microchannel, Byun et al.40 fabricated a superhydrophobic microchannel with transverse microgrooves and discovered a slip length of about 5 μm by micro-PIV. Note that they also measured a slip length of about 2 μm in a normal PDMS microchannel which is the most popular form for droplet-based microfluidic devices.
Considering the non-negligible effect of velocity slip on single-phase flow in a microchannel, its influence on the two-phase flow of droplet-based microfluidics should also be carefully studied. However, to the best of our knowledge, up to now, there has been no relevant research that has systematically investigated the effect of velocity slip on droplet generation in microfluidic devices. To fill this gap, in the present study, the wall velocity slip of both phases is taken into consideration in a T-junction microchannel using a numerical method. Comparisons with no-slip boundary condition are performed and the effects of slip length on droplet generation are also investigated systematically.
2. Numerical model
2.1. Geometric model
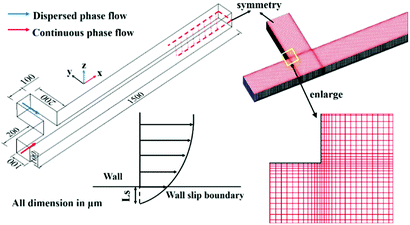
In the case of the microchannel in the present study (Fig. 2), the widths of the main and side channels are both 100 μm. As suggested by Anagnostopoulos et al.,41 computational domain independence can be obtained when the inlet channel length reaches 2w (w is the width of the channel) and the downstream length is larger than 4w. In the present study, the lengths of the main channel and the side channel upstream of the junction are both set to 200 μm, the total length of the main channel is set to 1500 μm, and the channel depth h is set to 100 μm. As the flow field is perfectly laminar and symmetrical about the z-middle plane, the computational domain is halved using symmetric boundary condition. The velocity slip lengths Lsd and Lsc are employed to characterize the wall velocity slip of dispersed phase and continuous phase respectively. As shown in Fig. 2, this slip length can be defined as the distance inside the wall where the extrapolated fluid velocity would equal the velocity of the wall.422.2. Numerical method
As a widely used simulation method,20,24,25 the volume of fluid (VOF) is employed in our simulations to track the interface between phases based on the volume fraction α within individual grid cells. The continuity equation and Navier–Stokes equation are used to solve the transport equation to define the flow field. The Newtonian, incompressible and temperature stable flow in the microchannel is simulated using the governing equations as follows:
∇·![[v with combining right harpoon above (vector)]](https://www.rsc.org/images/entities/i_char_0076_20d1.gif) = 0 = 0
| (1) |
 | (2) |
 | (3) |
![[v with combining right harpoon above (vector)]](https://www.rsc.org/images/entities/i_char_0076_20d1.gif) , p, and
, p, and  are the velocity, pressure and surface tension respectively. In each computational cell, both the density ρ and the viscosity μ of the two-phase mixture are calculated as ρ = α1ρ1 + α2ρ2 and μ = α1μ1 + α2μ2, where subscripts 1 and 2 refer to the primary and secondary phases respectively. The volumetric force of surface tension
  is calculated by the continuum surface force model:43
 | (4) |
![[n with combining circumflex]](https://www.rsc.org/images/entities/i_char_006e_0302.gif) , σ is the surface tension coefficient,
, σ is the surface tension coefficient, ![[n with combining circumflex]](https://www.rsc.org/images/entities/i_char_006e_0302.gif) is the surface unit normal calculated by
is the surface unit normal calculated by ![[n with combining circumflex]](https://www.rsc.org/images/entities/i_char_006e_0302.gif) =
= ![[n with combining right harpoon above (vector)]](https://www.rsc.org/images/entities/i_char_006e_20d1.gif) /|
/|![[n with combining right harpoon above (vector)]](https://www.rsc.org/images/entities/i_char_006e_20d1.gif) |,
|, ![[n with combining right harpoon above (vector)]](https://www.rsc.org/images/entities/i_char_006e_20d1.gif) = ∇α. Using the contact angle θ, the surface normal at the reference cells next to the wall is calculated by:
= ∇α. Using the contact angle θ, the surface normal at the reference cells next to the wall is calculated by:
![[n with combining circumflex]](https://www.rsc.org/images/entities/i_char_006e_0302.gif) = = ![[n with combining circumflex]](https://www.rsc.org/images/entities/i_char_006e_0302.gif) w w![[thin space (1/6-em)]](https://www.rsc.org/images/entities/char_2009.gif) cos cos![[thin space (1/6-em)]](https://www.rsc.org/images/entities/char_2009.gif) θ + θ + ![[t with combining circumflex]](https://www.rsc.org/images/entities/i_char_0074_0302.gif) w w![[thin space (1/6-em)]](https://www.rsc.org/images/entities/char_2009.gif) sin sin![[thin space (1/6-em)]](https://www.rsc.org/images/entities/char_2009.gif) θ θ
| (5) |
As usual, the pressure implicit with splitting of operator scheme44 is used for pressure–velocity coupling, the pressure staggering option scheme is adopted for pressure interpolation and the second-order upwind difference method is adopted for the momentum equation. The construction of interface is implemented by the Geo-Reconstruct scheme.
As for boundary conditions, uniform velocities are set to the inlets of side and main channels and fixed atmospheric pressure is applied to the outlet. Zero normal velocity and zero normal gradients are set to the symmetry surface. The first-order Navier slip model is employed to characterize the wall velocity slip boundary condition, which can be expressed as:
 | (6) |
3. Grid independence and model validation
To validate our simulation method, comparisons of both no-slip and slip wall boundaries with experiments21 are performed, and the operation conditions are set the same as the experiment in the following studies. The specific fluid properties are listed in Table 1, where ρ, μ and σ represent the density, viscosity and surface tension coefficient, respectively. Subscripts c and d refer to continuous phase and dispersed phase. The wetting condition is represented by the contact angle of the channel wall θ. The flow rate of the dispersed phase is kept at Qd = 0.2 mL h−1 while the continuous phase changes from Qc = 0.2 mL h−1 to Qc = 4 mL h−1. The resulting droplet diameter is calculated as:
 | (7) |
3.1. Grid independence
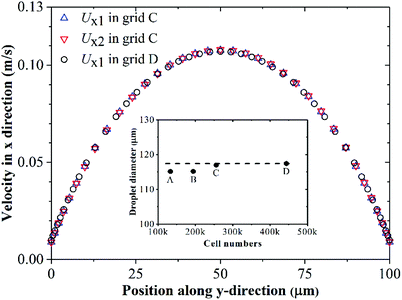
In our simulation, hexahedral grids are employed and the grids adjacent to the wall are refined to simulate the wall velocity slip more accurately (see meshes on the symmetry in Fig. 2). Four different grids are used to study grid independence. As shown in Fig. 3, the generated droplet diameter varies less than 0.37% when the mesh numbers change from 255![[thin space (1/6-em)]](https://www.rsc.org/images/entities/char_2009.gif) 476 to 443
476 to 443![[thin space (1/6-em)]](https://www.rsc.org/images/entities/char_2009.gif) 344. Besides, in grids C and D, the x-velocities along the y-direction at x = 100 μm on the symmetry plane Ux1 are in coincidence. Therefore, grid independence is achieved in grid C. Considering the balance of accuracy and computational cost, grid C is employed in the following simulations. Ux2 represents the x-velocity along the y-direction at x = 150 μm on the symmetry plane, and there is also no difference between its upstream velocity profile (Ux1 in grid C). In other words, the flow field is already fully developed at 100 μm downstream of the entrance. Thus, the uniform velocity inlet is reasonable for the present study.
344. Besides, in grids C and D, the x-velocities along the y-direction at x = 100 μm on the symmetry plane Ux1 are in coincidence. Therefore, grid independence is achieved in grid C. Considering the balance of accuracy and computational cost, grid C is employed in the following simulations. Ux2 represents the x-velocity along the y-direction at x = 150 μm on the symmetry plane, and there is also no difference between its upstream velocity profile (Ux1 in grid C). In other words, the flow field is already fully developed at 100 μm downstream of the entrance. Thus, the uniform velocity inlet is reasonable for the present study.
3.2. Model validation
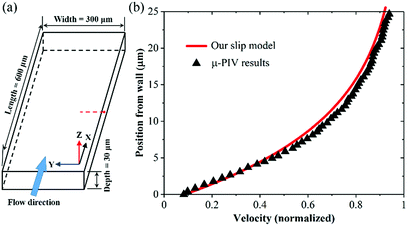
Firstly, the accuracy of the slip model used in the present work is confirmed. Because there is no previous experiment to have studied the effect of slip length on droplet generation in a microchannel, the slip velocity profile of deionized water measured by μ-PIV in the work of Tretheway et al.37 is adopted to verify our slip model. The slip length of water in the microchannel is 1 μm. As shown in Fig. 4a, in our simulation, the microchannel size is specified as 600 μm in the x-direction, 300 μm in the y-direction and 30 μm in the z-direction. The length of the microchannel is reasonable as the periodic boundary condition along the flow direction is employed. Thus, one can finally obtain a fully developed flow. The whole computational domain is meshed with resolution 400 × 200 × 30 (x, y, z directions, respectively), and the near-wall grids are also refined to capture the velocity slip. According to the experiment, the flow rate is set to 200 μL h−1. Then, a steady simulation is performed until convergence is reached. Fig. 4b shows the velocity profiles of experiment and simulation along the line of x = 300 μm and z = 15 μm (red dashed line in Fig. 4a). Obviously, our slip model almost reproduces the velocity profile of the experiment. Therefore, our slip model is precise enough to simulate the velocity slip in the following two-phase flow.As reported previously,46 when velocity slip is caused by a gas layer of thickness b sandwiched between the liquid and solid wall (Fig. 1), the slip length Ls can be represented by
| Ls = b(μl/μa − 1) | (8) |
| Lsd/Lsc ≈ μd/μc | (9) |
Since previous studies of droplet-based microfluidics have paid no attention to the roughness of the channel wall, the value of the microfeature depth b is unknown. However, referring to the experiments of Tretheway et al.37 and Byun et al.,40 in common microchannels, the magnitude of the slip length is about 1 μm. This value is adopted as a yardstick to estimate the slip lengths in experiments. In the following two validations, the possible velocity slip lengths caused by the microfeature of the channel wall are taken into consideration and their simulation results are compared with traditional simulation results without considering velocity slip. Based on these validations and comparisons, the necessity of the consideration of wall velocity slip in microfluidic devices will become clear.
In the first validation with experiment,21 according to the viscosities listed in Table 1 and to eqn (9), the possible slip lengths of continuous and dispersed phases are set to Lsc = 0.5 μm and Lsd = 2 μm, respectively. As shown in Fig. 5a, the droplet diameter decreases with the flow rate of the continuous phase. The simulation using no-slip wall boundary condition agrees with experiment well at low continuous phase flow rate. When the continuous phase flow rate exceeds 1 mL h−1, however, it deviates from the experimental data significantly as the droplets are generated in two different periods rather than the uniform period when Qc = 2 mL h−1 (as shown in inset). Besides, the droplet size of the no-slip simulation is far less than that in the experiment when Qc = 4 mL h−1. In contrast, the simulation with wall velocity slip lengths of Lsc = 0.5 μm and Lsd = 2 μm agrees with experiment better through the whole range of continuous phase flow rate as the maximum deviation between fitting lines of experiment21 and simulation is 6.58%. Fig. 5c shows snapshots of droplet formation in the experiment21 and our simulation with flow rates of Qd = 0.2 mL h−1 and Qc = 2 mL h−1 of the same time interval. Firstly, the dispersed phase obstructs a small portion of the main channel. Then, in the filling stage, with the continuous injection of dispersed phase, the tip grows and deforms under the balance of shearing force, pressure drop and surface tension through the emerging thread. Finally, in the necking stage, when the shearing force and the pressure drop dominate the surface tension, the convex interface shrinks to a concave neck until it collapses. The simulations agree with experiments very well in each stage.
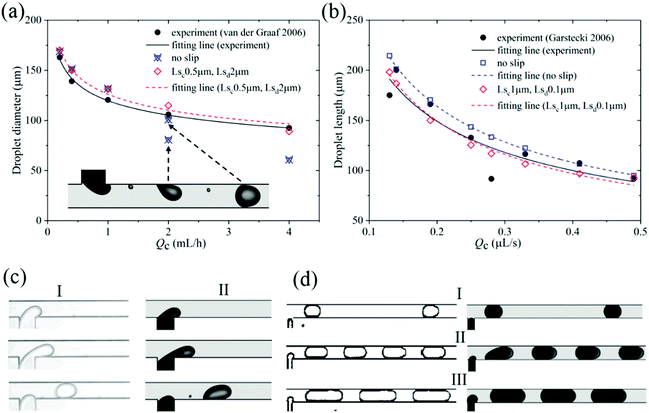 | ||
| Fig. 5 Validation with the experiments of (a) van der Graaf et al.21 and (b) Garstecki et al.45 (c) Snapshots of (I) experiments21 and (II) our simulations with Qc = 2 mL h−1, Lsc = 0.5 μm, Lsd = 2 μm. (d) Snapshots of experiments45 (left) and our simulations (right) with Lsc = 1 μm and Lsd = 0.1 μm for (I) Qd = 0.004 μL s−1, Qc = 0.028 μL s−1; (II) Qd = 0.14 μL s−1, Qc = 0.139 μL s−1; (III) Qd = 0.05 μL s−1, Qc = 0.028 μL s−1. | ||
The second validation with experiment45 is also performed. The fluid properties are listed in Table 1. Based on eqn (9), the slip lengths for wall slip boundary are set as Lsc = 1 μm and Lsd = 0.1 μm. Fig. 5b shows that the simulation with wall velocity slip agrees with the experiments45 more accurately, as the maximum errors of no-slip and slip boundary simulations with experiments are 11.37% and 4.03%, respectively. What is more, the visualization of droplet formation in our simulations of wall velocity slip matches the experiment closely over a wide range of flow rate, as shown in Fig. 5d. Therefore, the present model considering wall velocity slip predicts the droplet formation more precisely than the no-slip one in the microchannel. It suggests that the selection of no-slip boundary condition in the microchannel should be made with caution. Considering wall velocity slip in the simulation of droplet formation in a microfluidic channel is usually necessary.
4. Results and discussion
In this section, based on the verified numerical method, the wall velocity slip will be systematically studied to get a better understanding of its effects on droplet formation in a microfluidic T-junction.4.1. Flow fields with different slip lengths
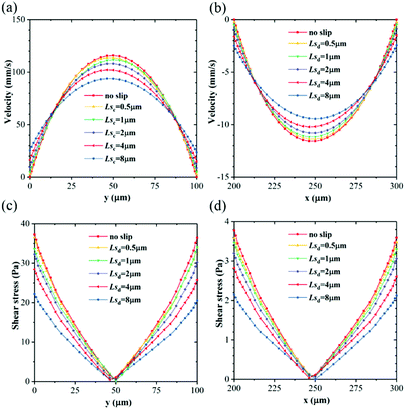
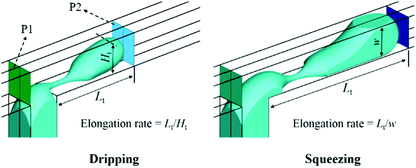
Fig. 6a shows the x-velocity distributions across the main channel with different Lsc. With increasing Lsc, the slip velocity at the wall increases, but the magnitude of the maximum velocity decreases due to mass conservation along the microchannel. As a result, the velocity profile becomes more flattened with slip length increasing. It can be deduced that the velocity gradient is smaller with a larger slip length. As shown in Fig. 6c, the fluid suffers resistant shear stress exerted by the slow object (adjacent fluid or wall). This shear stress decreases with slip length and this reduction is particularly significant near the wall. Similarly, the y-velocity profiles and shear stresses across the dispersed phase inlet channel for different Lsd also follow the same rule with smaller magnitudes, as shown in Fig. 6b and d.Dripping and squeezing are two main droplet generation regimes in experiments to get uniform droplets, as shown in Fig. 7. In dripping regime, only part of the width of the main channel is obstructed by the thread, the viscous force from the continuous phase acting as the leading driving force for droplet generation. While in squeezing regime, because the thread fully contacts with the main channel, the pressure drop through the emerging thread and the shear force from channel wall become critical for droplet generation. In Fig. 7, P1 and P2 represent the pressures upstream and downstream of the thread; Lt and Ht represent the length and height of the thread. Particularly, thread height Ht equals channel width w in squeezing regime.
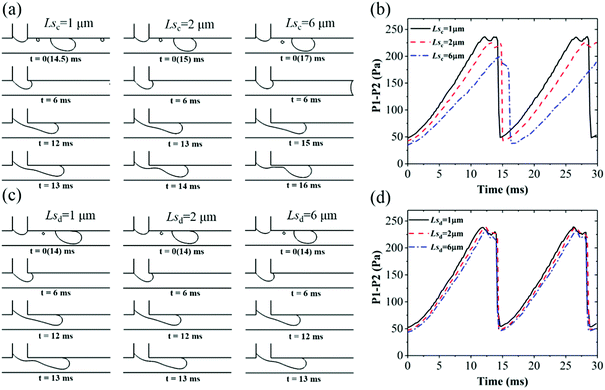
As a driving force of droplet breakup, the pressure drop through the thread is investigated for different slip lengths in both dripping and squeezing regimes. Fig. 8a shows the droplet generation process with different Lsc with fixed Lsd = 0.5 μm in dripping regime. The period increases with slip length of the continuous phase, namely 14.5, 15 and 17 ms for Lsc at 1, 2 and 6 μm, respectively. According to the corresponding pressure drop in Fig. 8b, it is found that pressure drop decreases with Lsc at every time of the whole cycle. Thus, the droplet collapses more slowly with larger Lsc for a smaller driving pressure. Fig. 8c shows the droplet generation with various Lsd in the same condition, where the entire process looks the same with a period of 14 ms and the corresponding pressure drops almost coincide with each other as shown in Fig. 8d. Notice that the pressure drop fluctuates at the plateau. This is due to the neck of the thread becoming concave during this time (the third row to the fourth row in Fig. 8a and c). Then, the thread collapses to droplet very quickly along with the sharp decrease of pressure drop.
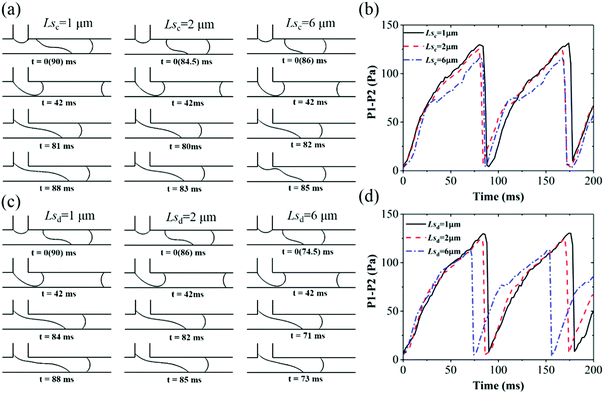
In squeezing regime, due to the thread fully contacting the wall, the role of resistance from the wall is enhanced. As shown in Fig. 9a and c, Lsd affects the droplet generation process more obviously than Lsc and the period decreases with Lsd. Comparing Fig. 9b and d, it is found that the buildups of pressure drop deviate a little with different Lsc and are synchronous with different Lsd. Due to the lower resistance from the channel wall with larger Lsd (Fig. 6d), the thread collapses earlier with Lsd. Meanwhile, the increase of driving shear force from the continuous phase also accelerates thread collapse, which will be discussed in the following Fig. 11a and 13a. Thus, the final peak of pressure drop decreases with both Lsc and Lsd.
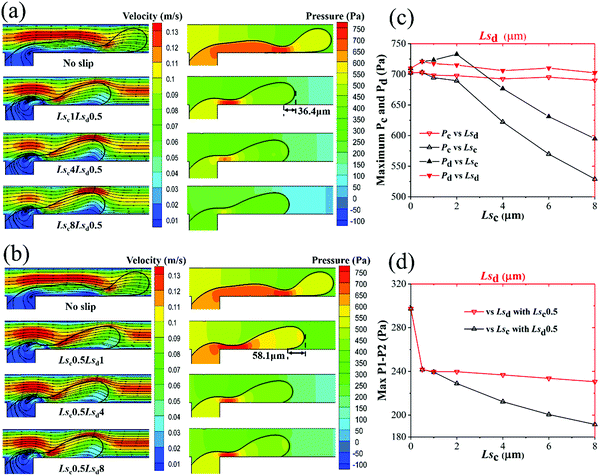
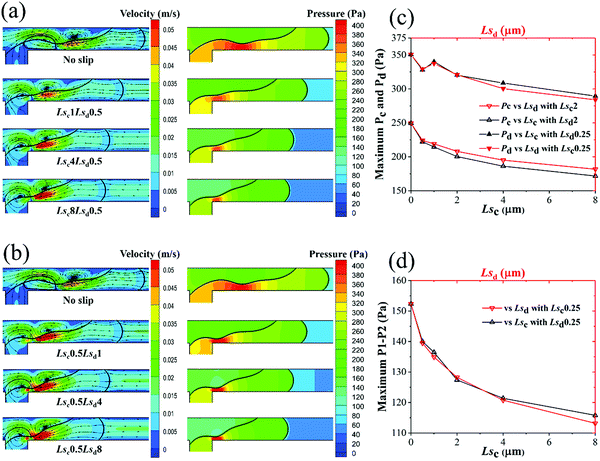
In this subsection, the flow fields of the two phases in both dripping and squeezing regimes are systematically analyzed. For dripping regime, Fig. 10a shows the velocity contours with streamlines and pressure contours on the symmetry plane under different Lsc just before thread breakup. When Lsc = 0, namely, no-slip boundary condition, the thread stretches downstream for a long distance and the breaking point is also downstream of the junction, leading to an unstable droplet formation state (i.e. generating two droplets with different sizes). With increasing Lsc with Lsd = 0.5 μm, the thread length decreases, and more stable droplet generation can be obtained. Due to the separation of the two phases, the maximum velocity of the continuous phase in the main channel distributes along the thread surface. As shown in Fig. 6a and 10a, the maximum velocity of the continuous phase decreases with Lsc, which will reduce the driving shear force exerted on the dispersed phase. The pressure inside the thread is larger than that of the outer continuous phase due to the pressure drop caused by surface tension. With an increase of Lsc, the pressures in both dispersed and continuous phases decrease as a result of the reduction of resistance from the wall.
Fig. 10b shows the velocity fields and pressure fields of different Lsd before thread breakup. Different from Fig. 10a, the maximum velocity of the continuous phase along the thread surface is almost unchanged with the increase of Lsd due to the unchanged velocity profile of the continuous phase with fixed Lsc. The pressure inside the thread for a certain Lsd is larger than that inside the thread of the same value of Lsc. By comparing the outlines of thread in Fig. 10a and b, it is found that the slip of the dispersed phase can retract the contact line of the thread; it will enlarge the curvature of the thread head. Thus, the surface tension is bigger in Fig. 10b than in Fig. 10a for certain Ls. For example, for Lsd = 1 μm and Lsc = 1 μm, the retraction distances are 58.1 and 36.4 μm, respectively.
Fig. 10c shows the maximum pressures at inlets of continuous and dispersed phases versus Lsc and Lsd. It can be clearly seen that Lsd almost has no effect on the maximum pressures at the two inlets. Meanwhile, with increasing Lsc, the maximum pressures decrease significantly at both inlets.
The slight increase of maximum Pd with Lsc may be caused by the increase of thread curvature with small Lsc. Fig. 10d shows the maximum pressure drop across the thread decreases with Lsc; however, this decrease is ignorable when Lsd exceeds 0.5 μm. The continuous decrease of P1–P2 reduces the driving force of thread collapse. Meanwhile, as discussed in Fig. 10a, shear stress exerted by the continuous phase also decreases with Lsc. This makes the thread collapse with more difficultly, resulting in a bigger droplet.
In squeezing regime, as shown in Fig. 11a and b, the thread length also decreases with slip lengths of both phases. Unlike in the dripping regime, the maximum velocity along the thread surface only increases a little with Lsc, while it is almost unchanged with Lsd. Due to the thread hindering the passage of the continuous phase, the increasing continuous phase mainly pushes the thread forward with an obvious reversed flow generated above the maximum velocity region. The pressures inside and outside the thread decrease with both Lsc and Lsd as shown in Fig. 11c. The slight increase of Pc from Ls = 0.5 to Ls = 1 μm may be caused by the sudden change of thread curvature, which can be investigated in the following work. Fig. 11d shows the maximum pressure drops across the thread decrease with both slip lengths of the two phases and this decrease is faster with Lsd of larger value, which is consistent with Fig. 9b and d.
To exhibit the shear force exerted on the thread surface more intuitively, the three-dimensional thread surfaces colored by the shear stress magnitude with different slip lengths in dripping regime are shown in Fig. 12. Fig. 12a shows that the shear stress near the neck exerted by the continuous phase decreases with Lsc, which is consistent with the velocity distribution in Fig. 10a. Furthermore, as Lsc increases, the thread begins to bond to upper and lower channel walls more tightly, preventing the thread from breaking up. By observing the shear stress on the equator slice of the thread, it is found that the shear stress near the wall decreases with Lsc. Fig. 12b shows that the shear stress exerted by the continuous phase on the thread surface keeps constant as Lsd increases, which is also consistent with the velocity distribution in Fig. 10b. Meanwhile, the thread also bonds to the upper and lower channel walls as Lsd increases, but less tightly.
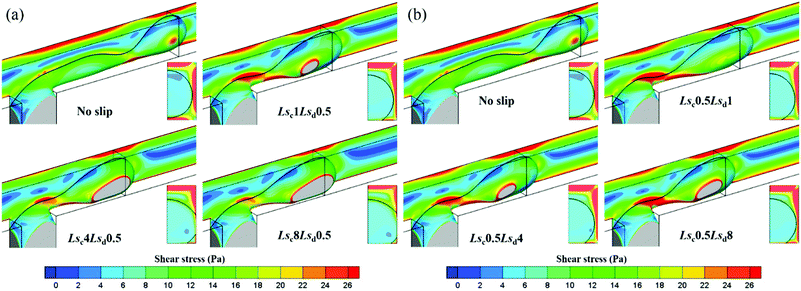 | ||
| Fig. 12 Droplet surface colored by shear stress magnitude with (a) different Lsc when Lsd = 0.5 μm and (b) different Lsd when Lsc = 0.5 μm for Qd = 0.2 mL h−1 and Qc = 2 mL h−1 in a dripping regime. | ||
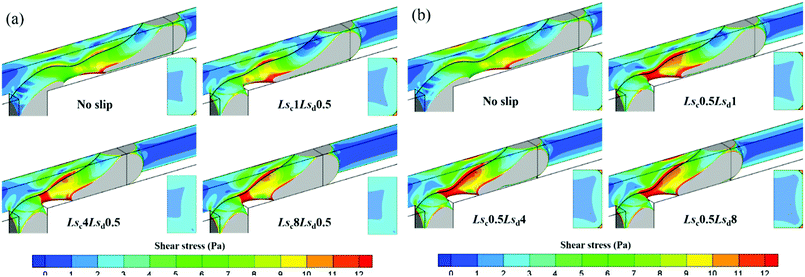
Fig. 13 shows the three-dimensional thread surface colored by the shear stress magnitude with different Lsc and Lsd in squeezing regime. In Fig. 13a, the shear stress exerted on the thread surface increases as Lsc increases. Since Lsd is constant, the shear stress on the equator slice of the thread almost keeps unchanged with Lsc increasing. As for the effect of Lsd in Fig. 13b, it mainly reduces the shear stress the wall exerts on the thread; thus, the shear stress on the equator slice of the thread decreases with Lsd. This means that the thread collapses in an easier way.
4.2. Effects of slip length on droplet size and monodispersity
The size and monodispersity of generated droplets are the parameters of most concern in droplet-based microfluidic devices. In this section, the effects of slip length on droplet size and monodispersity are carefully investigated in both dripping and squeezing regimes.In dripping regime, the droplet diameter is employed to represent the droplet size. As shown in Fig. 14a, when Lsd is fixed at 0.5 or 2 μm, the generated droplet diameter increases with Lsc. When Lsc is fixed at 0.5 or 2 μm, the generated droplet diameter almost keeps constant with Lsd. This indicates that, in dripping regime, the slip length of the continuous phase governs the droplet generation process. Notice that, when the slip length is zero, namely, no-slip boundary condition, the thread breaks up into two droplets with different diameters. This should be avoided as far as possible to get uniform droplets. As shown in Fig. 7, the thread elongation rate is defined as the ratio of thread length to its height. Large thread elongation rate is more likely to deteriorate the monodispersity. Fig. 14b shows that the maximum thread elongation rate decreases with both Lsc and Lsd in the droplet generation process. When the slip length is between 0.5 μm and 6 μm, the slip of the continuous phase has a better performance to reduce thread elongation.
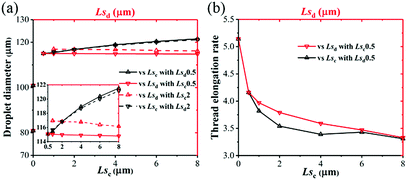 | ||
| Fig. 14 (a) Droplet diameter and (b) thread elongation rate as functions of Lsc and Lsd in a dripping regime with Qd = 0.2 mL h−1 and Qc = 2 mL h−1. | ||
In squeezing regime, the droplet size is represented by droplet length. Fig. 15a shows the droplet length decreases with both Lsc and Lsd except that it increases when slip length changes from 0.5 to 1 μm. This particular trend is consistent with the special pressure change in the dispersed phase as shown in Fig. 11c, which can be discussed in the following work. When the slip length value exceeds 4 μm, the effects of Lsc on droplet length almost disappeared; meanwhile, droplet length still decreases with Lsd. Therefore, Lsd is the dominant factor in squeezing regime. Fig. 15b shows the thread elongation rate decreases with Lsc and Lsd. However, the elongations of Lsc = 0.5 μm and Lsc = 1 μm are larger than the same Lsd.
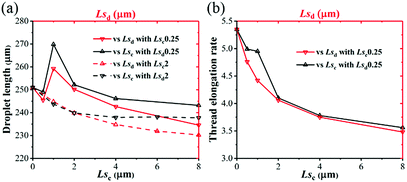 | ||
| Fig. 15 (a) Droplet length and (b) thread elongation rate as functions of Lsc and Lsd in a squeezing regime with Qd = 0.09 mL h−1 and Qc = 0.18 mL h−1. | ||
In conclusion, Table 2 systematically lists the changes of main droplet generation parameters with increasing of slip length. Fc and Fw are shear forces exerted by the continuous phase and channel wall which promote and hinder thread collapse, respectively. d, l, and e represent droplet diameter, droplet length, and maximum thread elongation rate, respectively. Notice that Lsc is the dominant factor in dripping regime and Lsd governs the droplet generation in squeezing regime. The increase of either slip length can weaken the elongation of the thread and improve the monodispersity of the droplet.
| Ls | Fc | Fw | Max P1–P2 | d or l | e |
|---|---|---|---|---|---|
| Dripping | |||||
| Lsc ↗ | ↘↘ | → | ↘↘ | ↗ | ↘ |
| Lsd ↗ | → | ↘ | → | → | ↘ |
![[thin space (1/6-em)]](https://www.rsc.org/images/entities/char_2009.gif) |
|||||
| Squeezing | |||||
| Lsc ↗ | ↗↗ | → | ↘ | ↘ | ↘ |
| Lsd ↗ | → | ↘↘ | ↘ | ↘ | ↘ |
As mentioned above, in some conditions, the monodispersity of the generated droplet will deteriorate as double collapse state occurs. As shown in Fig. 16a, big and small droplets collapse from the thread successively. We define this as “double collapse I” state. When the small droplet is split from the generated big droplet, it should be “double collapse II” state. If the generated droplet is single and uniform, we call it “single collapse” state. To study the effects of slip lengths of the two phases on droplet monodispersity, the same condition as in Fig. 12 is employed. Fig. 16b shows the phase diagram of the droplet generation state as a function of Lsc and Lsd. It is found that double collapse I happens when the slip lengths of the two phases are small. The double collapse II state mainly appears in a region near Lsc = 0.25 μm and Lsd = 0.5 μm. By increasing the slip length of either phase, the monodispersity can be improved even though the slip length of the other phase is small. According to this phase diagram, it is easier to improve the monodispersity by increasing the slip length of the continuous phase.
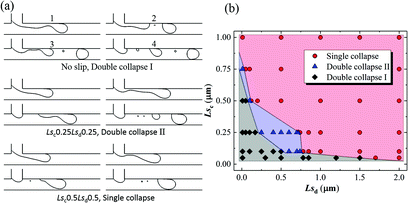 | ||
| Fig. 16 (a) Three different droplet generation states and (b) phase diagram of droplet generation state as a function of Lsc and Lsd in a dripping regime with Qd = 0.2 mL h−1and Qc = 2 mL h−1. | ||
5. Conclusions
In the present study, a VOF model considering wall velocity slip is applied to study the effects of the wall velocity slips of both continuous and dispersed phases on droplet formation in a microfluidic T-junction. By comparing the simulation results with and without wall velocity slip considerations, it is found that the simulations with slip agree with experiments much better. Thus, the employment of velocity slip in droplet-based microfluidics is necessary which is consistent with previous research into single-phase flow. It is found that the velocity profile across the flow channel section becomes flattened with increasing slip length; as a result, the shear stress across the flow section decreases. In a dripping regime, the shear stress exerted on the thread surface and the pressure drop across the thread decrease with the slip length of the continuous phase Lsc. However, the slip length of the dispersed phase Lsd has no influence on the shear stress and pressure drop. Thus, the droplet diameter increases with Lsc while keeping unchanged with increasing Lsd. In a squeezing regime, the driving shear force from the continuous phase increases with Lsc while the hindering shear force from the wall decreases with Lsd. Therefore, the droplet length decreases with the slip length of both phases. The elongation rate of the thread decreases with increases in the slip length of both phases in dripping and squeezing regimes, which is beneficial to improve the droplet monodispersity. Under certain conditions, double collapse states will occur when the slip length of either phase is small. By increasing the slip length of the other phase, the monodispersity can be improved. The simulation provides new insight into droplet generation, in that the wall velocity slip in the microchannel can significantly influence the droplet size and monodispersity, and opens up a new avenue for the better control of droplet formation considering wall velocity slip.Conflicts of interest
There are no conflicts to declare.Acknowledgements
We acknowledge support from the Natural Science Foundation of China (NSFC grant no. 31670866, 11372302) and the Fundamental Research Funds for the Central Universities (WK6030000071); the numerical calculations in this work have been supported by the Supercomputing Centre of the University of Science and Technology of China.References
- H. Song, D. L. Chen and R. F. Ismagilov, Angew. Chem., Int. Ed., 2006, 45, 7336–7356 CrossRef CAS PubMed.
- T. S. Kaminski and P. Garstecki, Chem. Soc. Rev., 2017, 46, 6210–6226 RSC.
- P. H. Hoang, K.-B. Yoon and D.-P. Kim, RSC Adv., 2012, 2, 5323–5328 RSC.
- J. Avesar, T. Ben Arye and S. Levenberg, Lab Chip, 2014, 14, 2161–2167 RSC.
- Y. Li, L. Yan, Y. Liu, K. Qian, B. Liu, P. Yang and B. Liu, RSC Adv., 2015, 5, 1331–1342 RSC.
- O. Skurtys and J. M. Aguilera, Food Biophys., 2008, 3, 1–15 CrossRef.
- G. Bonat Celli and A. Abbaspourrad, Annual review of food science and technology, 2018 Search PubMed.
- L. J. Pan, J. W. Tu, H. T. Ma, Y. J. Yang, Z. Q. Tian, D. W. Pang and Z. L. Zhang, Lab Chip, 2017, 18, 41–56 RSC.
- G. Niu, L. Zhang, A. Ruditskiy, L. Wang and Y. Xia, Nano Lett., 2018, 18, 3879–3884 CrossRef CAS PubMed.
- C. Yao, Y. Zhao and G. Chen, Chem. Eng. Sci., 2018, 189, 340–359 CrossRef CAS.
- Z. Che, T. N. Wong, N.-T. Nguyen and C. Yang, Int. J. Heat Mass Transfer, 2015, 86, 455–464 CrossRef.
- L. Frenz, A. El Harrak, M. Pauly, S. Begin-Colin, A. D. Griffiths and J. C. Baret, Angew. Chem., 2008, 47, 6817–6820 CrossRef CAS PubMed.
- P. Zhu, T. Kong, X. Tang and L. Wang, Nat. Commun., 2017, 8, 15823 CrossRef CAS PubMed.
- A. Gupta and R. Kumar, Phys. Fluids, 2010, 22, 122001 CrossRef.
- T. Thorsen, R. W. Roberts, F. H. Arnold and S. R. Quake, Phys. Rev. Lett., 2001, 86, 4163–4166 CrossRef CAS PubMed.
- T. Nisisako, T. Torii and T. Higuchi, Lab Chip, 2002, 2, 24–26 RSC.
- J. D. Tice, A. D. Lyon and R. F. Ismagilov, Anal. Chim. Acta, 2004, 507, 73–77 CrossRef CAS.
- S. G. Sontti and A. Atta, Chem. Eng. J., 2017, 330, 245–261 CrossRef CAS.
- V.-L. Wong, K. Loizou, P.-L. Lau, R. S. Graham and B. N. Hewakandamby, Chem. Eng. Sci., 2017, 174, 157–173 CrossRef CAS.
- M. Mastiani, B. Mosavati and M. Kim, RSC Adv., 2017, 7, 48512–48525 RSC.
- S. van der Graaf, T. Nisisako, C. G. Schroen, R. G. van der Sman and R. M. Boom, Langmuir, 2006, 22, 4144–4152 CrossRef CAS PubMed.
- Y. Ba, H. Liu, J. Sun and R. Zheng, Int. J. Heat Mass Transfer, 2015, 90, 931–947 CrossRef.
- M. Nekouei and S. A. Vanapalli, Phys. Fluids, 2017, 29, 032007 CrossRef.
- V. M. Rajesh and V. V. Buwa, Chem. Eng. J., 2018, 345, 688–705 CrossRef CAS.
- M. Wang, C. Kong, Q. Liang, J. Zhao, M. Wen, Z. Xu and X. Ruan, RSC Adv., 2018, 8, 33042–33047 RSC.
- M. P. Boruah, A. Sarker, P. R. Randive, S. Pati and S. Chakraborty, Phys. Fluids, 2018, 30, 122106 CrossRef.
- W. T. Wang, Z. Liu, Y. Jin and Y. Cheng, Chem. Eng. J., 2011, 173, 828–836 CrossRef CAS.
- A. Gupta and R. Kumar, Microfluid. Nanofluid., 2009, 8, 799–812 CrossRef.
- J. H. Cho, B. M. Law and F. Rieutord, Phys. Rev. Lett., 2004, 92, 166102 CrossRef PubMed.
- C. L. Henry, C. Neto, D. R. Evans, S. Biggs and V. S. J. Craig, Phys. A, 2004, 339, 60–65 CrossRef CAS.
- C. H. Choi and C. J. Kim, Phys. Rev. Lett., 2006, 96, 066001 CrossRef PubMed.
- J. P. Rothstein, Annu. Rev. Fluid Mech., 2010, 42, 89–109 CrossRef.
- J. H. Choo, R. P. Glovnea, A. K. Forrest and H. A. Spikes, J. Tribol., 2007, 129, 611–620 CrossRef.
- S. Zhang, X. Ouyang, J. Li, S. Gao, S. Han, L. Liu and H. Wei, Langmuir, 2015, 31, 587–593 CrossRef CAS PubMed.
- F. Javadpour, M. McClure and M. E. Naraghi, Fuel, 2015, 160, 549–559 CrossRef CAS.
- P. Roy, N. K. Anand and D. Banerjee, Int. J. Heat Mass Transfer, 2013, 62, 184–199 CrossRef.
- D. C. Tretheway and C. D. Meinhart, Phys. Fluids, 2002, 14, L9–L12 CrossRef CAS.
- L. Zhu, D. Tretheway, L. Petzold and C. Meinhart, J. Comput. Phys., 2005, 202, 181–195 CrossRef.
- A. Malvandi and D. D. Ganji, Int. J. Therm. Sci., 2014, 84, 196–206 CrossRef CAS.
- D. Byun, J. Kim, H. S. Ko and H. C. Park, Phys. Fluids, 2008, 20, 113601 CrossRef.
- J. S. Anagnostopoulos and D. S. Mathioulakis, Phys. Fluids, 2004, 16, 3900–3910 CrossRef CAS.
- W. G. Vincenti and C. H. Kruger, Introduction to physical gas dynamics, Wiley, New York, 1965 Search PubMed.
- J. U. Brackbill, D. B. Kothe and C. Zemach, J. Comput. Phys., 1992, 100, 335–354 CrossRef CAS.
- R. I. Issa, J. Comput. Phys., 1986, 62, 40–65 CrossRef.
- P. Garstecki, M. J. Fuerstman, H. A. Stone and G. M. Whitesides, Lab Chip, 2006, 6, 693 RSC.
- O. I. Vinogradova, Langmuir, 1995, 11, 2213–2220 CrossRef CAS.
| This journal is © The Royal Society of Chemistry 2019 |

