
 Open Access Article
 This Open Access Article is licensed under a Creative Commons Attribution-Non Commercial 3.0 Unported Licence
Theoretical predictions for low-temperature phases, softening of phonons and elastic stiffnesses, and electronic properties of sodium peroxide under high pressure†
Pornmongkol
Jimlim
 abc,
Prutthipong
Tsuppayakorn-aek
ab,
Teerachote
Pakornchote
ab,
Annop
Ektarawong
ab,
Udomsilp
Pinsook
ab and
Thiti
Bovornratanaraks
*ab
abc,
Prutthipong
Tsuppayakorn-aek
ab,
Teerachote
Pakornchote
ab,
Annop
Ektarawong
ab,
Udomsilp
Pinsook
ab and
Thiti
Bovornratanaraks
*ab
aExtreme Conditions Physics Research Laboratory, Physics of Energy Materials Research Unit, Department of Physics, Faculty of Science, Chulalongkorn University, Bangkok 10330, Thailand. E-mail: thiti.b@chula.ac.th; Fax: +66 2253 1150; Tel: +66 2218 7554
bThailand Center of Excellence in Physics, Commission on Higher Education, Bangkok 10400, Thailand
cDepartment of Physics, Mahidol Wittayanusorn School, Nakhon Pathom 73170, Thailand
First published on 1st October 2019
Abstract
High-pressure phase stabilities up to 600 K and the related properties of Na2O2 under pressures up to 300 GPa were investigated using first-principles calculations and the quasi-harmonic approximation. Two high-pressure phases of Na2O2 that are thermodynamically and dynamically stable were predicted consisting of the Amm2 (distorted P![[6 with combining macron]](https://www.rsc.org/images/entities/char_0036_0304.gif) 2m) and the P21/c structures, which are stable at low temperature in the pressure range of 0–22 GPa and 22–28 GPa, respectively. However, the P2m and Pbam structures become the most stable instead of the Amm2 and P21/c structures at the elevated temperatures, respectively. Interestingly, the softening of some phonon modes and the decreasing of some elastic stiffnesses in the Amm2 structure were also predicted in the pressure ranges of 2–3 GPa and 9–10 GPa. This leads to the decreasing of phonon free energy and the increasing of the ELF value in the same pressure ranges. The HSE06 band gaps suggest that all phases are insulators, and they increase with increasing pressure. Our findings provide the P–T phase diagram of Na2O2, which may be useful for investigating the thermodynamic properties and experimental verification.
2m) and the P21/c structures, which are stable at low temperature in the pressure range of 0–22 GPa and 22–28 GPa, respectively. However, the P2m and Pbam structures become the most stable instead of the Amm2 and P21/c structures at the elevated temperatures, respectively. Interestingly, the softening of some phonon modes and the decreasing of some elastic stiffnesses in the Amm2 structure were also predicted in the pressure ranges of 2–3 GPa and 9–10 GPa. This leads to the decreasing of phonon free energy and the increasing of the ELF value in the same pressure ranges. The HSE06 band gaps suggest that all phases are insulators, and they increase with increasing pressure. Our findings provide the P–T phase diagram of Na2O2, which may be useful for investigating the thermodynamic properties and experimental verification.
1 Introduction
Sodium peroxide (Na2O2) is of great interest because of its broad applications, for example as a bleaching agent, oxidizing agent, and in breathing apparatus.1,2 Na2O2 is also utilized as an oxygen source by capturing carbon dioxide to generate oxygen and sodium carbonate.1 Moreover, Na2O2 has attracted much attention in energy storage for Na–O2 batteries due to its high energy density.3 However, the formation of a discharge product of Na2O2 on the cathode of the batteries leads to poor reversibility and increasing overpotential during recharge.3 Therefore, obtaining in-depth understanding about the structural and thermodynamic stabilities of Na2O2 is of fundamental importance for improving the performance of Na–O2 batteries.It is well-known that pressure can be employed to synthesize novel materials with different electronic structures, properties, and stoichiometries.4 Consequently, an in-depth understanding of the structural phase transitions and related properties (e.g. elastic, vibrational, and electronic properties) of Na2O2 under high pressure is paramount. Previously, the crystal structure of Na2O2 at ambient conditions has been investigated. Tallman et al. and Föppl independently studied this at room temperature using single-crystal/powder X-ray diffraction measurements. They found that the crystal structure of Na2O2 is hexagonal with the P2m space group and lattice constants of a = 6.22 Å and c = 4.47 Å were reported by Tallman et al.5 and of a = 6.208 Å and c = 4.469 Å were reported by Föppl6 (see Table S1, ESI†). However, although the lattice constants of Tallman’s and Föppl’s structures are not significantly different within the maximal error of ±0.01 Å, the atomic positions of Na1 and Na2 are significantly different with atomic displacements of 0.118 Å and 0.012 Å, respectively. Thus, the most stable structure at room temperature should be identified theoretically. Very recently, Dunst et al.7 used the Rietveld refinement methods to analyze the X-ray powder diffraction patterns of microcrystalline and nanocrystalline Na2O2. The obtained structures were consistent with Föppl’s structure. In addition, Tallman et al.8 reported evidence for two new phases of Na2O2 that were observed over the range of 25–550 °C. One was found at 512 °C, and the other was found at room temperature and was prepared by pouring liquid Na2O2 into liquid air.8,9 They suggested that the quenched Na2O2 may be stable in the temperature range of 596–675 °C or at low temperature.8 However, the crystal structures of the two phases have not been identified. Therefore, the determination of new phase structures of Na2O2 at room and high temperature needs guidance from theoretical prediction.
As for previous high-pressure study, Deng et al.10 investigated the structural phase transition of Na2O2 in the range of 0–100 GPa using first-principles calculations. They employed the particle swarm optimization algorithm (CALYPSO) to search the lowest enthalpy structures at given pressures and optimized them using the projected augmented-wave potentials with 3s1p0 and 2s22p4 as valence electrons for Na and O, respectively, and the Perdew–Burke–Ernzerhof (PBE) functional as implemented in the Vienna Ab initio Simulation Package (VASP). They predicted that the hexagonal P2m structure transforms to the orthorhombic Pbam structure at around 28 GPa.10 However, since the high-pressure phases of Na2O2 are waiting for experimental confirmation, the structural phase transition is an open question for further theoretical prediction, which has been conducted in the present work.
In this work, the first-principles calculations based on the density functional theory (DFT) formalism and the quasi-harmonic approximation (QHA) were employed to investigate thermodynamic phase stabilities in order to find new structures of Na2O2 at high pressures. Here the ab initio random structure searching (AIRSS) method was used to search the lowest enthalpy structures. Moreover, the structural phase transition in Na2O2 was also reviewed and extended up to 300 GPa based on the DFT calculations. The elastic, vibrational, and electronic properties of Na2O2 at high pressures were also calculated to describe their properties. In addition, the VESTA program was also employed to visualize all crystal structures.11
2 Computational methods
All calculations were performed using the Cambridge Serial Total Energy Package (CASTEP),12 which is based on DFT calculations. Ultrasoft pseudopotentials13 were generated for Na: 2s2 2p6 3s1 and O: 2s2 2p4, and the GGA–PBE exchange–correlation functional14 was employed with a plane-wave basis cutoff of 760 eV and a k-point grid spacing of 2π × 0.04 Å−1. In order to optimize the unit cells, the ultrafine quality of convergence tolerance was set as follows: energy change less than 1.0 × 10⁻⁶ eV atom−1, a residual force less than 0.01 eV Å−1, atomic displacement within 5.0 × 10⁻⁴ Å, and stress below 0.02 GPa. Furthermore, to calculate the phonon and electronic properties, the cells were optimized again with a denser grid spacing of 2π × 0.02 Å−1 and maximum force less than 0.001 eV Å−1.In order to search the lowest enthalpy structure in the pressure range of 0–300 GPa, the AIRSS technique15 was performed at 0, 10, 20, 30, 100, 200, and 300 GPa by generating the random cells that contained Na2O2 with 1, 2, 3, 4, and 6 formula units (f.u.). Furthermore, the random atomic displacements and random unit cell deformations (namely “shaking”)4 were also used to generate the mutated structures of the Tallman’s and the Föppl’s structures at ambient pressure. By generating initial structures with different lattice parameters and number of formula units that implemented reasonable bond lengths and unit cell volumes at each pressure, the structures were relaxed to the enthalpy minimum and then the lowest enthalpy structure selected for refining the structures and their energies.15,16 The simple linear approximation was employed to estimate the enthalpies (H) of structures at given pressures:
| H(P) ≃ H(Ps) + (P − Ps)Vs, | (1) |
Elastic constants calculations were performed to analyze the evolution of the elastic constants, bulk and shear moduli, and elastic anisotropy of Na2O2 for the ambient phase at elevated pressure. By generating the set of distorted structures that is required by the symmetry, the full 6 × 6 tensor of elastic constants was produced to determine the stress–strain relationships.18 Furthermore, the universal elastic anisotropy index (AU) was used to quantify the elastic anisotropy, which was obtained from the formula19
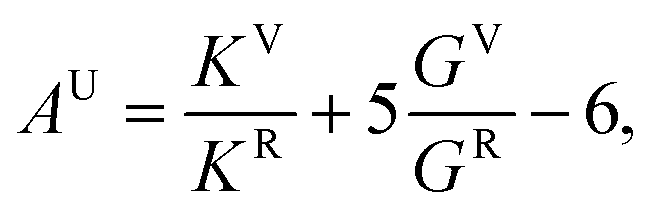 | (2) |
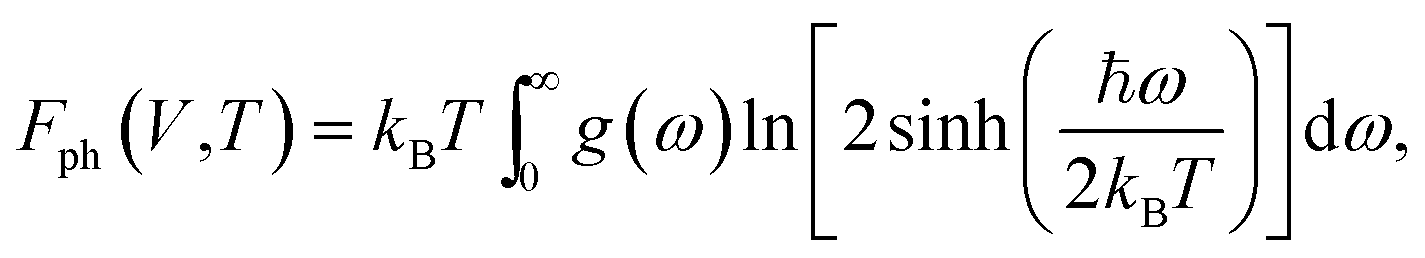
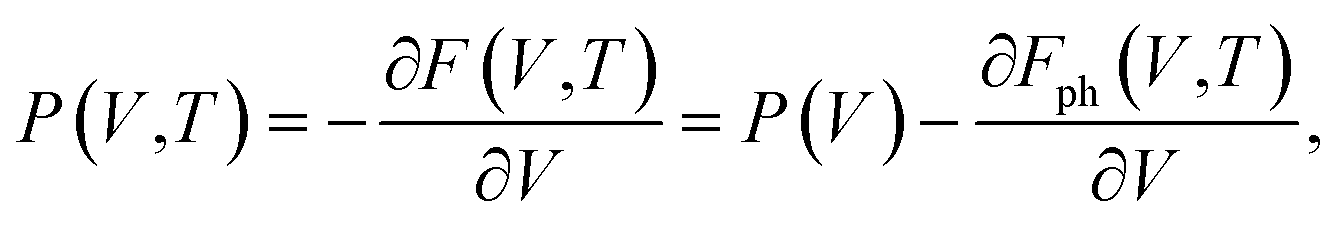
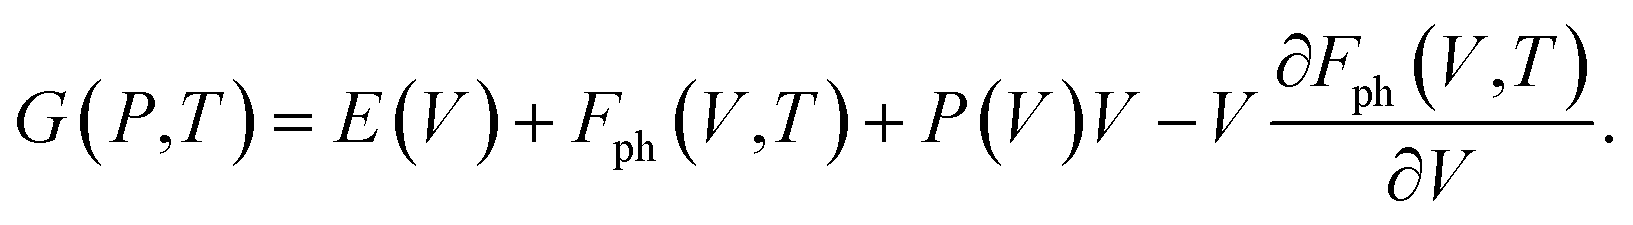
To verify the dynamical stability of the predicted structures, phonon dispersions and phonon density of states were calculated using the finite-displacement supercell method.21 Moreover, the phase stabilities of the predicted structures under different pressures and temperatures were also verified by comparing the differences of Gibbs free energies (ΔG) between those structures. The Gibbs free energies, G(P,T), as a function of pressure and temperature were calculated using the standard thermodynamic relations G = F + PV, and the thermodynamic calculations were conducted based on the QHA.22 Helmholtz free energies, F(V,T), were calculated as
| F(V,T) = E(V) + Fph(V,T), | (3) |
 | (4) |
| G(P,T) = E(V) + Fph(V,T) + P(V,T)V, | (5) |
 | (6) |
 | (7) |
In eqn (7), E(V) and P(V) were obtained from the DFT calculations that were fitted using the third-order Birch–Murnaghan equations of states and Fph(V,T) was obtained from eqn (4). The relationships between Fph(V,T) and V for various volumes at the same temperature were obtained from using the third-order polynomial fitting and then calculating the last term of ∂Fph(V,T)/∂V at various temperatures T. Finally, the relationships between G(P,T) and P at the same temperatures were also fitted using the third-order polynomial function in order to calculate the G(P,T) for each structure at given pressures and temperatures.
In order to investigate the electronic properties and bonding in the predicted structures of Na2O2 at high pressures, the electronic band structures and the partial density of states (PDOSs) were determined using the PBE14 and HSE06![[thin space (1/6-em)]](https://www.rsc.org/images/entities/char_2009.gif) 24 functionals. The HSE06 band structures and their PDOSs were calculated using the relaxed structures obtained from the PBE functional. Furthermore, ELFs were also calculated to describe the pressure effect on the chemical bonding in the Amm2 phase of Na2O2.
24 functionals. The HSE06 band structures and their PDOSs were calculated using the relaxed structures obtained from the PBE functional. Furthermore, ELFs were also calculated to describe the pressure effect on the chemical bonding in the Amm2 phase of Na2O2.
3 Results and discussion
3.1 Structural phase transitions and phase stabilities
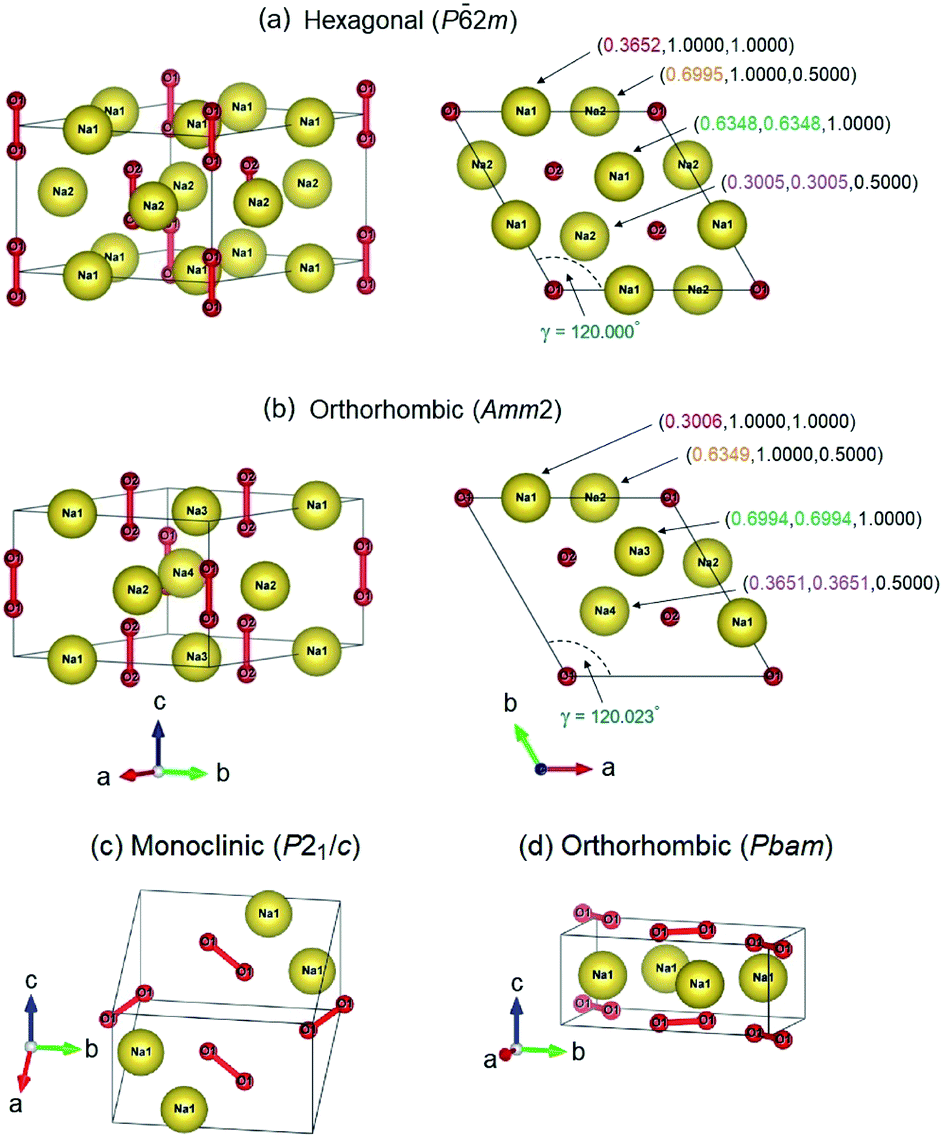
2m structure (3 f.u. per cell) and the orthorhombic Amm2 structure (6 f.u. per cell), when their enthalpy difference is only 2 meV f.u.−1 (Fig. 1). However, the Amm2 structure is a slightly distorted version of the P2m structure because the P2m structure can be relaxed to be the Amm2 structure, and their simulated X-ray diffraction (XRD) patterns are slightly different (Fig. S1(a), ESI†). Moreover, the two crystal structures which are the monoclinic P21/c structure (2 f.u. per cell) and the orthorhombic Pbam structure (2 f.u. per cell) are also found at 30 GPa (Fig. 1). The enthalpy difference between the P21/c and Pbam structures is small. Nevertheless, the XRD patterns of both structures are significantly different (Fig. S1(b)†). Furthermore, the P21/c structure is dynamically stable at 30 GPa but unstable at 40 GPa, while the Pbam structure is dynamically stable at 30–300 GPa (Fig. S2, ESI†). Here the Pbam structure is same as the structure proposed by Deng et al.10 when the structure is shifted to (0, 0, 1/2).
 | ||
| Fig. 1 The crystal structures: (a and b) the P2m and the primitive Amm2 structures viewed along two directions at ambient pressure. The mapping of atomic positions for the Na atoms marked by the same color. (c) The P21/c structure at 22 GPa, and (d) the Pbam structure at 28 GPa. | ||
Moreover, the AIRSS results at ambient pressure revealed that the simulated XRD patterns of the structures look like the XRD patterns calculated from the experimental results of Tallman et al.8 One is the I4/mmm structure which is approximate to the Na2O2-II at 550 °C (Fig. S3, ESI†), and the other structures (C2/m, Pmmm, and Immm) are close to the Na2O2-Q at room temperature (Fig. S4, ESI†). The I4/mmm structure is higher enthalpy than the P2m structure by 0.560 eV f.u.−1, while the C2/m, Pmmm, and Immm structures are higher enthalpy than the P2m structure by 0.018, 0.019, and 0.021 eV f.u.−1, respectively. With increasing pressure, these structures have increasing trends of enthalpy with respect to the P2m structure in the pressure range of 0–22 GPa, and they have increasing trends of enthalpy with respect to the P21/c and Pbam structures in the pressure range of 22–100 GPa as well (Fig. S5, ESI†). This suggests that these structures become more unstable with elevated pressure. Therefore, at high temperature below the melting point of 948 K, the I4/mmm structure might be a candidate for the Na2O2-II phase, whereas the C2/m, Pmmm, and Immm structures might be candidates for the Na2O2-Q phase. Generally, the symmetry of the crystal structure can be increased by increasing the temperature. Thus, the Immm structure may become stable at a high temperature as it is higher symmetry than the other structures.
Using geometry optimization, the Amm2 structure at 0 GPa has an energy lower than that of the P2m structure by 2.1 and 0.4 meV f.u.−1 calculated by the GGA–PBE14 and LDA25,26 functionals, respectively. These energies are slightly significant within the tolerance of the calculations. Herein the PBE functional was selected to quantify the energy difference between the Amm2 and P2m structures. Furthermore, the relaxed lattice parameters for the P2m structure are in agreement with previous studies:2,5,6,27a = b = 6.282 Å, c = 4.511 Å, and γ = 120.000°. The Amm2 structure can be reduced to a primitive cell with the relaxed lattice parameters, a = b = 6.284 Å, c = 4.510 Å, and γ = 120.023°, which are slightly different from those of the P2m structure (Fig. 1). These lattice parameters also support that the Amm2 structure is the distorted P2m structure. Moreover, we found that there are angle differences in the same hexagonal Na layer between the 2 × 2 × 2 supercell of the primitive Amm2 and the P2m structures that were verified dynamically. The angles in the hexagonal Na layer of the P2m structure are 60.000°, 55.031°, 60.000°, 55.031°, 60.000°, and 69.938° as marked by θ1, θ2, θ3, θ4, θ5, and θ6, respectively (Fig. S6(a), ESI†). These angles indicate that the P2m structure has the distorted close-packed Na layers. However, these angles are slightly different from that of the primitive Amm2 structure. The angles of the Amm2 structure are 59.995°, 55.060°, 60.003°, 55.059°, 60.003°, and 69.881° as marked by θ1, θ2, θ3, θ4, θ5, and θ6, respectively (Fig. S6(b), ESI†). In addition, these angles have three trends of change with elevated pressure consisting of an increase of θ6, a decrease of θ2 and θ4, and no change in θ1, θ3, and θ5. The differences in these angles between both structures at the same pressures are shown in Fig. S7, ESI.† This suggests that the primitive Amm2 structure is a more distorted close-packed Na layer than the P2m structure (deviation from 60°). These suggest that the Amm2 (distorted P2m) structure is slightly different to the P2m structure. However, this results in significant differences in their phonon dispersions and their electronic band structures, which will be discussed, respectively. Consequently, it is possible that the Na2O2 phase at extremely low temperature favors the lower symmetry (Amm2, No. 38) rather than the higher symmetry (P2m, No. 189).
Moreover, Fig. 2 also shows differences in the phonon dispersion and the partial phonon density of states between the primitive Amm2 and the P2m structures at ambient pressure. At the Γ point, the phonon frequencies of the Amm2 structure at ∼23.3 and ∼23.5 THz have higher values than those of the P2m structure, of about 5 and 4 cm−1, respectively, while the highest frequency of both structures are slightly different. Because these phonon frequencies directly relate to the O–O stretching modes, they suggest that the O–O bonding in the Amm2 structure at ambient pressure is stronger than that of the P2m structure. Furthermore, the phonon frequencies below 5 THz at the Γ, Y and S points of the Amm2 structure are less than those of the P2m structure at the Γ, K, and M points, respectively. Although both structures were different, there was no imaginary phonon frequency in both curves indicating the dynamical stability of the Amm2 and P2m structures at 0 K. Moreover, as there were several different phonon frequencies, it is possible to have different Helmholtz free energies at elevated temperature.
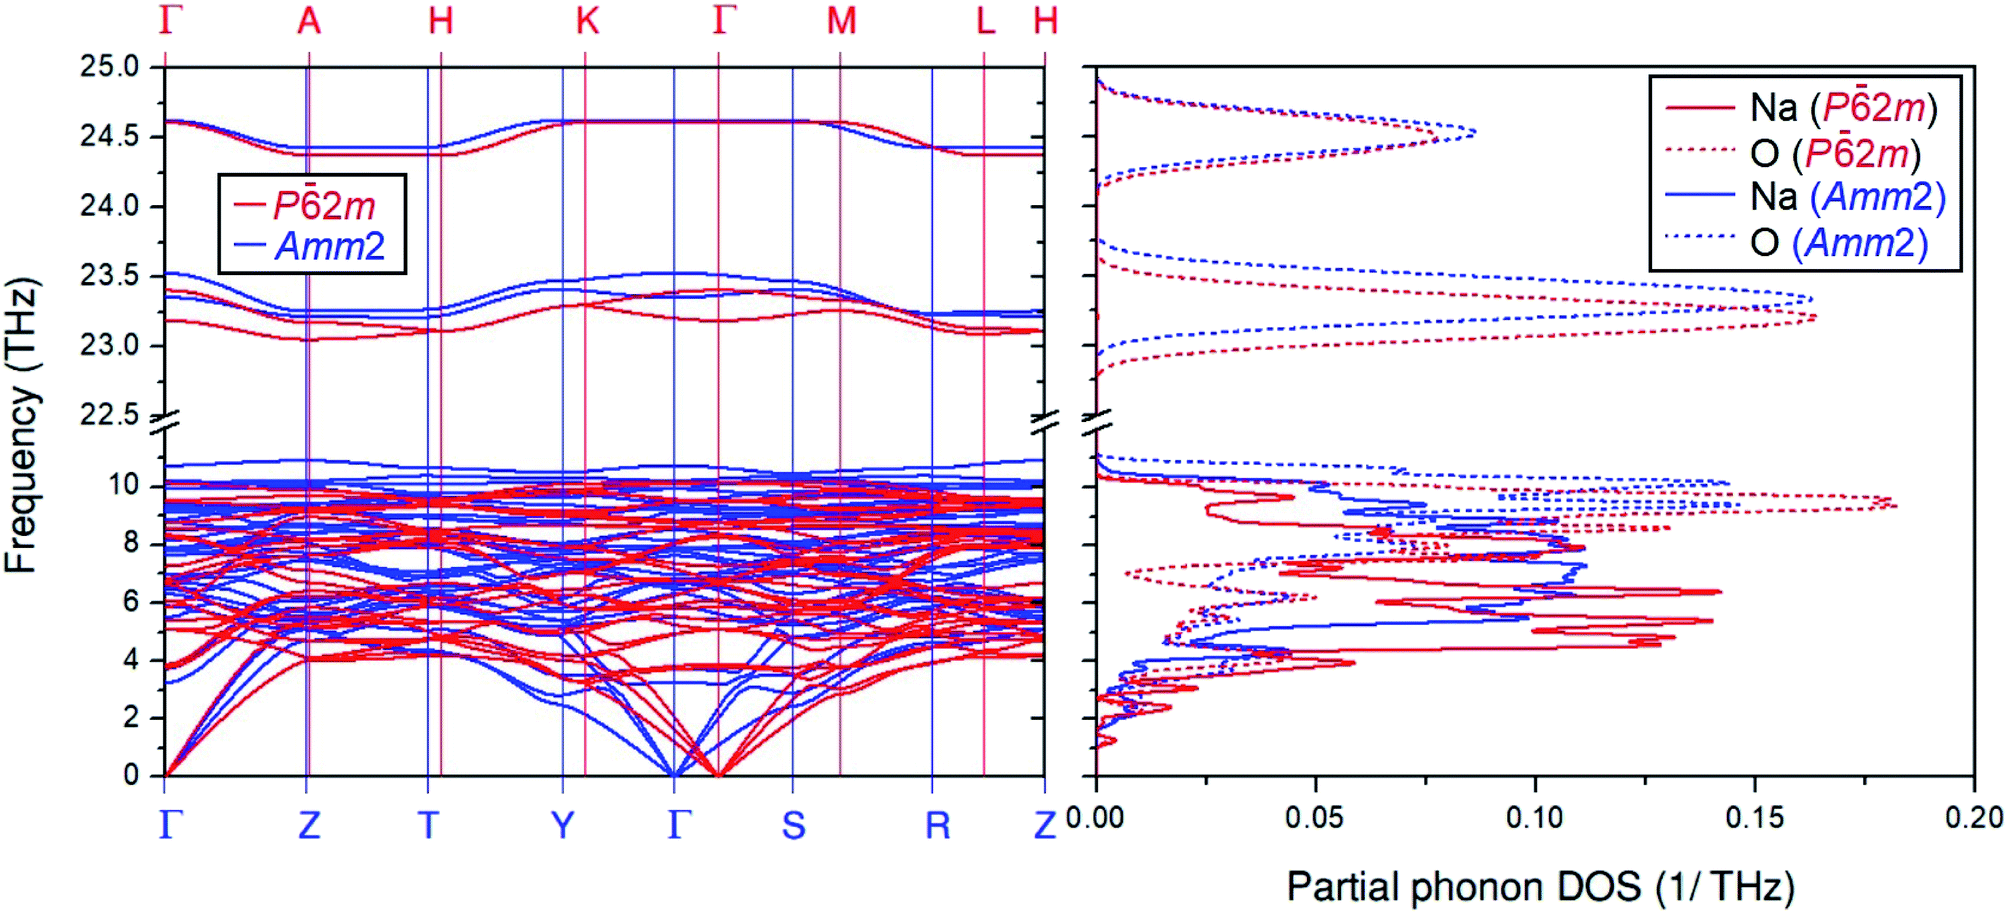 | ||
| Fig. 2 The overlay plot of the phonon dispersion curves for the primitive Amm2 and the P2m structures and their overlay plot of the partial phonon density of states. The blue and red lines represent the primitive Amm2 and the P2m structures, respectively. | ||
In addition, the formation enthalpy of Na2O2, Na2O, and NaO2 compounds at 0 K and the selected pressures of 0, 10, 20, 30, and 50 GPa were calculated to verify the phase stability of Na2O2 using the formula: ΔHf = [H(NaxOy) − xH(Na) − yH(O)]/(x + y), where H(NaxOy) is the enthalpy of the considered compound, while H(Na) and H(O) are the enthalpy of Na and solid O, respectively. The findings suggest that Na2O2 is more stable with increasing pressure against decomposition into Na and O2 (Fig. 3(a)). Similarly, the enthalpies of Na2O + O, NaO2 + Na, and (2/3)Na2O + (2/3)NaO2 at the same pressures are higher than that of Na2O2, and these enthalpy differences become greater with elevated pressure (Fig. 3(b)). These suggest that Na2O2 is still stable against decomposition over the pressure range studied.
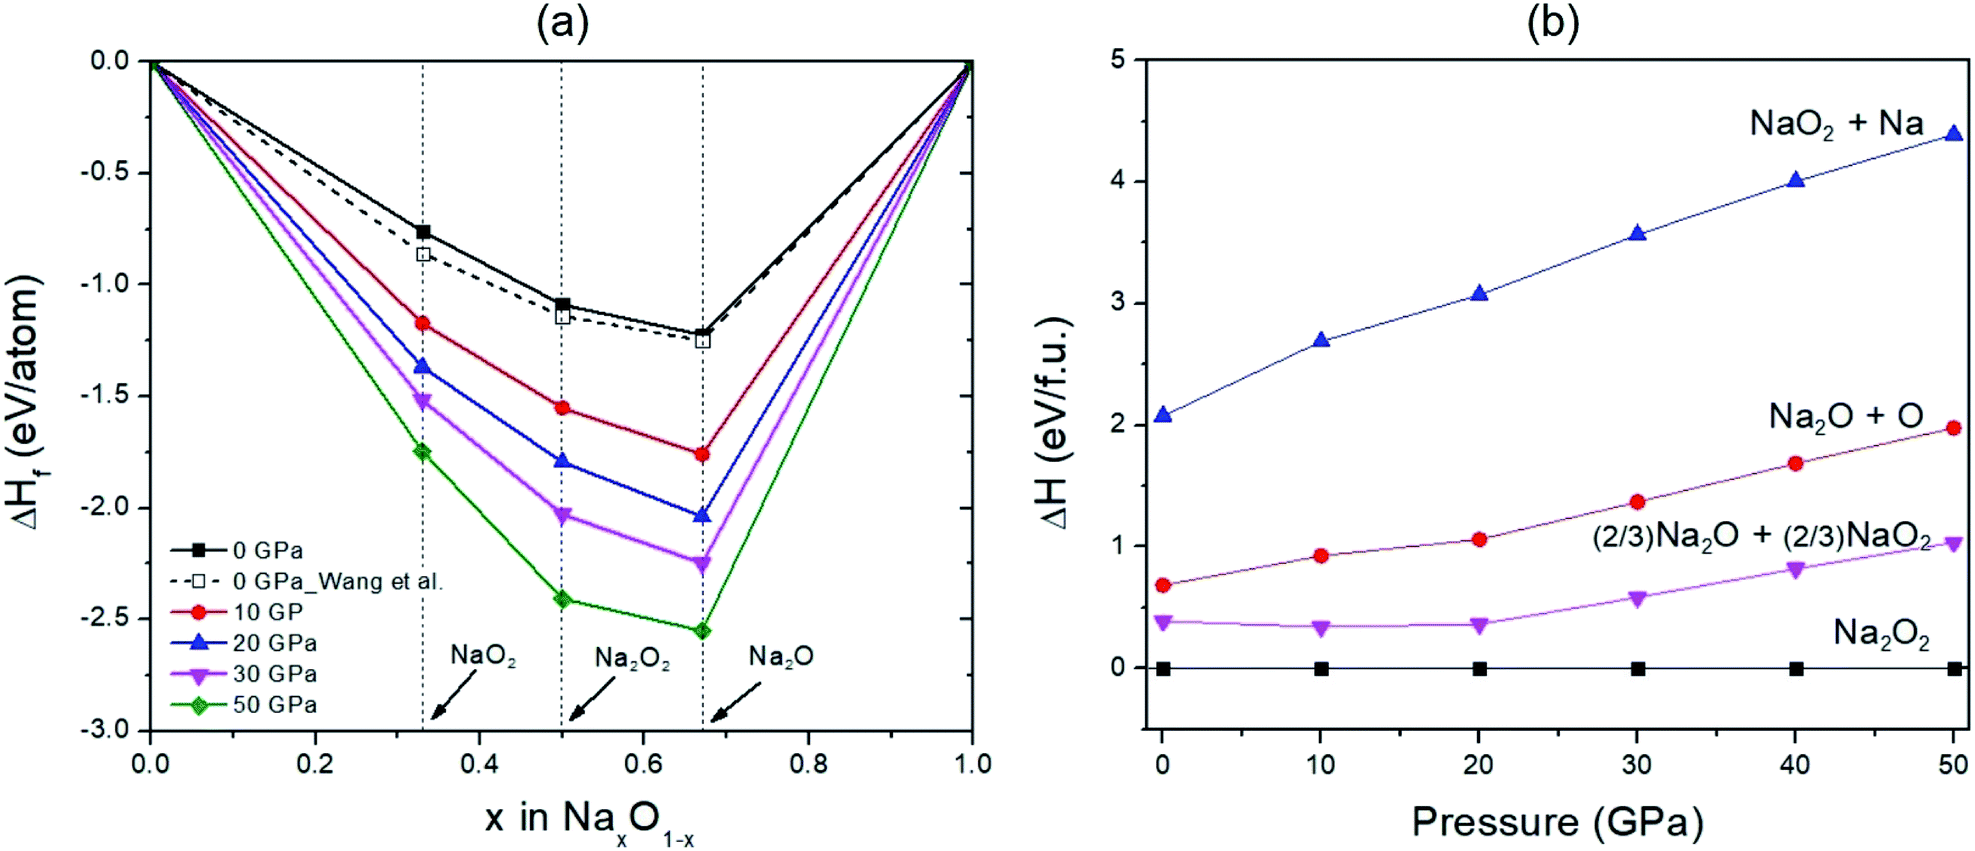 | ||
| Fig. 3 (a) Predicted formation enthalpy of Na–O compounds at different pressures with respect to decomposition into Na and O2. Dashed and solid lines connecting the data points denote the convex hull. The white squares represent the results predicted by Wang et al.35 (b) Relative enthalpy of the decomposition with respect to Na2O2 in the pressure range of 0–50 GPa. | ||
In order to investigate the structural phase transitions in Na2O2 under high pressure, the enthalpy differences of the various structures versus pressure were calculated (Fig. 4). The findings revealed that the enthalpies of the Amm2 structure have lower values than those of the P2m structure over the pressure range with values of 2 meV f.u.−1 at 0 GPa and 1.6 meV f.u.−1 at 20 GPa. By comparing the total energy (E) and the work done (PV), we found that all E of the Amm2 structure are lower than those of the P2m structure, whereas its PV values are higher (Fig. S8, ESI†). This implies that the PV plays a key role as a driving force for the high-pressure structural phase transition of the Amm2 structure at 0 K. However, the Amm2 structure becomes higher enthalpy than the P21/c structure at 22 GPa (Fig. 4). The lower enthalpy of the P21/c structure is maintained in the short pressure range of 22–28 GPa because the Pbam structure becomes a lower enthalpy structure at 28 GPa. There was no imaginary phonon frequency in the phonon dispersion curve of the P21/c structure at 22 GPa and the Pbam structure at 28 GPa, which satisfies the dynamical stability (Fig. S2(a) and (c), ESI†). Thus, the first structural phase transition is predicted at 22 GPa, the Amm2 structure transforming to the P21/c structure, and the second structural phase transition is predicted at 28 GPa, the P21/c structure transforming to the Pbam structure. The transition pressure at 28 GPa is the same value as predicted by Deng et al.10
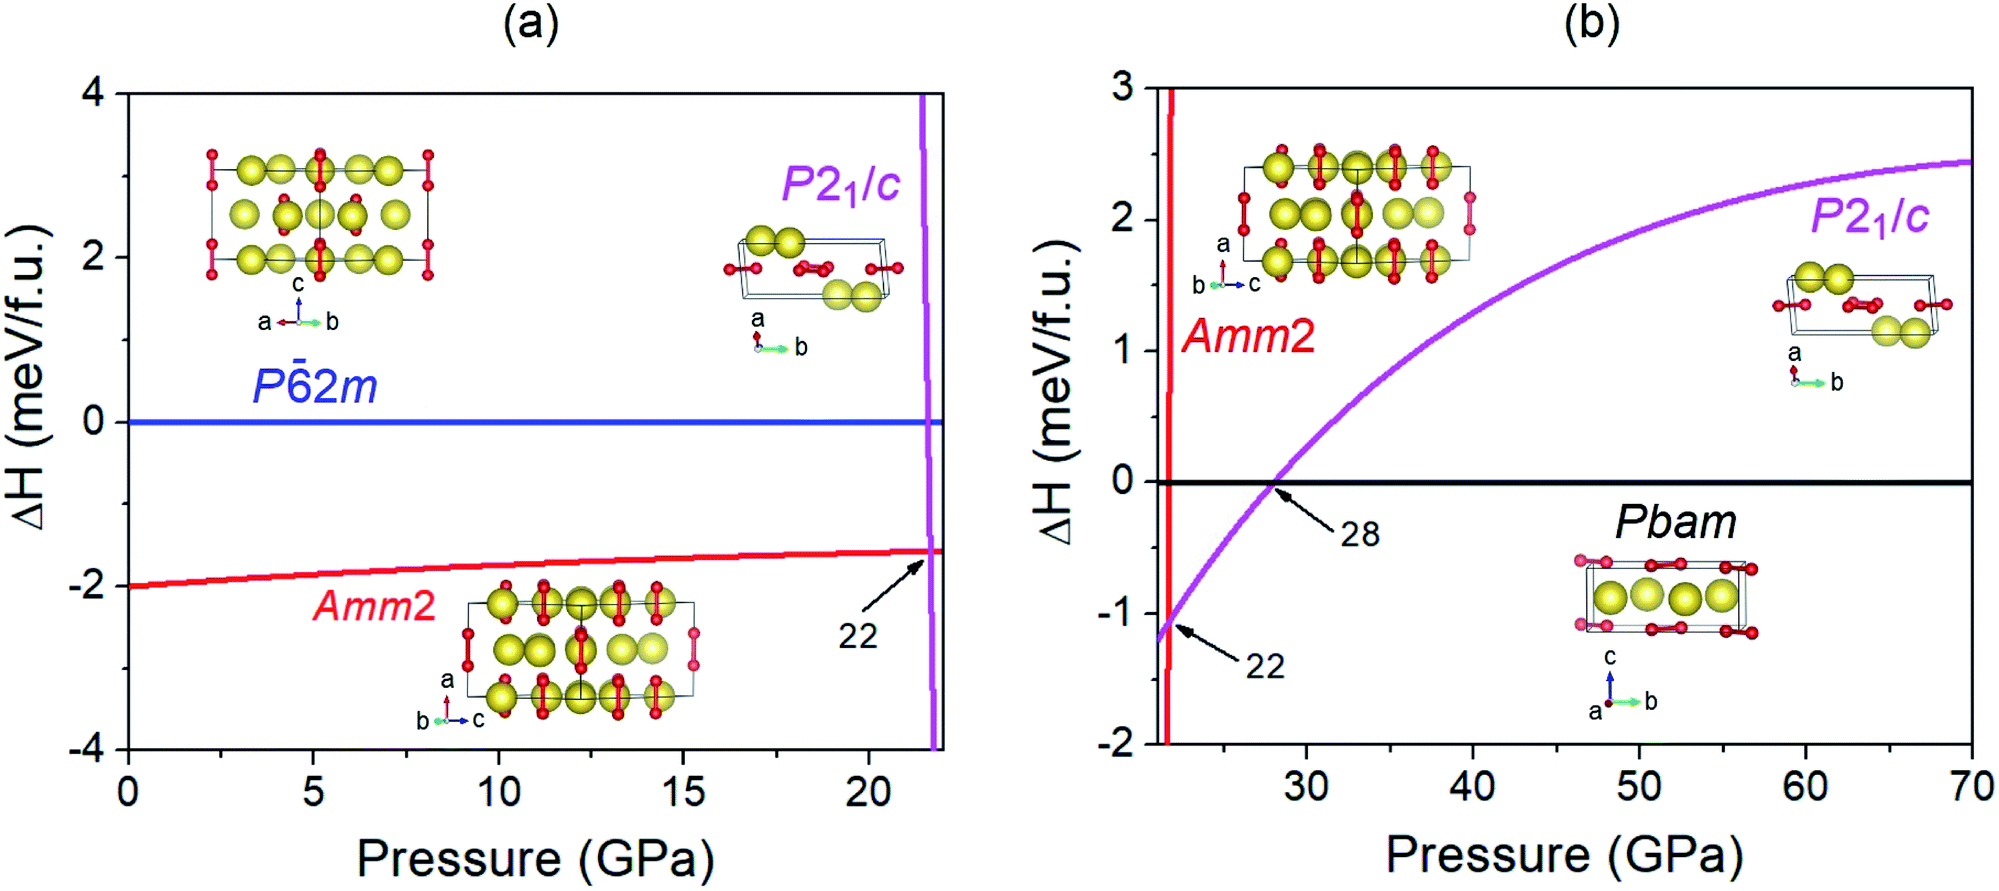 | ||
| Fig. 4 (a) The enthalpy differences (ΔH) for the Amm2 and P21/c structures with respect to the P2m structure versus pressure from 0 to 22 GPa and (b) the enthalpy differences (ΔH) for the Amm2 and P21/c structures with respect to the Pbam structure versus pressure from 22 to 70 GPa. Large and small spheres in all crystal structures represent the Na and O atoms, respectively. | ||
To investigate the driving force for the structural phase transitions, the changes of lattice constants and volume for the Amm2, P21/c, and Pbam structures at high pressures were considered (Fig. S9, ESI†). At the first transition pressure of 22 GPa, the lattice constants (b, c) and volume (V) of the P21/c structure collapsed at γ = 141.583° by about 31.4, 37.1, and 10.0% compared to the Amm2 structure, respectively. However, the lattice constant a was extended by about 11.8%. This suggests that the driving force at 22 GPa strongly affects the bc-plane. At the second transition pressure of 28 GPa, a, b, and c of the Pbam structure collapsed by about 21.8, 0.0, and 20.4% compared to the P21/c structure at γ = 141.483°, respectively. Although there was no collapse in the b-axis and volume, the fact that the a-axis collapsed rather than the c-axis leads to the alignment of the peroxide groups on the (001) plane of the Pbam structure (Fig. S11(d), ESI†).
Considering the peroxide groups’ (O–O single bonds) alignment in each phase of Na2O2 (Fig. S11, ESI†), the peroxide groups in the Amm2 structure aligned in parallel with the [100] direction, whereas they aligned in parallel with the [001] direction in the P2m structure. In the case of the P21/c structure at 22 GPa, the peroxide groups tilted with an angle of ∼24° with respect to the ab-plane and deviated from the [100] direction by ∼39°. As for the Pbam structure at 28 GPa, the peroxide groups aligned on the (001) plane but deviated from the [100] direction by ∼52°. Moreover, at 300 GPa, the peroxide group alignment was not different from that at 28 GPa. This suggests that the alignment of the peroxide groups for each phase is significantly different, which may affect the thermodynamic stability of these structures.
2m structure at 0, 5, 10, 15, and 20 GPa have higher values than those of the P2m structure at the transition temperature around 120, 125, 185, 200, and 75 K, respectively (Fig. 5(a)). This suggests that the P2m structure becomes thermodynamically stable at these conditions. That is why the P2m structure has been found to be stable at room temperature by previous measurements.5,6 Similarly, at 22 GPa, the P21/c structure at below 105 K has the lowest free energy compared to the other structures, while the Pbam structure becomes the lowest free energy structure in the temperature range from 105 to 600 K (Fig. S12(b), ESI†). Moreover, at 28 GPa, the Pbam structure is thermodynamically stable in the temperature range of 0–600 K (Fig. S12(c), ESI†). Based on these findings, the predicted P–T phase diagram of Na2O2 was constructed as shown in Fig. 5(b).
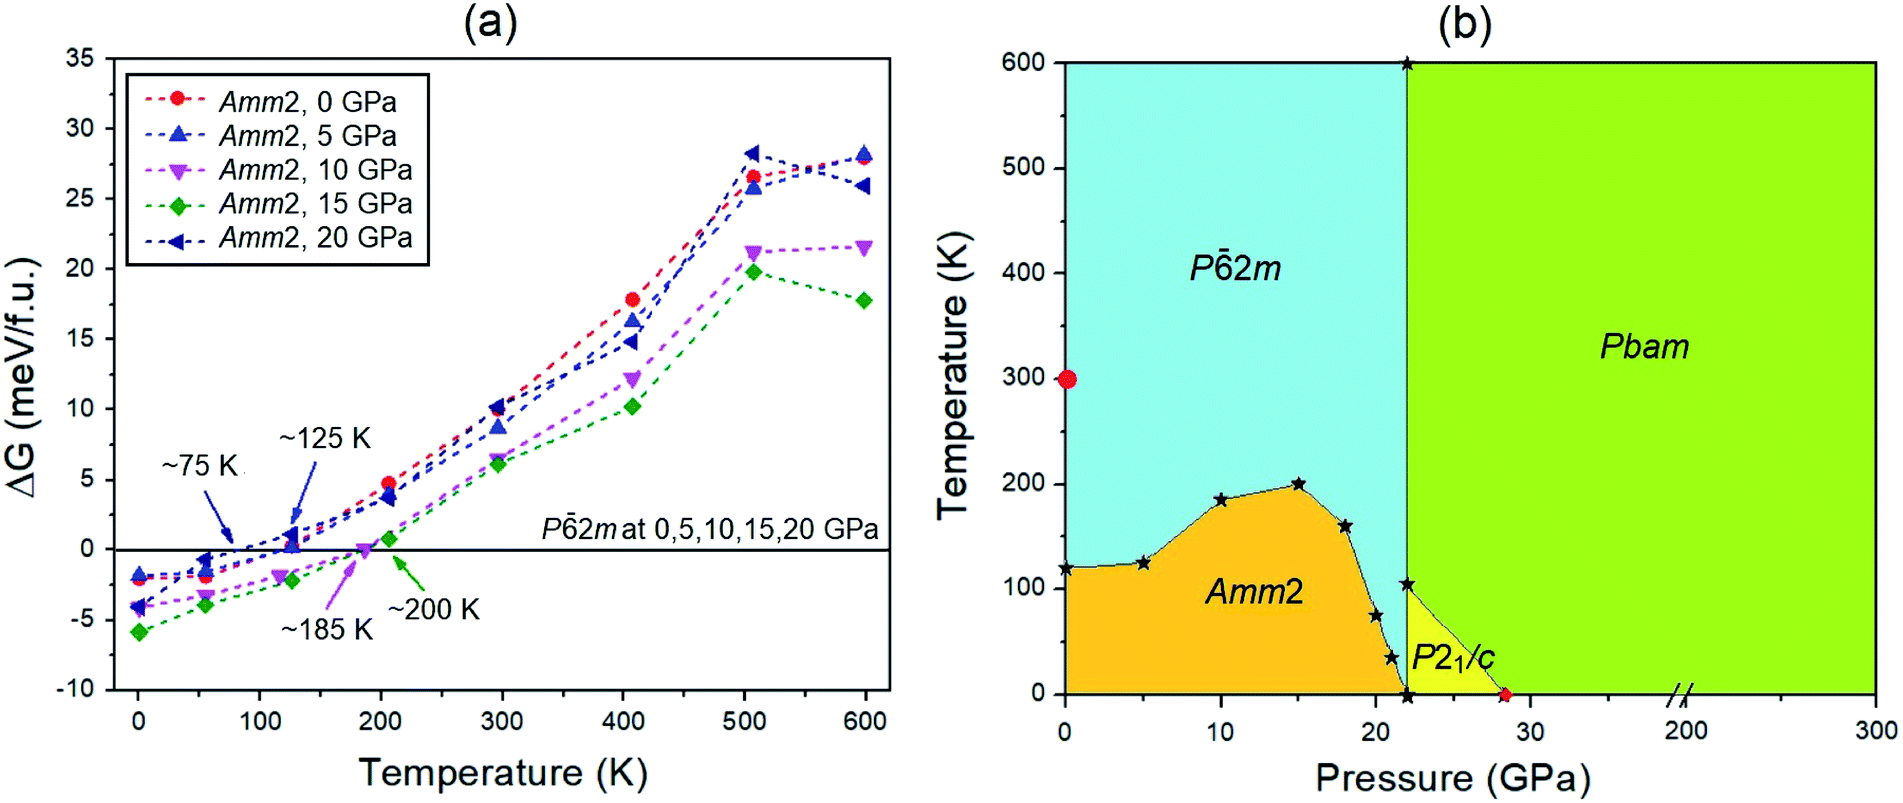 | ||
| Fig. 5 (a) Gibbs free energy changes of the Amm2 structure compared to the P2m structure at the same pressures (0, 5, 10, 15, and 20 GPa) in the temperature range of 0–600 K. (b) The predicted phase diagram of Na2O2 in the pressure range from 0 to 300 GPa and at temperatures up to 600 K. The circle indicates the P2m structure at ambient conditions measured by Tallman et al.5 and Föppl.6 The diamond represents the Pbam structure predicted by Deng et al.10 | ||
As for the P2m structure, although there was no difference in the P2m structures at 0 K and ambient pressure that were obtained from the AIRSS searches and the relaxed Tallman’s/Föppl’s structures, there was a small significant atomic displacement of the Na1 and Na2 atoms between the Tallman’s and Föppl’s structures at room temperature (Fig. S13, ESI†) as discussed before. The consequence is the small difference in the XRD pattern between both structures (Fig. S14, ESI†). In particular, the intensity of the (100) peak of Tallman’s structure is higher than that of Föppl’s structure by about 2 percent. These suggest that Tallman’s and Föppl’s structures observed at room temperature are slightly different. To identify the most stable structure at elevated temperature, we calculated the Gibbs free energy for the relaxed Tallman’s and Föppl’s structures at ambient pressure as a function of temperature up to 600 K. The findings revealed that the free energy of Tallman’s structure is not different to that of Föppl’s structure in the temperature range of 0–45 K, yet it becomes lower than that of Föppl’s structure by ∼1.7 and 4 meV f.u.−1 at 300 and 550 K, respectively (Fig. S15, ESI†). Theoretically, this suggests that Tallman’s structure is likely favored over Föppl’s structure at higher temperatures. However, the free energy differences are very small and are beyond experimental resolution. Therefore, Tallman’s and Föppl’s structures should be considered to be similar.
3.2 Elastic behavior at high pressures
The present work determined the elastic constants, elastic anisotropy, and elastic moduli of the Amm2 and P2m structures in order to analyze the elastic properties of both structures at high pressures. In addition, the elastic stabilities for both structures were also verified. Theoretically, the hexagonal P2m structure has five independent elastic constants: C11, C33, C44, C12, and C13, while the orthorhombic Amm2 structure has nine independent elastic constants: C11, C22, C33, C44, C55, C66, C12, C13, and C23. The elastic stability conditions for hexagonal and orthorhombic crystal systems under hydrostatic pressure (P) are given by B11 > |B12|, 2B132 < B33(B11 + B12), and B44 > 0 for the hexagonal case and B11 > 0, B44 > 0, B55 > 0, B66 > 0, B11B22 > 2B122, B11B22B33 + 2B12B13B23 − B11B232 − B22B132 − B33B122 > 0 for the orthorhombic case, where Cij and Bij are the elastic constants and elastic stiffnesses, respectively.28 The Bij are calculated from the expressions as the following: Bii = Cii − P, B12 = C12 + P, B13 = C13 + P, and B23 = C23 + P, where i = 1, 2, 3, …, 6.29
The findings revealed that the elastic stiffnesses of the P2m and Amm2 structures satisfy their elastic stability conditions. This indicates that both structures are mechanically stable. Moreover, the elastic stiffnesses also demonstrate the slight difference between the P2m and Amm2 structures at pressures from 0 to 15 GPa (see Fig. 6). Generally, the trend is that the elastic stiffnesses increase with increasing pressure, which indicates that the P2m and Amm2 structures stiffen with increasing pressure. Nevertheless, B44 of the Amm2 structure and the (B11 − B12)/2 term of the P2m structure have decreasing trends with elevated pressure. This leads to elastic instability for the P2m structure when B12 exceeds B11, which called tetragonal shear instability.30 Likewise, the Amm2 structure has shear instability when B44 is equal to zero. Using linear approximation, the elastic instability of both structures was found at around 35 GPa, which is higher than the predicted transition pressure of 22 GPa. However, elastic instability occurring at a higher pressure than the transition pressure which satisfied the thermodynamic stability condition has also been proposed in other ionic compounds such as MgO and CaO. It has been interpreted that the existence of a significant activation barrier along the phase transformation path leads to the inconsistent transition pressure.30 Interestingly, B11 of the Amm2 structure and B33 of the P2m structure stiffen dramatically at 2 GPa and then soften at 3 GPa corresponding to the unusual decreasing of the interatomic distances of O1–O1 and O2–O2 at 3 GPa (Fig. S10(a), ESI†). Moreover, B22, B23, and B44 of the Amm2 structure, and B12 and B33 of the P2m structure at 9 GPa also soften slightly. This suggests that the Amm2 structure has more elastic deformation than the P2m structure, which may lead to thermodynamic instability at the transition temperature.
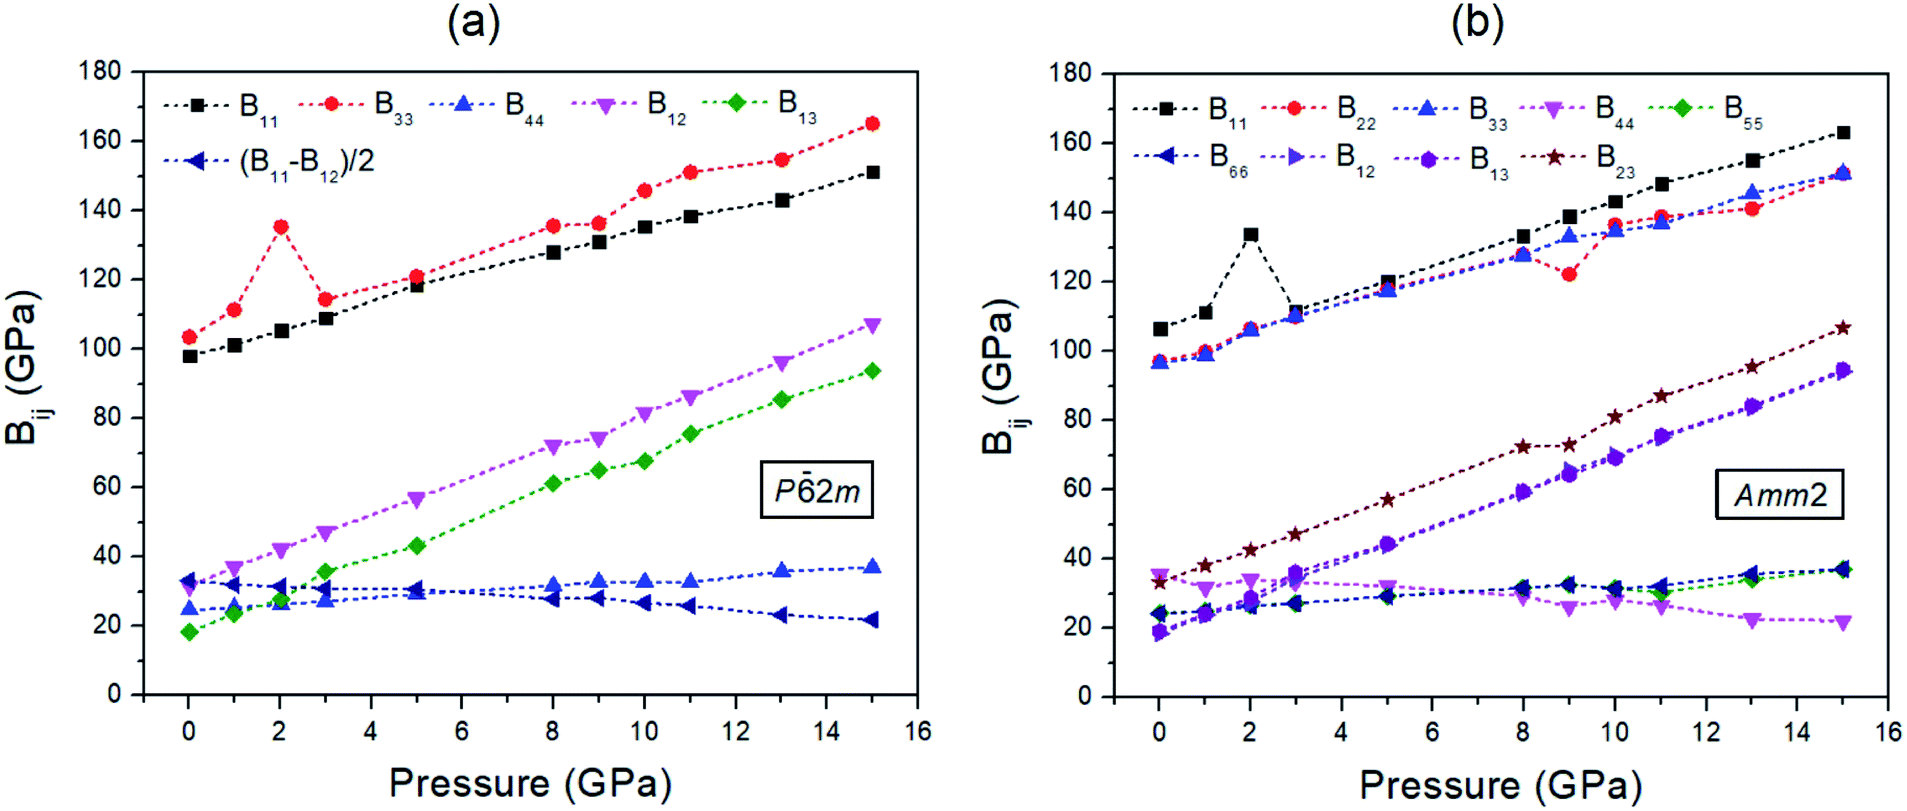 | ||
| Fig. 6 The elastic stiffnesses (Bij) of two crystal structures at pressures ranging from 0 to 15 GPa for: (a) the P2m structure and (b) the Amm2 structure. | ||
To quantify the effect of pressure on the elastic anisotropy of the crystal structures, the universal elastic anisotropy index (AU) of the Amm2 and the P2m structures were calculated using eqn (2). At ambient pressure, the AU of the Amm2 and P2m structures were slightly different with values of 0.28 and 0.24, respectively (see Fig. S16, ESI†). The AU of the P2m structure corresponds to that of 0.22 calculated by the previous study.31 At elevated pressure, the AU of both structures decreased up to 8 GPa, and then it became increasing at around 9 GPa. Moreover, AU significantly increased at 2 GPa and drastically decreased at 3 GPa, which is consistent with the changes of the elastic stiffnesses at 2 and 3 GPa. Higher values of AU indicate increasing elastic anisotropy, and when AU = 0 the structure is a locally isotropic crystal.19 Thus, the findings suggest that pressure induced the changes of elastic anisotropy in the Amm2 and P2m phases of Na2O2, and their AU are very close to that of a locally isotropic crystal with AU = 0.03 at 9 GPa, similar to other hexagonal crystals (e.g., Ru, α-Hf, and α-Gd).19
In addition, the calculated bulk and shear moduli of the Amm2 and P2m structures at ambient pressure are shown in Table S2, ESI.† The findings demonstrated that the bulk and shear moduli of the Amm2 and P2m structures at ambient pressure are slightly different. It is known that the elastic moduli calculated by LDA are usually overestimates, whereas those of GGA are underestimates.32 Based on this reason, our results suggest that the measured bulk (K) and shear moduli (G) at ambient pressure should be K = 49.15–64.55 GPa and G = 30.49–39.29 GPa for the Amm2 structure, and K = 48.95–64.73 GPa and G = 29.01–37.88 GPa for the P2m structure, respectively. Compared to the bulk moduli (B0) obtained from the third-order Birch–Murnaghan equations of state, B0 for the Amm2 and P2m structures were 49.25 and 49.26 GPa, respectively. These values are in excellent agreement with the previous studies with the value of 49 GPa (ref. 31) obtained from the elastic constants calculations and 56.40 GPa (ref. 2) obtained from the third-order Birch–Murnaghan equations of states. Based on the PBE functional using single-point energy calculations, the calculated bulk and shear moduli at room temperature were 55.82 GPa and 31.14 GPa for the P2m structure proposed by Tallman et al.,5 and 57.16 GPa and 32.11 GPa for the P2m structure proposed by Föppl et al.,6 respectively. This demonstrates the small significant difference under the upper and lower bounds on the bulk and shear moduli for the P2m structure. It is possible to note that the elastic properties of Tallman’s and Föppl’s structures at room temperature are slightly different.
3.3 Vibrational properties at high pressures
Although the Amm2 and P2m structures were slightly different, there was a significant difference in their vibrational properties. Using the group theory analysis of eigenvectors, the results revealed that the vibrational modes of the Amm2 structure at the Γ point consist of B1, B2, A1, and A2 modes with 36 frequencies. The phonon acoustic modes are Γact = B1 + B2 + A1, while the phonon optical modes are Γopt = 9B1 + 8B2 + 10A1 + 6A2. In the case of the P2m structure, the vibrational modes consist of  , E′,
, E′,  ,
,  ,
,  , and E′′ modes with 36 frequencies as well. The phonon acoustic modes are
 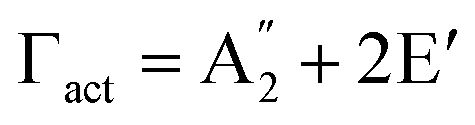 , whereas the phonon optical modes are
 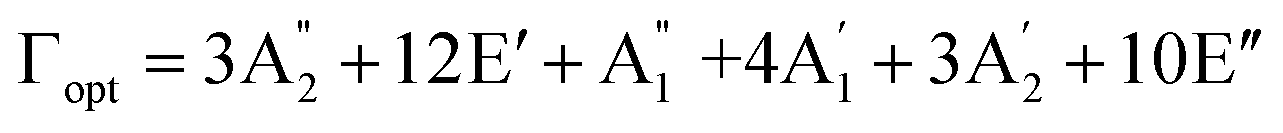 . We here predicted that there are differences in the phonon frequencies in each mode and activity in the IR and Raman spectra between the Amm2 and the P2m structures at ambient pressure (see Table S3, ESI†). That is, all of the phonon frequencies in the optical modes of the Amm2 structure at the Γ point are Raman active, while for the P2m structure some of them are Raman active consisting of E′,
  , and E′′ modes only. Similarly, only the optical modes of
  and E′ for the P2m structure are IR active, whereas all of the optical modes for the Amm2 structure are IR active, except the A2 mode. These results suggest that it is possible to observe the Amm2 structure using IR and Raman spectroscopies at temperatures below 120 K. In addition, Table S3 (ESI†) also provided the phonon frequencies in each vibrational mode, IR and Raman active modes for the P21/c structure at 22 GPa and the Pbam structure at 30 GPa. These results might be useful for experimentally identifying the structural phase transitions at those pressures.
To discuss the effect of the elastic stiffness stiffening at 2 GPa and softening at 3 and 9 GPa in the Amm2 structure on phonon frequencies, we here considered the phonon dispersion curves and their phonon DOSs at 1, 2, 3, and 4 GPa and at 8, 9, 10, and 11 GPa as shown in Fig. 7. Moreover, we also plotted the phonon frequency shifts from that of 0 GPa versus pressure at the Γ and Y points in the pressure range of 0–15 GPa (Fig. 8). Normally, the phonon frequencies of a crystal structure increase with increasing pressure, which suggests the chemical bond stiffening. However, we found that three acoustic phonon frequencies (ω1, ω2, and ω3 in Fig. 8(b)) below 4 THz obviously decrease at 3 GPa around the Y and S points (Fig. 7(a)). These softening frequencies also appear in their phonon DOSs below 4 THz. Similarly, the two lowest of the optical phonon frequencies (ω4 and ω5 in Fig. 8(a)) near 4 THz at the Γ point significantly decrease at 3 GPa (Fig. 7(a)). However, although there was no unusual change in the three highest frequencies of the optical modes (ω34, ω35, and ω36) at those pressures, the increase of frequency from 2 to 3 GPa was slightly more than that from 1 to 2 GPa and 3 to 4 GPa, and similar to the increase of frequency from 9 to 10 GPa. Additionally there was an unusual decrease in the interatomic distances of the O1–O1 and the O2–O2 at 3 GPa (Fig. S10(a), ESI†). Furthermore, the phonon DOSs of the ω34 and/or the ω35 decrease significantly at 2 GPa (Fig. 7(a)). This may be a consequence of the increasing of the elastic stiffness B11 at 2 GPa. Likewise, at 10 GPa, the ω1 and ω3 below 5 THz obviously decrease around the Y point (Fig. 7(b)). In addition, these phonons softening result in the decreasing of the phonon free energy at 3 and 10 GPa with respect to the trend line (Fig. S17, ESI†) as well. However, this effect decreases with elevated temperature. Therefore, it is possible to note that the pressure induced the decreasing of elastic stiffness and the phonon softening resulting in the decreasing of phonon free energy at 3 and 10 GPa.
 | ||
| Fig. 7 Phonon dispersion curves and their phonon DOSs of the Amm2 structure: (a) at 1, 2, 3, and 4 GPa and (b) at 8, 9, 10, and 11 GPa. The phonon frequency modes in the phonon dispersion curves are distinguished by different colors. | ||
 | ||
| Fig. 8 The selected phonon frequency shifts versus pressure ranging from 0 to 15 GPa for 3 frequencies of the acoustic modes and 5 frequencies of the optical modes at different k-points of the Amm2 structure: (a) at the Γ point and (b) at the Y points. | ||
3.4 Electronic properties and chemical bonding
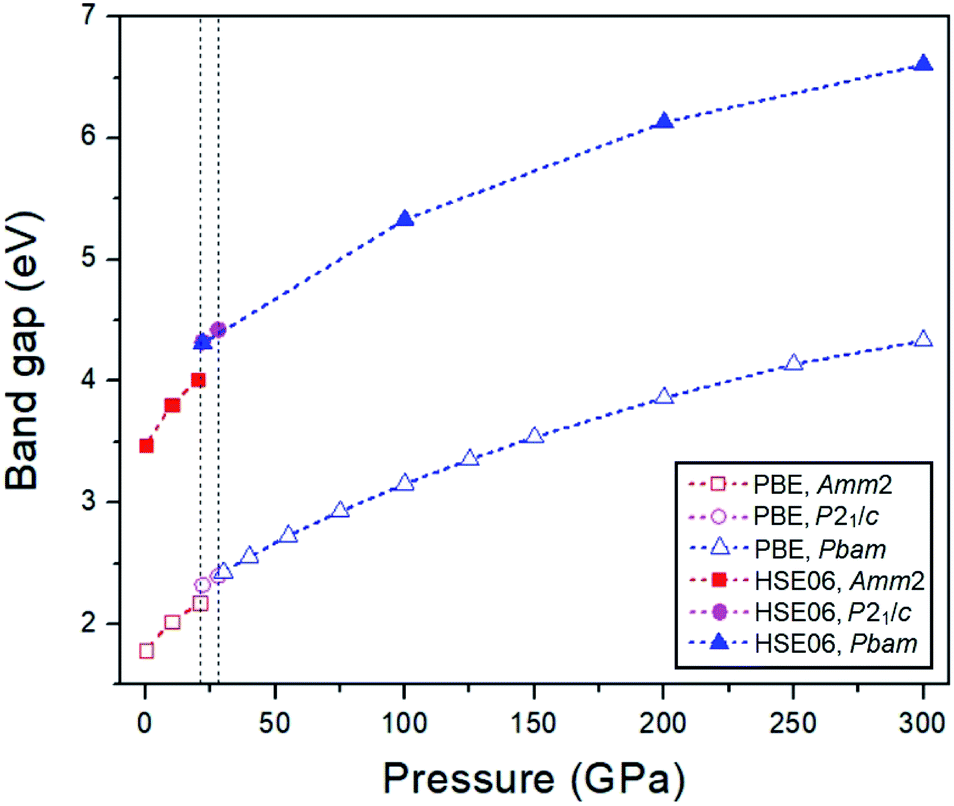
To investigate the electronic properties of Na2O2 under high pressure, the PBE and HSE06 functionals were employed to calculate the electronic band structures and the partial density of states (PDOSs) for the ground state of the Amm2, P2m, P21/c, and Pbam structures (Fig. 9). The difference in the band structures of the Amm2 and P2m structures at the T/H points is around −0.5 and −3.5 eV, at the Y/K points is around −0.7 and −4.5 eV, and at the Z/H point is around −0.4, −1.0, −3.3, and −4.0 eV (Amm2/P2m). Furthermore, the band structure of the Amm2 and P2m structures show indirect band gaps with the same value of 1.79 eV calculated by the PBE functional, while the band structure of the P21/c and Pbam structures suggest direct band gaps. Compared to the HSE06 band structure, the PBE band structure is similar. However, the HSE06 functional, which usually provides a more reliable band gap than the PBE functional, predicted that the band gap of the Amm2 structure is higher than that of the P2m structure by 2 meV. The PBE band gap of the P2m structure is consistent with the previous study with the value of 1.76 eV.33 At elevated pressure, the PBE and HSE06 band gaps of all structures have the same increasing trends (Fig. 10). However, the HSE06 band gap of the P21/c structure at 22 GPa is higher than that of the Pbam structure at about 13 meV, which suggests a difference between the structures.
 | ||
| Fig. 9 Electronic band structures and their PDOSs for 4 structures at different pressures: (a) the Amm2 structure at 0 GPa, (b) the P2m structure at 0 GPa, (c) the P21/c structure at 22 GPa, and (d) the Pbam structure at 28 GPa. | ||
 | ||
| Fig. 10 The PBE and HSE06 band gaps versus pressure for the Amm2, P21/c, and Pbam structures. | ||
As for the PDOSs of Na and O in the Amm2, P2m, P21/c, and Pbam structures (Fig. 9), they showed that the p-states of O mainly contribute to both the valence and conduction bands with small partial contributions from the p-states of Na, the s-states of Na, and a very small partial contribution from the s-states of O. Furthermore, the direct overlap of orbitals also suggests σ bonding of the O–O in these structures of Na2O2.
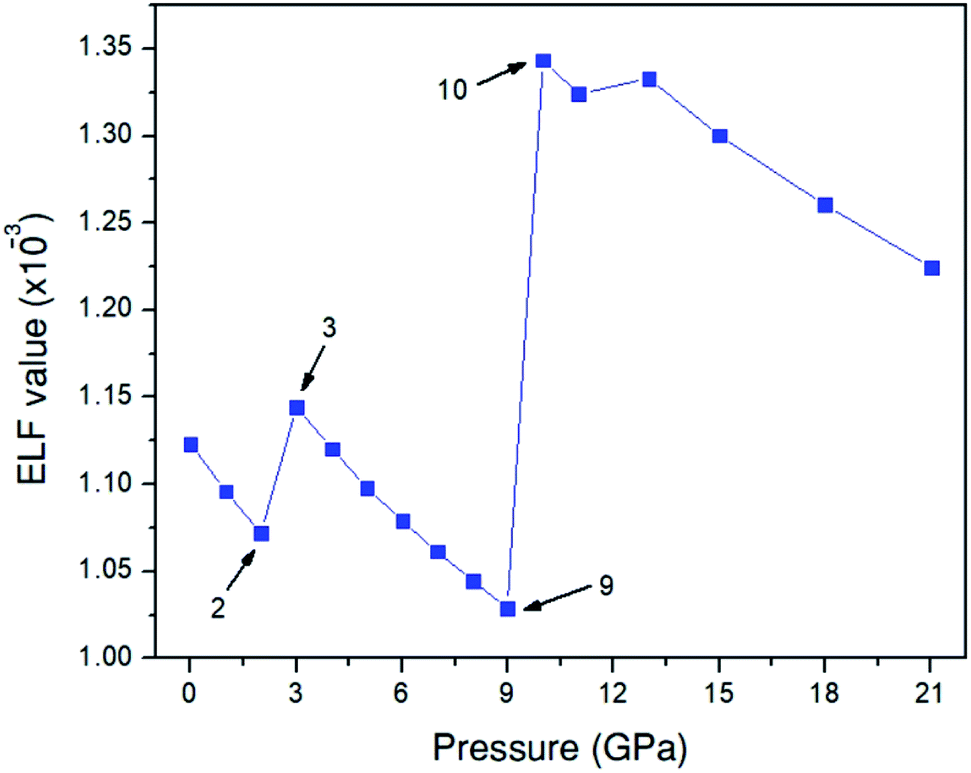
To investigate the behavior of the O–O bonds in the Amm2 structure of Na2O2 at high pressures, we calculated their ELFs in the pressure ranging from 0 to 21 GPa (Fig. 11). The findings predicted that the ELF has a decreasing trend with elevated pressure, which suggests the decreasing of shared electrons in the O–O bonds. Dramatically, however, the ELF turned to increase in the pressure ranges of 2–3 GPa and 9–10 GPa. The change at 3 GPa corresponds to the softening of elastic stiffness B11 and the softening of phonon frequencies of the acoustic modes at the Y point and the two-lowest frequencies of the optical modes at the Γ point as discussed before. Similarly, the change at 10 GPa significantly relates to the softening of phonon frequencies of the two acoustic modes at the Y point. However, the change of elastic stiffness B22 at 9 GPa has no correlation with the drastic increasing of the ELF at 10 GPa. Therefore, these suggest that the significantly elevated ELF at 3 and 10 GPa significantly relate to the softening of phonon frequencies of the acoustic mode and/or the optical modes at 3 and 10 GPa. Moreover, this leads to the stiffening of the O1–O1 and the O2–O2 bonds at 3 GPa as well. However, the unusual change of the O–O bond length at 10 GPa was not found, but there was a significant decrease of the cell angle, γ, of the primitive Amm2 structure at 10 GPa (Fig. S9(d), ESI†). In addition, dramatic changes of ELF have also been predicted in the P63/mmc structure of Li2O2 at 11 and 40 GPa.34 It was predicted that there is some charge transfer between the O and Li atoms at these pressures. However, the charge transfer may also occur in the Amm2 structure of Na2O2, but the marked change of the partial density of states of the Na and O atoms was not found in this work.
 | ||
| Fig. 11 Electron localization function (ELF) for the Amm2 structure in the pressure range of 0–21 GPa. | ||
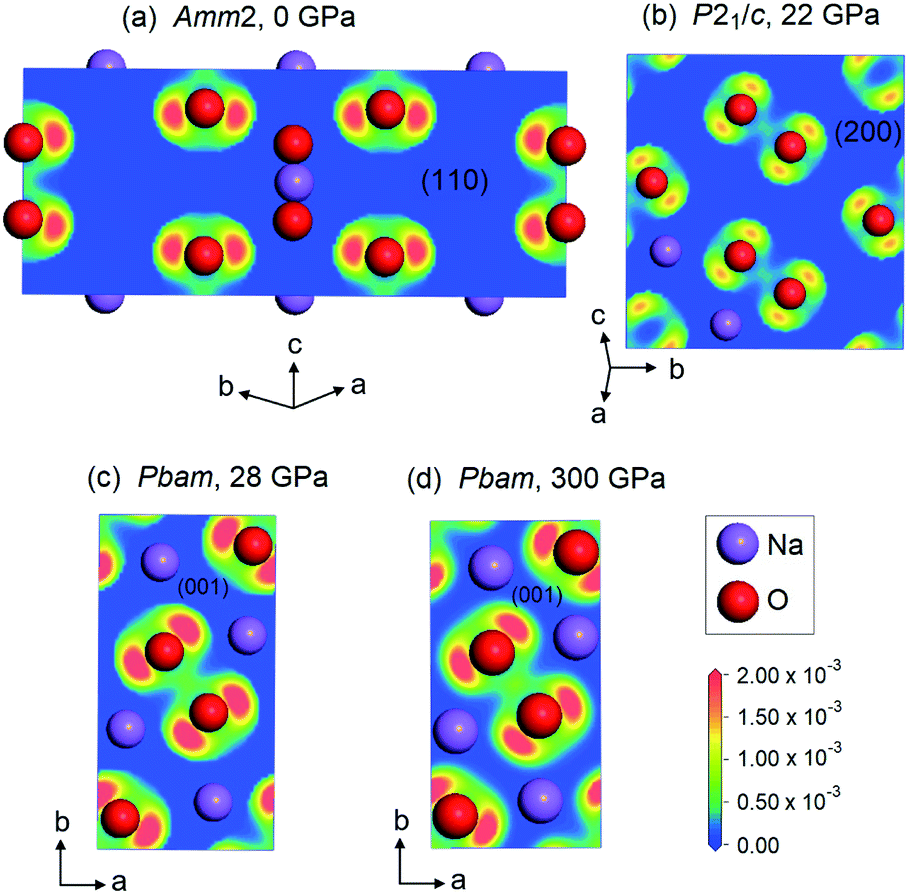
In addition, we also plotted the two-dimensional ELF for the Amm2 structure at ambient pressure projected onto the (110) plane, the P21/c structure at 22 GPa projected onto the (200) plane, and the Pbam structure at 28 and 300 GPa projected onto the (001) plane (Fig. 12). The findings showed the shared electrons in the O–O bond and the p-orbital shape of the O–O, which indicates that the O–O single bonds in these structures of Na2O2 remain up to 300 GPa.
 | ||
| Fig. 12 Two-dimensional ELF for various structures of Na2O2 at different pressures: (a) the Amm2 structure at 0 GPa projected onto the (110) plane, (b) the P21/c structure at 22 GPa projected onto the (200) plane, and (c and d) the Pbam structure at 28 and 300 GPa projected onto the (001) plane. | ||
4 Conclusions
The present work used the DFT calculations and the QHA to predict the phase stabilities of Na2O2 at high pressure up to 300 GPa and temperatures up to 600 K. The AIRSS searches were used to find the lowest enthalpy structure at 0 K, and the dynamical and thermodynamic stabilities of the lowest free energy structure candidates were estimated using the phonon dispersion and Gibbs free energy calculations, respectively. The findings revealed the two stable structures as the low-temperature phase of Na2O2. One is the Amm2 (distorted P2m) structure, which is dynamically and thermodynamically stable in the pressure range of 0–22 GPa at low temperature. However, the P2m structure becomes more thermodynamically stable than the Amm2 structure at elevated temperatures. Furthermore, Tallman’s structure is likely to be favored at higher temperature rather than Föppl’s structure. The other is the P21/c structure, which is dynamically and thermodynamically stable in the pressure range of 22–28 GPa at extremely low temperature. Nevertheless, the Pbam structure becomes the favored structure instead of the P21/c structure at elevated temperatures. Moreover, the AIRSS searches also revealed the high-temperature phase candidates of Na2O2-II and Na2O2-Q, which are I4/mmm and Immm structures, respectively.
Interestingly, the findings suggest the softening of the elastic stiffnesses, B11, at 3 GPa and B22, B44, and B23 at 9 GPa, and the decreasing of the universal elastic anisotropy index at 3 GPa. At the Y point, there are three phonon acoustic modes and all three soften at 3 GPa and two of them soften at 10 GPa. Similarly, at the Γ point, the two lowest phonon optical modes at 3 GPa also soften. This leads to the decreasing of phonon free energies and the increasing of the ELF at 3 and 10 GPa. Although the O–O bond lengths unusually decrease at 3 GPa, the unusual change of the O–O bond length is not found at 10 GPa, while a significant decrease of the cell angle, γ, of the primitive Amm2 structure also appears. These suggest the mechanism for maintaining the stability of Na2O2 at high pressures.
In addition, the PBE and HSE06 band gaps for the three phases of Na2O2 increase with elevated pressure, whereas they have no sign of unusual change. This suggests that the softening of the elastic stiffnesses and the softening of the phonon frequencies in the Amm2 structure have no significant effect on its band gap. Moreover, the ELFs reveal the existence of the peroxide group in Na2O2 up to 300 GPa. Therefore, our findings provide the two stable structures at low temperature, the candidate structures for the high-temperature phases, the P–T phase diagram, and related properties of Na2O2 at high pressures, which might be useful for investigating the thermodynamic stability of Na2O2 in the Na–O2 battery and the oxidizing efficiency of Na2O2.
Conflicts of interest
There are no conflicts to declare.Acknowledgements
This research was funded by the 90th anniversary of Chulalongkorn University Fund (Ratchadapisek Sompoch Endowment Fund (2019)), Chulalongkorn University. This work has been partially supported by the Super SCI-IV research grant, Faculty of Science and Chulalongkorn University; Grant for Research.References
- N. N. Greenwood and A. Earnshaw, Chemistry of the Elements, Butterworth-Heinemann, Oxford, 2nd edn, 1997 Search PubMed.
- M. V. Aleinikova, Y. N. Zhuravlev and D. V. Korabelnikov, Russ. Phys. J., 2012, 55, 495–500 CrossRef CAS.
- K. Song, D. A. Agyeman, M. Park, J. Yang and Y. M. Kang, Adv. Mater., 2017, 29, 1606572 CrossRef.
- E. Zurek and W. Grochala, Phys. Chem. Chem. Phys., 2015, 17, 2917–2934 RSC.
- R. L. Tallman, J. L. Margrave and S. W. Bailey, J. Am. Chem. Soc., 1957, 79, 2979–2980 CrossRef CAS.
- H. Föppl, Z. Anorg. Allg. Chem., 1957, 291, 12–50 CrossRef.
- A. Dunst, M. Sternad and M. Wilkening, Mater. Sci. Eng., B, 2016, 211, 85–93 CrossRef CAS.
- R. L. Tallman and J. L. Margrave, J. Inorg. Nucl. Chem., 1961, 21, 40–44 CrossRef CAS.
- H. A. Wriedt, Bull. Alloy Phase Diagrams, 1987, 8, 234–246 CrossRef CAS.
- N. Deng, W. Wang, G. Yang and Y. Qiu, RSC Adv., 2015, 5, 104337–104342 RSC.
- K. Momma and F. Izumi, J. Appl. Crystallogr., 2011, 44, 1272–1276 CrossRef CAS.
- S. J. Clark, M. D. Segall, C. J. Pickard, P. J. Hasnip, M. J. Probert, K. Refson and M. C. Payne, Z. Kristallogr., 2005, 220, 567–570 CAS.
- D. Vanderbilt, Phys. Rev. B: Condens. Matter Mater. Phys., 1990, 41, 7892–7895 CrossRef.
- J. P. Perdew, K. Burke and M. Ernzerhof, Phys. Rev. Lett., 1996, 77, 3865–3868 CrossRef CAS.
- C. J. Pickard and R. J. Needs, J. Phys.: Condens. Matter, 2011, 23, 053201 CrossRef.
- J. R. Nelson, R. J. Needs and C. J. Pickard, Phys. Chem. Chem. Phys., 2015, 17, 6889–6895 RSC.
- F. Birch, Phys. Rev., 1947, 71, 809–824 CrossRef CAS.
- http://www.tcm.phy.cam.ac.uk/castep/documentation/WebHelp/content/modules/castep/tskcastepcalcelastic.htm .
- S. I. Ranganathan and M. Ostoja-Starzewski, Phys. Rev. Lett., 2008, 101, 055504 CrossRef.
- R. Hill, Proc. Phys. Soc., London, Sect. A, 1952, 65, 349–354 CrossRef.
- W. Frank, C. Elsässer and M. Fähnle, Phys. Rev. Lett., 1995, 74, 1791–1794 CrossRef CAS.
- https://www.tcm.phy.cam.ac.uk/castep/documentation/WebHelp/content/modules/castep/thcastepthermo.htm .
- A. Siegel, K. Parlinski and U. D. Wdowik, Phys. Rev. B: Condens. Matter Mater. Phys., 2006, 74, 104116 CrossRef.
- J. Heyd, G. E. Scuseria and M. Ernzerhof, J. Chem. Phys., 2003, 118, 8207–8215 CrossRef CAS.
- D. M. Ceperley and B. J. Alder, Phys. Rev. Lett., 1980, 45, 566–569 CrossRef CAS.
- J. P. Perdew and A. Zunger, Phys. Rev. B: Condens. Matter Mater. Phys., 1981, 23, 5048–5079 CrossRef CAS.
- A. Jain, S. P. Ong, G. Hautier, W. Chen, W. D. Richards, S. Dacek, S. Cholia, D. Gunter, D. Skinner, G. Ceder and K. A. Persson, APL Mater., 2013, 1, 011002 CrossRef.
- F. Mouhat and F.-X. Coudert, Phys. Rev. B: Condens. Matter Mater. Phys., 2014, 90, 224104 CrossRef.
- G. V. Sin’ko and N. A. Smirnov, J. Phys.: Condens. Matter, 2002, 14, 6989–7005 CrossRef.
- B. B. Karki, G. J. Ackland and J. Crain, J. Phys.: Condens. Matter, 1997, 9, 8579–8589 CrossRef CAS.
- M. de Jong, W. Chen, T. Angsten, A. Jain, R. Notestine, A. Gamst, M. Sluiter, C. K. Ande, S. van der Zwaag, J. J. Plata, C. Toher, S. Curtarolo, G. Ceder, K. A. Persson and M. Asta, Sci. Data, 2015, 2, 150009 CrossRef CAS.
- G. I. Csonka, J. P. Perdew, A. Ruzsinszky, P. H. T. Philipsen, S. Lebègue, J. Paier, O. A. Vydrov and J. G. Ángyán, Phys. Rev. B: Condens. Matter Mater. Phys., 2009, 79, 155107 CrossRef.
- S. Yang and D. J. Siegel, Chem. Mater., 2015, 27, 3852–3860 CrossRef CAS.
- P. Jimlim, K. Kotmool, U. Pinsook, S. Assabumrungrat, R. Ahuja and T. Bovornratanaraks, Phys. Chem. Chem. Phys., 2018, 20, 9488–9497 RSC.
- B. Wang, N. Zhao, Y. Wang, W. Zhang, W. Lu, X. Guo and J. Liu, Phys. Chem. Chem. Phys., 2017, 19, 2940–2949 RSC.
Footnote |
| † Electronic supplementary information (ESI) available: Structural data; bulk and shear moduli; vibrational modes, activity in the IR and Raman spectra; comparison of E, H and PV between the Amm2 and the P2m structures; phonon dispersions curves; lattice constants versus pressure; peroxide group alignments; interatomic distances versus pressure; the universal elastic anisotropy index versus pressure; the relative Gibbs free energy versus temperature; the phonon free energy versus volume. See DOI: 10.1039/c9ra03735g |
| This journal is © The Royal Society of Chemistry 2019 |