
 Open Access Article
 This Open Access Article is licensed under a Creative Commons Attribution-Non Commercial 3.0 Unported Licence
Molecular interaction studies on ellagic acid for its anticancer potential targeting pyruvate dehydrogenase kinase 3†
Rashmi Dahiyaa,
Taj Mohammad a,
Preeti Guptaa,
Anzarul Haquea,
Mohamed F. Alajmib,
Afzal Hussainb and
Md. Imtaiyaz Hassan*a
a,
Preeti Guptaa,
Anzarul Haquea,
Mohamed F. Alajmib,
Afzal Hussainb and
Md. Imtaiyaz Hassan*a
aCentre for Interdisciplinary Research in Basic Sciences, Jamia Millia Islamia, Jamia Nagar, New Delhi 110025, India. E-mail: mihassan@jmi.ac.in
bDepartment of Pharmacognosy College of Pharmacy, King Saud University, Riyadh 11451, Kingdom of Saudi Arabia
First published on 29th July 2019
Abstract
Pyruvate dehydrogenase kinase 3 (PDK3) plays a central role in the cancer metabolic switch through the reversible phosphorylation of pyruvate dehydrogenase complex thereby blocking the entry of pyruvate for its catabolism into the TCA cycle, and thus it is considered as an important drug target for various types of cancers. We have successfully expressed full length human PDK3 and investigated its interaction mechanism with dietary polyphenols in the search for potential inhibitors. Molecular docking analysis revealed that the selected compounds preferentially bind to the ATP-binding pocket of PDK3 and interact with functionally important residues. In silico observations were further complemented by experimental measurements of the fluorescence quenching of PDK3 and confirmed with the isothermal titration calorimetry measurements. Ellagic acid (EA) significantly binds and inhibits the kinase activity of PDK3. In vitro cytotoxicity and the anti-proliferative properties of EA were evaluated by MTT assay. Conformational dynamics of the EA-PDK3 complex during molecular dynamics simulation revealed that a stable complex was maintained by a significant number of hydrogen bonds throughout the 100 ns trajectories. In conclusion, EA may be considered as a promising molecule for PDK3 inhibition and could be exploited as a lead molecule against PDK3 associated diseases.
1. Introduction
Protein kinases constitute the largest recognized protein family in the human genome which regulate several distinct biological processes.1,2 Over the past two decades, human kinases became the most important class of drug target in the pharmaceutical industry. More than 25 kinase targeting drugs have been approved by FDA and hundreds more are still in clinical trials.3 Pyruvate dehydrogenase kinases (PDKs), constituting a novel family of protein kinase in which motifs that normally occur in atypical eukaryotic Ser/Thr/Tyr kinases are absent,4,5 are an important drug target against cancer and other metabolic disorders. PDK3 was first identified as one of the isoforms responsible for the inactivation of pyruvate dehydrogenase complex (PDC) through its reversible phosphorylation.6,7 PDC governs the entry of the glycolytic product pyruvate into mitochondrial respiration. Structurally, PDC is a megadalton complex consisting of three major components: pyruvate dehydrogenase (E1), dihydrolipoamide transacetylase (E2) and dihydrolipoamide dehydrogenase (E3)8 organized around 60-meric dodecahedral core consisting of E2 and E3-binding protein (E3BP). Multiple copies of E1, E3, PDKs and pyruvate dehydrogenase phosphatases (PDPs) bind to the E2p/E3BP core through their N-terminal peripheral domains.9,10 Specific serine residues (Ser264, Ser271 and Ser203) located on the α-chain in the E1 component are targeted for phosphorylation by PDKs which regulate the activity of PDC.11,12 The inner lipoyl (L2) domain of the E2 component of PDC acts as a scaffold for the covalent attachment of PDKs to Lys173 of the L2 domain in the E2p/E3BP core.13,14Interestingly, PDK3 is very poorly inhibited by the PDC substrate: pyruvate or its synthetic analog dichloroacetate (DCA). PDK3 activity is majorly governed by its tight binding to L2 domain15 and its overexpression showed a positive correlation with the severity of cancer and negative correlation with the disease-free survival.16 The characterization of hypoxic areas in tumors is an independent predictor of death.17,18 Moreover, hypoxic cancers are non-responsive to radiation and chemotherapies.19,20 PDK3 transcription is predominantly upregulated by HIF-1α, leading to the suppression of mitochondrial respiration and OXPHOS.21 In melanoma, suppression of the HIF-1α/PDK3 signalling through drug treatment drives metabolic shift from glycolysis to mitochondrial oxidative metabolism.22 Recently, PDK3 has been linked to the X-linked hereditary disorder of motor and sensory neurons known as Charcot–Marie–Tooth (CMTX6) syndrome of the peripheral nerve which collectively represents one of the most common group of human genetic diseases.23–25 CMT affects 1 in 2500 people and identified as a clinically and genetically heterogeneous disorder. A missense mutation (R158H) in PDK3 is identified as the cause for CMT (CMTX6) pathogenesis. R158H mutation confers hyperactivation of PDK3 which leads to its stronger binding affinity towards the L2 domain within E2 of PDC as compared to the wild-type PDK3.23
Cancer is the second leading cause of death worldwide and cardiovascular diseases hold the leading position. For the past several centuries, medicinal plants are an important source of diverse natural compounds and phytonutrients that have been used in the treatment of cancer, and are known for their potential therapeutic applications.26,27 Approximately, 30% of drugs in the modern pharmacopoeia are obtained from plants, and various synthetic analogues are built on prototypic compounds derived from plants. Moreover, in Western countries, ∼60% of prescribed drugs contain plant isolates or their derivatives.27 Natural polyphenols are widely distributed in plants with major presence in vegetables, fruits, herbs, tea, coffee, nuts and red wine.28,29 Polyphenols and their derivatives shown to have various therapeutic properties.30–33 These polyphenolic compounds possess anti-oxidant, anti-cancerous, anti-inflammatory and anti-microbial properties. Moreover, flavonoids intake substantially reduce the risk of cancer, diabetes, heart failures and neurodegeneration. Due to their enormous health benefits, dietary polyphenols have attracted a lot of attention in drug discovery.34–37 Meta-analysis also predicted an inverse correlation between the consumption of flavonoids rich diet with development of age-related diseases.38,39 Studies with cancer cells showed that flavonoids target various signalling pathways which regulate cell survival and proliferation like MAPK, NF-κB, mTOR and Wnt.40
In this study, we selected and evaluated eight polyphenolic compounds: ellagic acid (EA),41 limonin,42 simvastatin,43 citral,44 capsaicin,45 vanillin,46 DL-α-tocopherol acetate47 and ursolic acid48 with the above-mentioned and reported therapeutic properties as potential inhibitors of PDK3. Here, we report the binding affinities of these polyphenols with PDK3, since these are most common natural compounds reported to have different biological benefits.49,50 Molecular docking was performed to evaluate the interactions between these selected polyphenols with PDK3. Binding energies calculated by docking studies were further evaluated with fluorescence quenching experiments. EA was found to bind PDK3 most efficiently, as observed with docking and fluorescence quenching assays. Isothermal titration calorimetry (ITC) further confirmed the significant binding of EA with PDK3. Furthermore, molecular dynamics (MD) simulations studies were performed to check the dynamics of EA-PDK3 complex and their interatomic motions. Cytotoxicity and antiproliferative properties of EA was quantitated by MTT assay. Our findings confirm that all selected polyphenolic compounds interact to the PDK3 with distinct binding efficiencies and thus could be further evaluated for therapeutic uses after a certain validation. Finally, EA can be further investigated for its modulatory effects on metabolic reprogramming and its scaffold could be further exploited for the development of lead molecule against PDK3 associated diseases.
2. Material and methods
2.1. Reagents, strains and plasmids
Plasmid pET28b+ was purchased from Qiagen and DH5α was obtained from Invitrogen (USA). FastDigest restriction enzymes were purchased from Thermo Scientific. Ni-NTA column was purchased from GE healthcare (GE Healthcare Life Sciences, Uppsala, Sweden). N-Lauroyl sarcosine, Tris buffer, MTT (3-[4,5-dimethylthiazol-2-yl]-2,5-diphenyl tetrazolium bromide), ellagic acid, capsaicin, DL-α-tocopherol, ursolic acid, simvastatin, limonin, citral and vanillin and other reagents were purchased from Sigma Aldrich (St. Louis, MO, USA). Human liver cancer cells (HepG2), Adenocarcinomic human alveolar basal epithelial cells (A549), and human embryonic kidney cells (HEK293) were procured from National Centre for Cell Sciences, Pune-411007, India. Fetal bovine serum (FBS), Dulbecco's modified eagle's media (DMEM), F-12K medium, antibiotic cocktail, TrypLE express cell detachment enzyme and MTT (3-[4,5-dimethylthiazol-2-yl]-2,5-diphenyltetrazolium bromide) were purchased from Gibco-life technologies, Thermo Fisher Scientific (USA). BL21 Gold cells were purchased from Invitrogen. Plasmid isolation, restriction enzyme digestion, ligation and competent cell preparations were carried out following standard procedures.51 All reagents used were of molecular biology grade.2.2. Cloning, expression and purification of hPDK3
To amplify the PDK3 gene, plasmid purchased from PlasmID HMS library of human kinases (http://plasmid.med.harvard.edu/PLASMID) was used as a template. For cloning, primers: 5′-attgctagcatgcggctgttccggtggctg-3′ and 5′-gccctcgagctacaactgttttgctttgtattttgaagc-3′ incorporating the NheI and XhoI restriction endonuclease sites as forward and reverse primers, respectively were designed. PDK3 amplicons were ligated into pET28b+ vector for the expression of six-histidine tagged recombinant PDK3. Transformed BL21 Gold cells were grown in Luria–Bertani broth medium with added kanamycin (50 μg ml−1). Expression of hPDK3 was induced by IPTG (1 mM). Sonication was carried out on ice using ultra-sonicator (Cole-Parmer Instrument) for 15 min (15 s off, 15 s on) and pellets were collected through centrifugation and resuspended in 50 mM Tris, 50 mM NaCl, and 20 mM EDTA. For the preparation of inclusion bodies appropriate buffers were prepared (50 mM Tris, 50 mM NaCl, 20 mM EDTA, 0.1 mM PMSF and 1% of Triton X-100) and IB pellets were finally washed with Milli-Q water. IBs were solubilized in lysis buffer (0.5% of N-lauryl sarcosine prepared in 50 mM Tris, 100 mM NaCl buffer pH 8.0) and supernatant was loaded to the equilibrated Ni-NTA column. Elution of the recombinant protein was carried out in 25 mM imidazole in elution buffer (0.1% N-lauryl sarcosine and 50 mM Tris, 100 mM NaCl buffer pH 8.0). The eluted fractions were analysed by SDS-PAGE to determine the purity. Purified proteins were dialyzed for 48 h in 50 mM Tris, 100 mM NaCl buffer pH 8.0 with four successive buffer changes to get refolded protein. The protein concentration and profile were checked before and after dialysis to determine the protein yield and folding.2.3. Molecular docking
Molecular docking and MD simulations studies were carried out on DELL® workstation with Intel® Xeon® CPU E5-2609 v3@1.90 GHz processor, 64 GB RAM and two terabyte hard disk running on Ubuntu 14.04.5 LTS operating system. GROMACS 5.1.2 utilities were used for MD simulations. Computational tools such as PyMOL,52,53 VMD (Visual Molecular Dynamics),54 and QtGrace55 were used for visualization, evaluation and analysis of MD trajectories. Three-dimensional atomic coordinates of PDK3 were taken from Protein Data Bank (PDB ID: 1Y8O), and processed in PyMod 2.0 for reconstruction of the structure. SPDBV56,57 and MGL tools58 were used for energy minimization and structure pre-processing. Chemical structure of EA was downloaded from PubChem and processed in ChemBioDraw Ultra 12.0.59 AutoDock Vina60 was used for docking purpose. PyMOL52 and Discovery Studio Visualizer61 were used for visualization to analyse bound conformations and different interactions between EA and PDK3.2.4. MD simulations
MD simulations for 100 ns were performed on PDK3 only and with EA at 300 K at the molecular mechanics level using GROMOS96 43a1 force-field in GROMACS 5.1.2. The ligand EA was extracted from the docked complex using gmx grep module. The topology and force field parameter files of EA were generated using PRODRG server. The charges in the topology file were manually corrected. The generated topologies of protein using pdb2gmx modules of GROMACS, and ligand EA using PRODRG server were merged. Additional EA atoms were combined in the complex topology files, and the parameters for EA were included in the system topology. Both the systems were soaked in a cubic box of water with dimension of 10 Å and subjected to solvate in the Simple Point Charge (spc216) model using gmx solvate module. 1500 steps of steepest descent were used for energy minimization. The conformations were sampled at time step of every 10 ps during 100 ns simulations of PDK3 alone and PDK3-EA complex. The resulting trajectories were analysed using gmx energy, gmx rms, gmx rmsf, gmx gyrate, gmx sham and gmx sasa utilities of GROMACS. All graphs and figures were prepared using QtGrace.552.5. Fluorescence measurements
Fluorescence emission and quenching experiments were performed on Jasco spectrofluorometer (FP-6200) to measure the binding affinity of selected polyphenols with purified PDK3 by monitoring the changes in fluorescence intensity by addition of compounds at 25 ± 0.1 °C. Compounds were dissolved in DMSO with a varying stock concentration of 10–30 mM and further diluted in 50 mM Tris buffer (pH 8.0) according to the experimental need. The excitation of PDK3 was performed at 280 nm and the intrinsic fluorescence emission spectra was recorded at 300–400 nm. The characteristic emission peak of PDK3 was observed at 335 nm. Final spectra were obtained by subtracting the corresponding blank. The experiment was performed in triplicates and the average data was plotted. The inverse correlation between the intrinsic fluorescence of PDK3 with the increasing concentration of compounds underlies the basic criteria for deducing the kinetic parameters like; binding constant (Ka) along with number of binding sites (n) present on protein using the modified Stern–Volmer equation as described.622.6. Isothermal titration calorimetry
Isothermal titration calorimetry (ITC) measurement was performed at 25 °C on a VP-ITC microcalorimeter from MicroCal, Inc (GE, MicroCal, USA). To counteract the signal to noise problems during ITC measurements, DMSO was added to the protein solution in equal amounts (1% v/v) sequentially. Programmed titration of ligand involved a first false injection of 2 μl followed by successive injections of 10 μl ligand at 300 seconds interval present in the syringe into the cell that contained protein. The stirring rate of the injector was kept at 320 rpm. The heat of dilution of ligand in buffer was subtracted from the titration data. The data was further analysed using MicroCal Origin 7.0 to calculate the association constant (Ka), stoichiometry of binding (n), enthalpy change (ΔH) and entropy change (ΔS). These values were determined after the curve fitting of the binding isotherm to the ‘four-set of sites’ binding model software provided with the instrument.2.7. Enzyme inhibition assay
Kinase activity of PDK3 was determined with standard Malachite Green (BIOMOL® GREEN reagent, Enzo Life Sciences) microtitre-plate assay as described previously.62 For ATPase activity measurements, the intensity of green color formation was detected using a Bio-Rad plate reader at 620 nm. Serial dilutions of ATP from (0 to 300 μM) and a fixed concentration of purified PDK3 protein (5 μM) were incubated for 10–15 min at 25 °C in a total reaction volume of 200 μl in 96-well flat-bottomed plates. Enzymatic reactions were quenched by the addition of 50 μl of the BIOMOL® GREEN reagent solution. Reaction mix was incubated for 15 minutes and absorbance of final reaction products was recorded at 620 nm in a Bio-Rad plate reader. For the quantification of the hydrolysed phosphate, inorganic phosphate standard curve was prepared. Standard curves (0.0–8 nmol) of phosphate were generated using serial 2-fold dilutions of phosphate standards in BIOMOL® GREEN Reagent (BML-AK111-malachite green assay buffer) from the phosphate standard solutions supplied by the manufacturer without ATP as per the BIOMOL® Enzo Life Sciences product manual. To check the inhibitory potential of EA on PDK3, estimated amount of PDK3 (5 μM) and 200 μM ATP as a substrate were incubated with increasing concentrations (0–30 μM) of EA for 15–20 min at 25 °C, in 50 mM Tris buffer, 100 mM NaCl, pH 8.0. This reaction mix was incubated for 10 minutes for the colour production with BIOMOL® GREEN Reagent. Multiple absorbance was recorded in a plate reader at 620 nm. Data points represent triplicate measurements from at least three independent experiments.2.8. Cell proliferation study
A549 cells were grown and maintained in F12K medium, whereas HEK293 and HepG2 cells were maintained and cultured in DMEM media complimented with 10% heat inactivated FBS and 1% penicillin, streptomycin solution in a humidified 5% CO2 incubator, 37 °C. To maintain culture consistency, cultures of each cell type were regularly maintained and trypsinized not more than 30 passages. The cytotoxicity/antiproliferative potential of EA was studied using standard MTT assay as described previously.62–64 Each cell line was dosed with EA (increasing concentrations, 0–250 μM) in a final volume of 200 μl for 48 h at 37 °C in a humidified CO2 incubator and processed for cell viability studies.64 The absorbance of reaction products was recorded at 570 nm using a microtiter reader (Bio-Rad). The percentage of viable cells were calculated and plotted as a function of concentration of EA. Doxorubicin was taken as a positive control for inhibiting cancer cell proliferation.3. Results
3.1. PDK3 binding with selected natural polyphenols
Selected dietary polyphenols known to possess anti-cancer, anti-proliferative and anti-diabetic properties were used for docking analysis with PDK3 to see possible interactions. ATP-binding site of PDK3 is located at the C-terminal domain of protein and lies at the cleft between N- and C-terminal domains (Fig. S1†). The location of ATP-binding pocket within the cleft facilitates the ease of phosphoryl-transfer reaction of the gamma-phosphate on E1p substrate. Conserved residues of the ATP-binding pocket of PDK3 were identified as the common motif determinants within members of the GHKL superfamily.65 To analyse the binding pattern of compounds with PDK3, molecular docking was performed to estimate the interacting residues, binding energies and intermolecular distances within the PDK3–ligand complexes. We performed the docking of selected polyphenols with PDK3 and calculated their binding affinities (Fig. S2 and S3†). PDK3 interacts with the selected polyphenols through a common set of amino acid residues, Leu248, Asn251, Ser252, Arg254, Ala255, Asp287, Gly289, Gly290, Gly291, Val292, Leu300, Leu328, Leu344, Gly351, Thr352 and Ala354. Based on interacting residues and binding energies obtained from docking analysis, the best-docked complexes were EA, a condensed dimer of gallic acid (Fig. 1A) followed by limonin and ursolic acid (Table 1).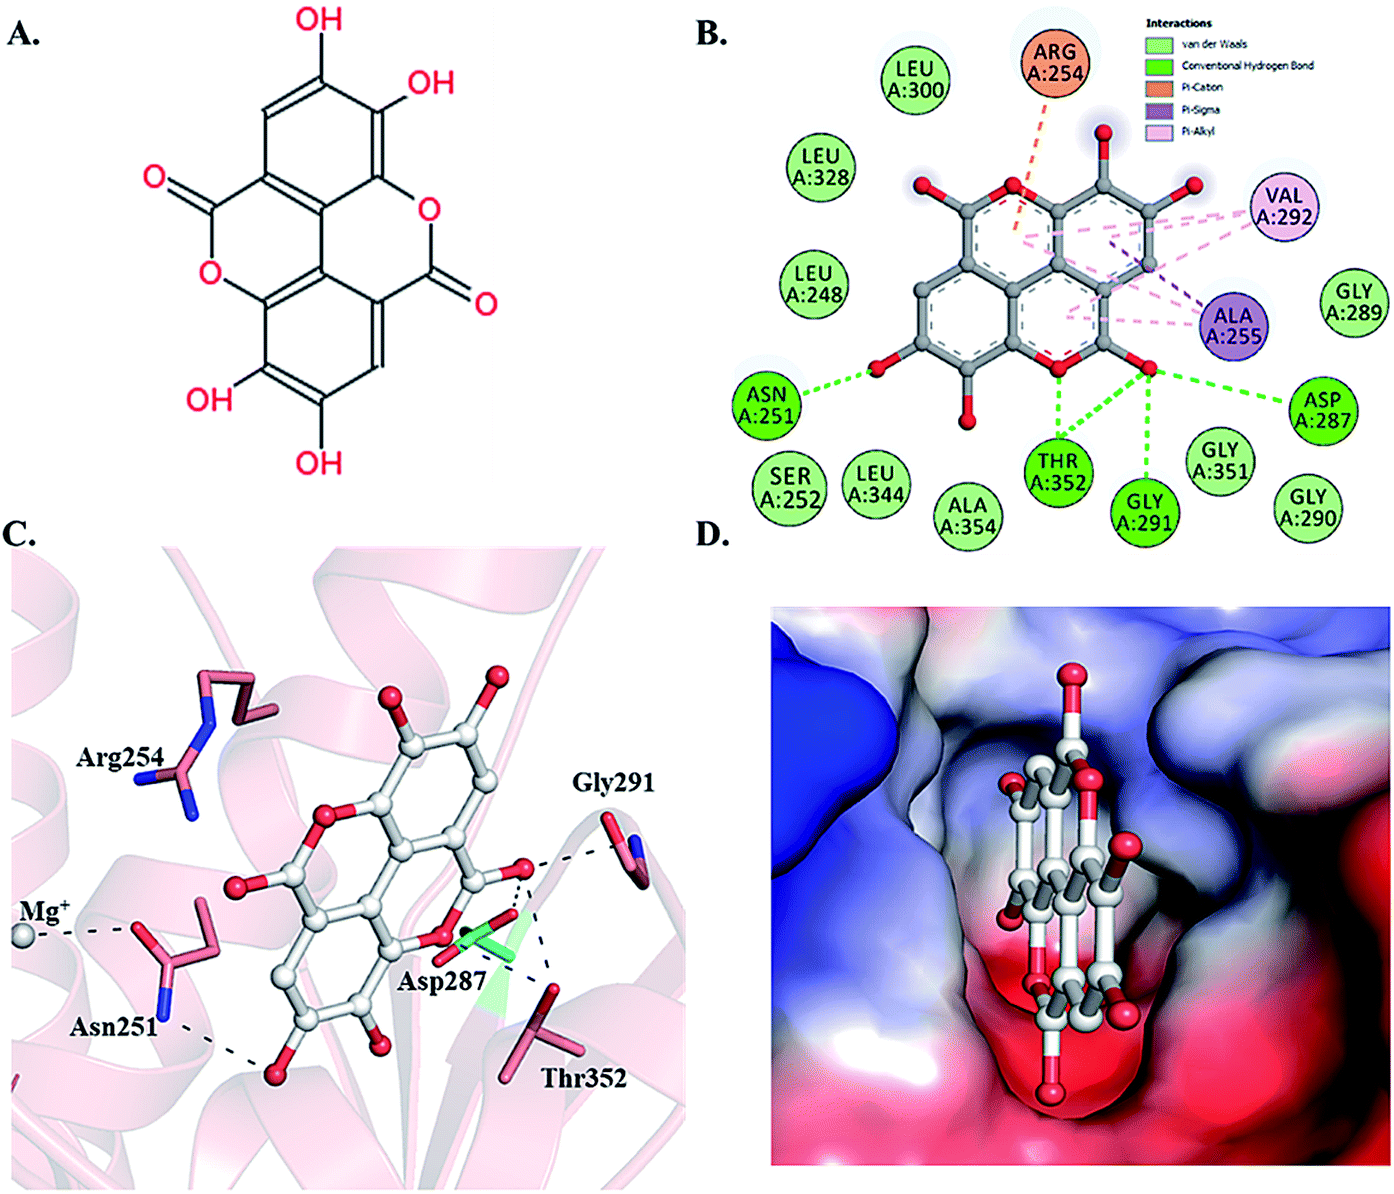 | ||
| Fig. 1 Structural representation of PDK3 in-complexed with EA. (A) 2D structure of EA. (B) 2D structural representation of PDK3 residues interacting to the EA. (C) 3D interaction of EA with the active-site pocket of PDK3. (D) Surface electrostatic potential view of PDK3 binding pocket occupied by EA. | ||
| S. No. | Compound | Chemical structure | ΔGa (kcal mol−1) | Binding affinityb (Ka) M−1 |
|---|---|---|---|---|
| a Free energy calculated from docking analysis.b Binding affinity (Ka) calculated from fluorescence analysis. | ||||
| 1. | Ellagic acid | 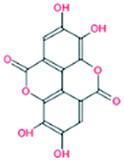 |
−7.9 | 2.68 × 10⁸ |
| 2. | Capsaicin |  |
−6.6 | 3.69 × 10⁶ |
| 3. | Ursolic acid |  |
−7.6 | 5.67 × 10⁵ |
| 4. | Limonin |  |
−7.7 | 3.16 × 10⁷ |
| 5. | Vanillin | 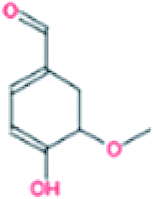 |
−6.0 | 1.78 × 10⁵ |
| 6. | Citral |  |
−6.6 | 5.66 × 10⁶ |
| 7. | DL-α-Tocopherol acetate |  |
−7.4 | 4.32 × 10⁶ |
| 8. | Simvastatin |  |
−7.2 | 3.86 × 10⁵ |
3.2. Protein purification and characterization
To validate the docking results obtained from PDK3 interactions with natural polyphenols, full length PDK3 was successfully cloned and expressed in E. coli with six-histidine-tags and purified as a single band with an approximate size of 49.5 KDa (Fig. 2A). Purified and proper refolded form of PDK3 was further evaluated with UV-spectra in the range of 240–340 nm to check visible or invisible aggregates. The kinase activity of PDK3 was evaluated with the ATPase assay to confirm the quality of purified protein (Fig. 2B). PDK3 exponentially hydrolyse ATP up to 150 μM, beyond this concentration, we observed a slight saturation of ATPase activity by PDK3 (Fig. 2B). | ||
| Fig. 2 Expression and kinase activity of purified recombinant full-length PDK3. (A) Gel image showing the expression of PDK3 with an approximate size of 49.5 kDa. Two serial dilutions of protein were loaded for clarity (lane 1 corresponds to 10 μg of purified protein). (B) ATPase assay of PDK3 showing the kinase activity with increasing amount of ATP. | ||
3.3. Fluorescence binding studies
Fluorescence spectroscopic measurements were carried out to estimate the actual binding affinities of selected polyphenols with the PDK3. Binding constants of polyphenols interacting with purified PDK3 (excited at 280 nm) were determined from changes in fluorescence intensity by titration with increasing concentrations of polyphenols (λem 300–400 nm). For easy interpretation, all polyphenols were taken in the concentration range of 2–12 μM, except for EA (0.1–4.0 μM). For clarity, the refined spectrum was plotted (Fig. S4–S6†). Polyphenols possessing good binding affinities towards PDK3 quench at μM concentrations range whereas EA shows very high binding at a very low concentrations (nM range) (Fig. 3A).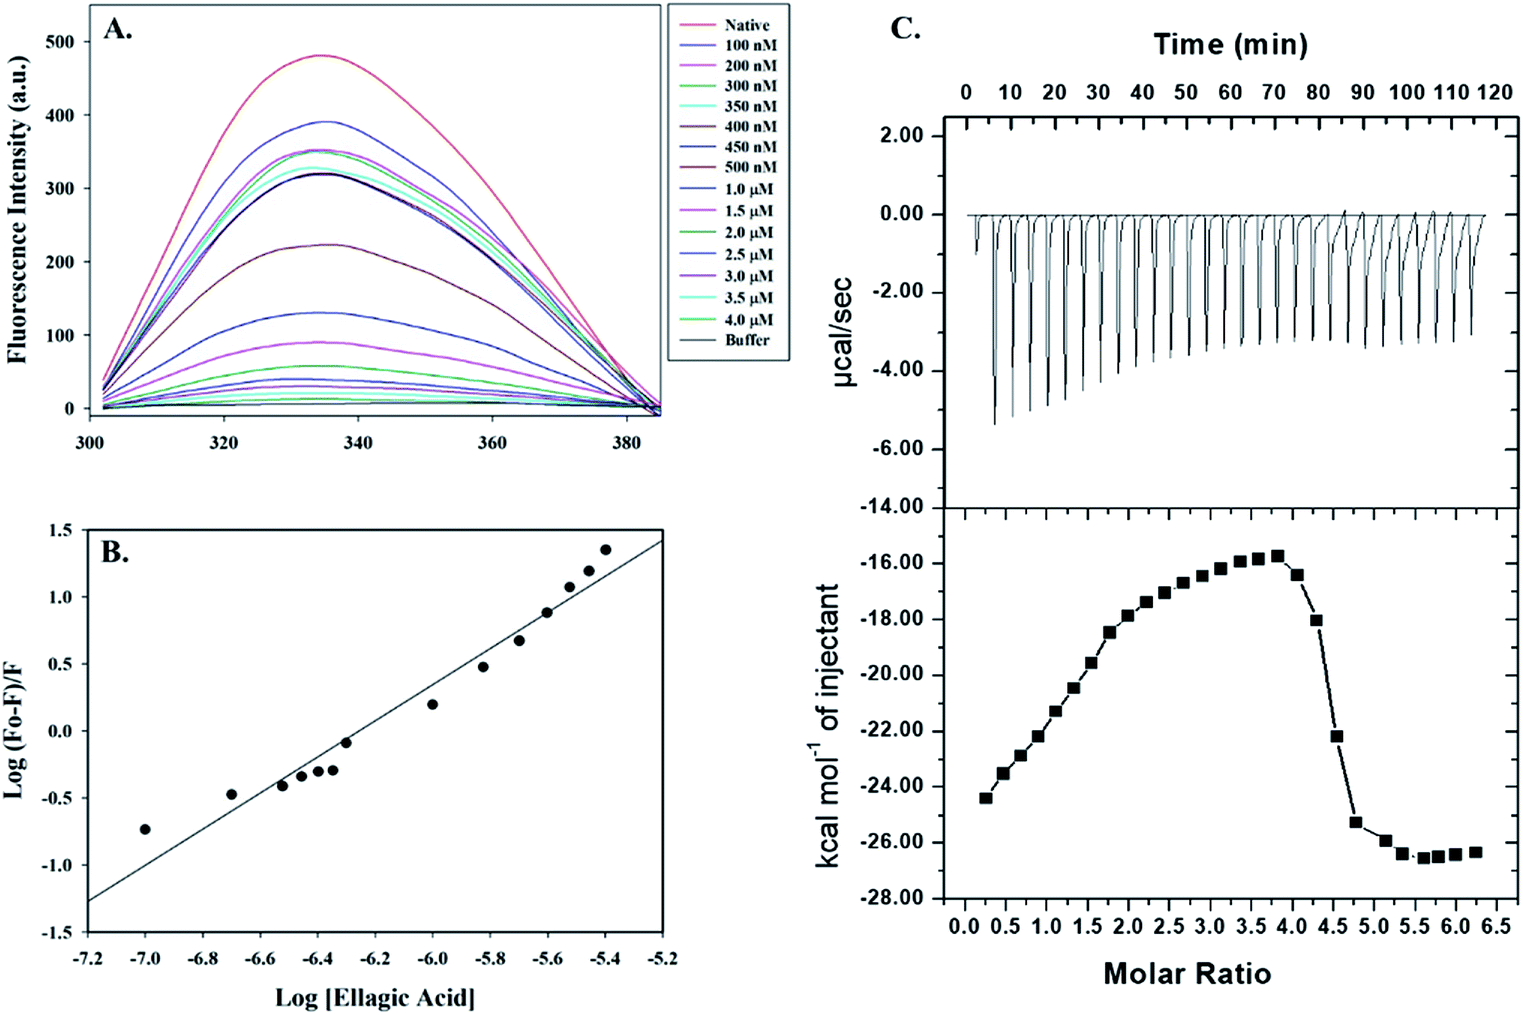 | ||
| Fig. 3 Binding studies of EA with hPDK3. (A) Fluorescence emission spectra of PDK3 (4 μM) with increasing concentrations of EA. Protein was excited at a fixed wavelength of 280 nm and emission was recorded in wavelength range of 300–400 nm. (B) Modified Stern–Volmer plot acquired from fluorescence quenching of PDK3 by EA. SV plot was used to calculate the binding affinity (Ka) and number of binding sites (n). (C) ITC measurement showing the titration of EA with recombinant hPDK3. Raw data plot showing the heat produced against time for the titration of PDK3 with increasing concentrations of EA (upper panel). Graph showing the binding isotherm obtained with the integration of peak area and normalization to yield molar enthalpy change (bottom panel). The fitted curve is shown in line. | ||
Increasing concentration of EA showed an inverse relationship with the fluorescence intensity of PDK3 which is represented by Stern–Volmer plots (Fig. 3B). For other polyphenols, quenching was observed in the μM concentrations and are in accordance with the molecular docking analysis (Fig. S4–S6†). We observed that EA possess a significant binding affinity as evident from both docking and fluorescence measurements with the Ka value as 2.68 × 10⁸ M−1 with a single binding site (Fig. 3A and B). The limonin also showed an appreciable binding with Ka calculated as 3.16 × 10⁷ M−1, in addition to all the selected compounds (Table 1).
3.4. Isothermal titration calorimetry
Molecular docking and fluorescence quenching experiments showed that EA binds significantly to the PDK3. To identify the thermodynamic parameters associated, we have performed ITC analysis of PDK3-EA complex. During ITC measurement, PDK3 was kept at a high concentration (30 μM) and titrated against an increasing concentration of EA (Fig. 3C). A typical ITC isotherm generated from the complex formation between EA and PDK3 is represented in Fig. 3C. The upper panel of Fig. 3C represents raw data associated with negative heat pulses indicating exothermic binding of EA with PDK3. The bottom panel of Fig. 3C gives the integration area and binding curves after subtracting the heat of dilution generated during EA-PDK3 complex formation. The extent of heat released as a quantity of the molar ratio of EA interacting to PDK3 represented during each corresponding injection. The results presented here are obtained from four-site model of fitting. Distinct thermodynamic parameters such as association constant (Ka), enthalpy change (ΔH) and entropy change (ΔS), associated with the formation of PDK3-EA complex are shown in the Table 2. ITC measurements further substantiate the fluorescence measurements and confirms a very significant binding affinity of EA with PDK3.| Complex | Ka (association constant), M−1 | ΔH (enthalpy change), cal mol−1 | ΔS, cal mol−1 deg−1 |
|---|---|---|---|
| PDK3-EA | Ka1 = 9.47 × 10³ ± 1.5 × 10³ | ΔH1 = −2701 ± 2.9 × 10⁴ | ΔS1 = 9.13 |
| Ka2 = 1.18 × 10⁵ ± 1.4 × 10⁴ | ΔH2 = −2.833 × 10⁵ ± 7.24 × 10⁴ | ΔS2 = −927 | |
| Ka3 = 3.9 × 10⁴ ± 6.7 × 10³ | ΔH3 = −5.672 × 10⁵ ± 8.74 × 10⁴ | ΔS3 = −1950 | |
| Ka4 = 2.97 × 10⁴ ± 4.2 × 10³ | ΔH4 = −6.28 × 10⁵ ± 5.23 × 10⁴ | ΔS4 = −2090 |
3.5. Enzyme inhibition assay
To check the effect of EA binding to PDK3 kinase activity, enzyme inhibition assay was performed by monitoring the ATPase activity of PDK3 with increasing concentrations of EA (0–30 μM) as shown in the Fig. 4. Interestingly, we observed that, with the increasing concentrations of EA, there is a significant reduction of the kinase activity of PDK3. Our ATPase assay revealed that ∼5 μM of EA inhibits 50% activity of PDK3 (Fig. 4B). As observed with the docking analysis in Fig. 1, EA possibly interacts with the ATP-binding pocket located at the C-terminal domain of PDK3. Our enzyme inhibition results establish that EA indeed inhibits PDK3 activity possibly through competitive inhibition with ATP for the nucleotide-binding pocket of the kinase. Our docking along with the kinase inhibition results substantiate the fact that EA acts as potential inhibitor of PDK3.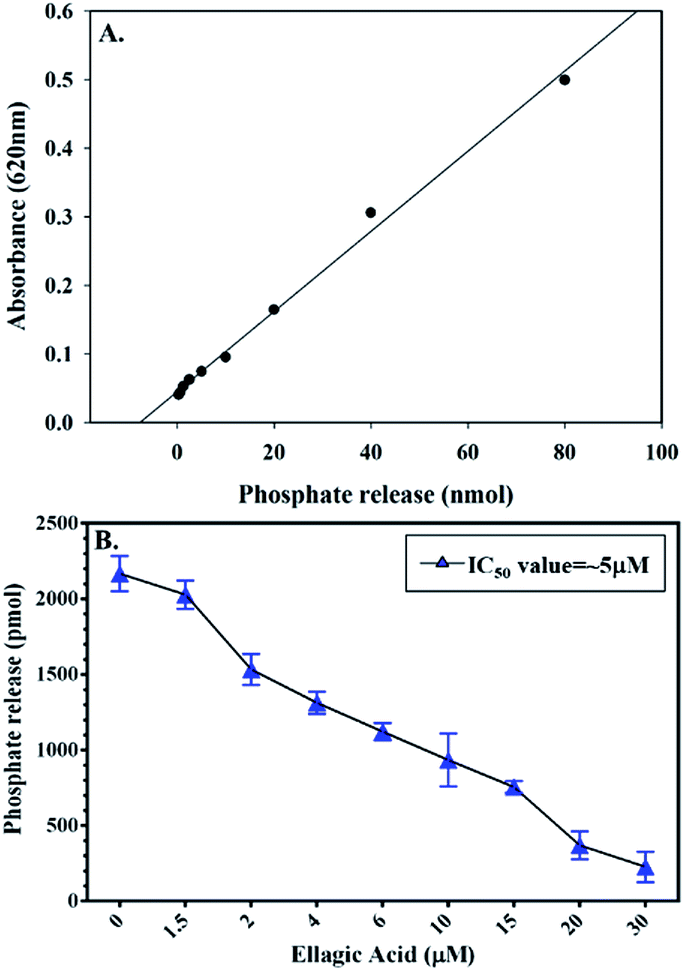 | ||
| Fig. 4 Enzyme activity profile of recombinant PDK3 with EA. (A) Standard phosphate hydrolysis curve showing the quantity of phosphate measured. (B) ATPase inhibition assay (% hydrolysis of phosphate) showing the effect of EA on the ATPase activity of PDK3. | ||
3.6. Cell proliferation assay
Enzyme inhibition assay, binding studies and in silico studies suggested that EA has very strong affinity towards the PDK3 and potentially inhibits its activity. As PDK3 plays an important role in the cancer cell proliferation and development. Thus, we explored the cancer cell growth inhibition properties of EA on HepG2 and A549 human cancer cell lines. The reason for selecting these cell lines is the remarkable expression of PDK3 in A549 and HepG2 cells. On the other hand, for normal cell cytotoxicity, HEK293 cells were selected. The selected cells were treated with increasing concentration (0–250 μM) of EA for 48 h. Cell viability studies showed treatment of EA inhibits the growth of A549 and HepG2 cells, whereas in case of HEK293, EA treatment doesn't affect its growth (Fig. 5). From the cell growth curves, the IC50 values were estimated and found to be 36.69 ± 3.22 μM for HepG2 and 23.44 ± 1.33 μM for A549 cells, respectively (Fig. 5A). These results are also in accordance with earlier studies and suggested that the EA is non-cytotoxic to normal cells (Fig. 5B) and suppressed the growth of other cancerous cells including HepG2 and A549.64,66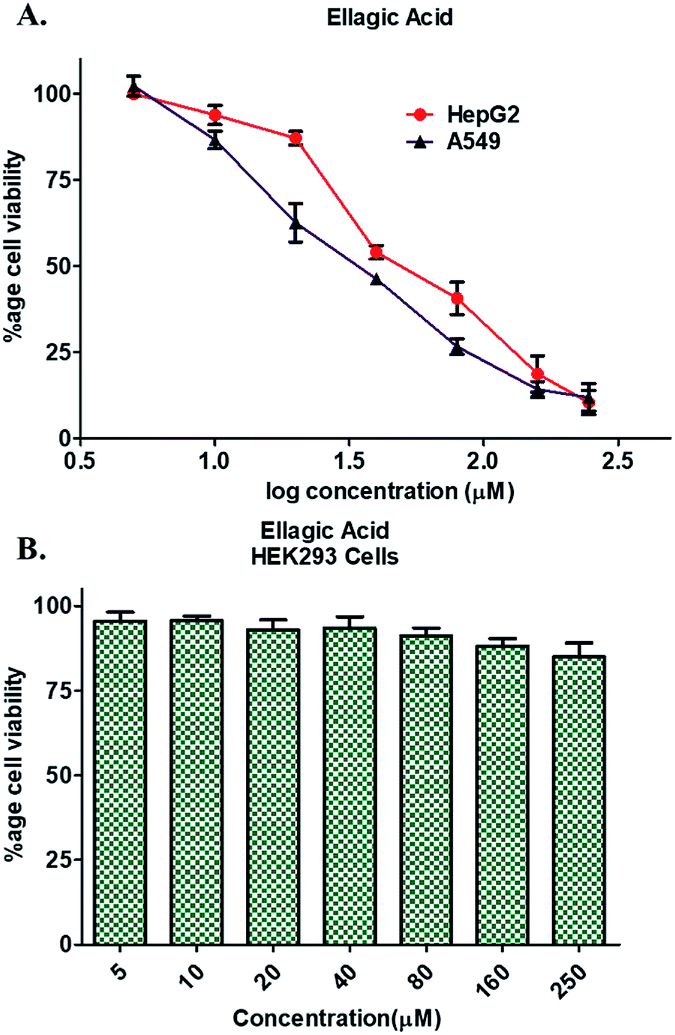 | ||
| Fig. 5 Cell proliferation studies of cancer and normal cells in the presence of EA. (A) Effect of EA on the proliferation of HepG2 and A549 cells. (B) Cytotoxic effects of EA on HEK293 cells as measured by MTT assay. Each cell type was treated with increasing concentrations of EA (0–250 μM) for 48 h. Percentage of viable cells were calculated with respect to the untreated control cells. Each data point shown is the mean ± SD from n = 3. | ||
3.7. Interaction analysis of PDK3-EA complex
To gain deeper insights into the interaction of EA with PDK3, we have performed molecular docking analysis to ascertain its binding affinity, bound confirmations, potential interacting residues, binding energies and intermolecular distances of the interacting residues. We found that EA shows appreciable binding affinity (−7.9 kcal mol−1), and preferentially occupy the ATP-binding site of PDK3 (Table 1). Moreover, EA also interacts with other binding regions within PDK3. EA interacts within the deep cavity of PDK3 and represents tight interactions with binding pocket residues (Fig. 1C and D). EA is placed at the same position where co-crystal ADP is present, and its interaction with PDK3 perhaps can decrease the substrate accessibility of PDK3 and therefore responsible for its inhibition. EA-PDK3 complex consists of five potential hydrogen bonds offered by, Asn251, Asp287, Gly291 and Thr352. The EA occupies a position at distance of 3.1 Å, 3.2 Å and 2.8 Å from Asn251, Asp287 and Gly291, respectively which is essential for the H-bond formation (Fig. 1 and Table 3). Thr352 forms two H-bonds both at 3.0 Å; however, several other interactions such as Pi-alkyl, Pi-sigma and van der Waals with Leu248, Gly289, Gly290, Leu300, Leu328, Leu344, Gly351, Ser252, Ala354, Ala255, Val292 and Arg254 were also observed (Table 3 and Fig. 1B and C). The geometric properties of these H-bonds revealed that they surrounded the active site of PDK3.| S. No. | Interaction type | No. of interactions | Participating residues |
|---|---|---|---|
| 1. | Hydrogen bonds | 5 | Asn251, Asp287, Gly291 and Thr352 |
| 2. | van der Waals | 9 | Leu248, Gly289, Gly290, Leu300, Leu328, Leu344, Gly351, Ser252 and Ala354 |
| 3. | Pi-sigma | 1 | Ala255 |
| 4. | Pi-alkyl | 2 | Ala255 and Val292 |
| 5. | Pi-cation | 1 | Arg254 |
Surface representation shows that EA occupies the deep ATP-binding cavity and interacts with appreciable affinity (Fig. 1D). H-Bonds network formed by Asp287 and Thr352 is essential for the ATP recognition through its adenine base and found to be conserved in GHKL family members, and their mutation leads to the abolition of ATP binding.67 Previous reports indicated the binding and inhibitory effects of radicicol involving Asp287 and Thr352 into the ATP-binding pocket of PDK3.68 Interestingly, both Asp287 and Thr352 within PDK3 participate in polar interaction with EA. Previous reports indicated that the abrogation of interaction formed by these residues could diminish or significantly reduce the catalytic activity of PDK3.69,70 Leu248 forms van der Waals interactions within the EA-PDK3 complex, located adjacent to Asp247 acting as a general base for the activation of phosphorylatable serine in E1p.71 Overall, the binding of EA with ATP-binding cavity stabilizes the interaction and could significantly affect the catalytic activity of PDK3.
3.8. Dynamics of PDK3-EA complex
MD simulations has been extensively used to understand the dynamics of binding mechanism of a ligand to a protein under explicit solvent condition.72 Here, we have performed molecular dynamics simulations of free PDK3, and PDK3-EA docked complex for 100 ns to evaluate the conformational changes, stability and interaction mechanism of PDK3 in-complexed with EA. The average potential energy of free PDK3 and PDK3-EA were calculated to ascertain the equilibration and stability of the systems prior to MD analysis. An average potential energy for free PDK3 and PDK3-EA complex were found to be −2![[thin space (1/6-em)]](https://www.rsc.org/images/entities/char_2009.gif) 307460 kJ mol−1 and −2305890 kJ mol−1, respectively. The volume, density, kinetic energy, enthalpy, and total energies of the systems were also calculated after the simulation (Table 4).
307460 kJ mol−1 and −2305890 kJ mol−1, respectively. The volume, density, kinetic energy, enthalpy, and total energies of the systems were also calculated after the simulation (Table 4).
| Complex | Average RMSD (nm) | Average RMSF (nm) | Average Rg (nm) | Average SASA (nm2) | Kinetic energy | Enthalpy | Volume (nm3) | Density (g l−1) |
|---|---|---|---|---|---|---|---|---|
| PDK3 | 0.59 | 0.18 | 2.14 | 172.64 | 371412 |
−1935960 |
1499.99 | 1011.81 |
| PDK3-EA | 0.61 | 0.21 | 2.16 | 176.96 | 371216 |
−1934580 |
1499.24 | 1011.96 |
Binding of a small molecule in the binding pocket of a protein can lead to large conformational changes.72–75 Root mean square deviation (RMSD) is one of the most important fundamental property to evaluate structural deviation and stability of a protein.76 The average RMSD values for PDK3 and PDK3-EA were found to be 0.59 nm and 0.61 nm, respectively (Table 4). The RMSD plot suggested that the binding of EA stabilized the PDK3 and leads to minimal structural deviations from its native conformation (Fig. 6A). However, several random fluctuations can be observed in RMSD up to 15 ns upon EA binding which is possibly due to its initial orientation in the binding pocket of PDK3. Thereafter, the system attains stable equilibrium throughout the simulation. RMSD plot suggested that the binding of EA to PDK3 does not affect the PDK3 structure. Binding of EA shows least RMSD at several parts and showing equilibration throughout the 100 ns MD simulation which strongly suggests the stability of the PDK3-EA complex (Fig. 6A).
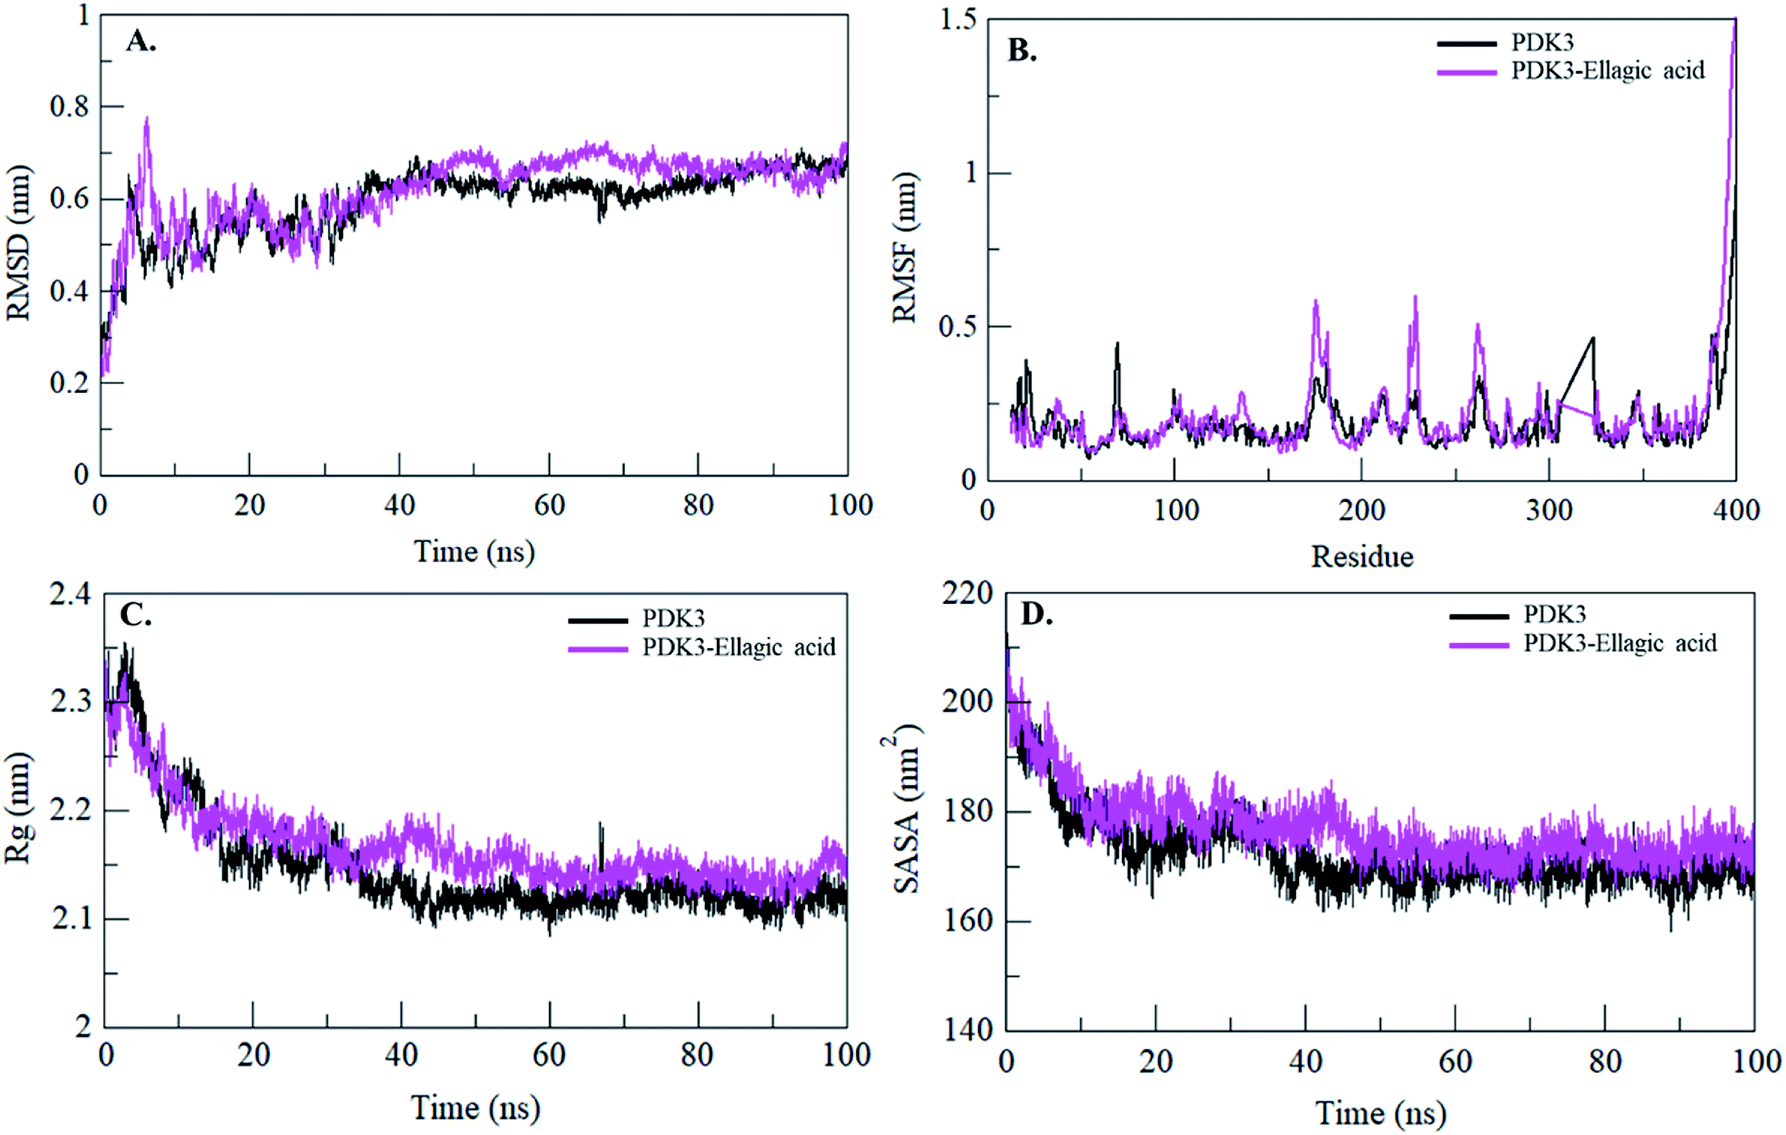 | ||
| Fig. 6 Structural dynamics of PDK3 upon EA binding. (A) RMSD plot of PDK3 as a function of time. (B) RMSF plot of free PDK3 and upon EA binding. (C) Time evolution of radius of gyration. (D) SASA plot of PDK3 as a function of time. The values were obtained from 100 ns MD simulations time scale. Black and magenta represents values obtained for free PDK3 and PDK3-EA complex, respectively. | ||
To see the local structure flexibility, the average fluctuation of all residues calculated as the root-mean square fluctuation (RMSF) of the PDK3 in native form and upon EA binding were plotted during the simulation for each residue (Fig. 6B). RMSF plot shows several residual fluctuations present in PDK3 at distinct regions of overall protein structure. These residual fluctuations found to be minimized upon binding of EA throughout the simulation at region spanning from N- to C-terminal. However, several random residual fluctuations were also seen upon binding of EA (Fig. 6B).
Radius of gyration (Rg) is directly associated with the tertiary structure volume and overall conformational shape of a protein and has been applied to obtain insight into the stability of the protein in a biological system. A protein is supposed to have the higher Rg due to flexible packing. The average Rg values for free PDK3 and PDK3-EA were found to be 2.14 nm and 2.16 nm, respectively. Rg plot shows no major deviations in the packing of PDK3 in presence of EA as a dynamic ensemble. Rg plot is showing initial higher compactness until 15 ns of MD trajectory which may be due to the tight packing of the protein; but thereafter, the protein attained stable Rg equilibrium throughout the simulation (Fig. 6C). Rg plot suggesting minimal structural deviation and, no conformational shift of PDK3 upon EA binding. Rg plot showing that PDK3 is tightly packed throughout the simulation even after EA binding.
The Solvent Accessible Surface Area (SASA) is the surface area of a protein which interacts with its surrounding solvent.77 SASA is directly related to the Rg of a protein. The average SASA values for PDK3 and PDK3-EA complex were calculated during 100 ns MD simulations. The average SASA values for PDK3 alone and in-complexed with EA were found to be 172.64 nm2, and 176.96 nm2, respectively. Slight increment in SASA of PDK3 was observed upon EA binding (Fig. 6D). This increment in SASA can be presumed as some of the internal residues in PDK3 are exposed to solvent due to its conformational change arises due to binding of EA.
3.9. Dynamics of interactions in the PDK3-EA complex
Intramolecular hydrogen bonding is a fundamental aspect of protein stability.78 H-Bonds analysis can also be utilized to evaluate the stability of polar interactions between a protein and ligand providing directionality and specificity of interaction which is a fundamental aspect of molecular recognition.78 To evaluate and validate the stability of free-PDK3 and PDK3 in complexed with docked EA, the H-bonds along with the bonds paired within 0.35 nm were calculated during the 100 ns MD simulation. The average number of H-bonds in PDK3 itself before and after EA binding were found to be 293 and 287 respectively (Fig. 7A). The average number of hydrogen bonds between PDK3 and EA were also calculated where an average of 5 hydrogen bonds were formed throughout the simulation (Fig. 7B). H-Bonds analysis with MD simulation revealed that EA binds in the active pocket of PDK3 with 6–8 hydrogen bonds with higher fluctuations, and 4–6 hydrogen bonds with least fluctuations which also supports our molecular docking findings (Fig. 7B). The bonds paired within 0.35 nm were found to be an average of 8 bonds (Fig. 7C).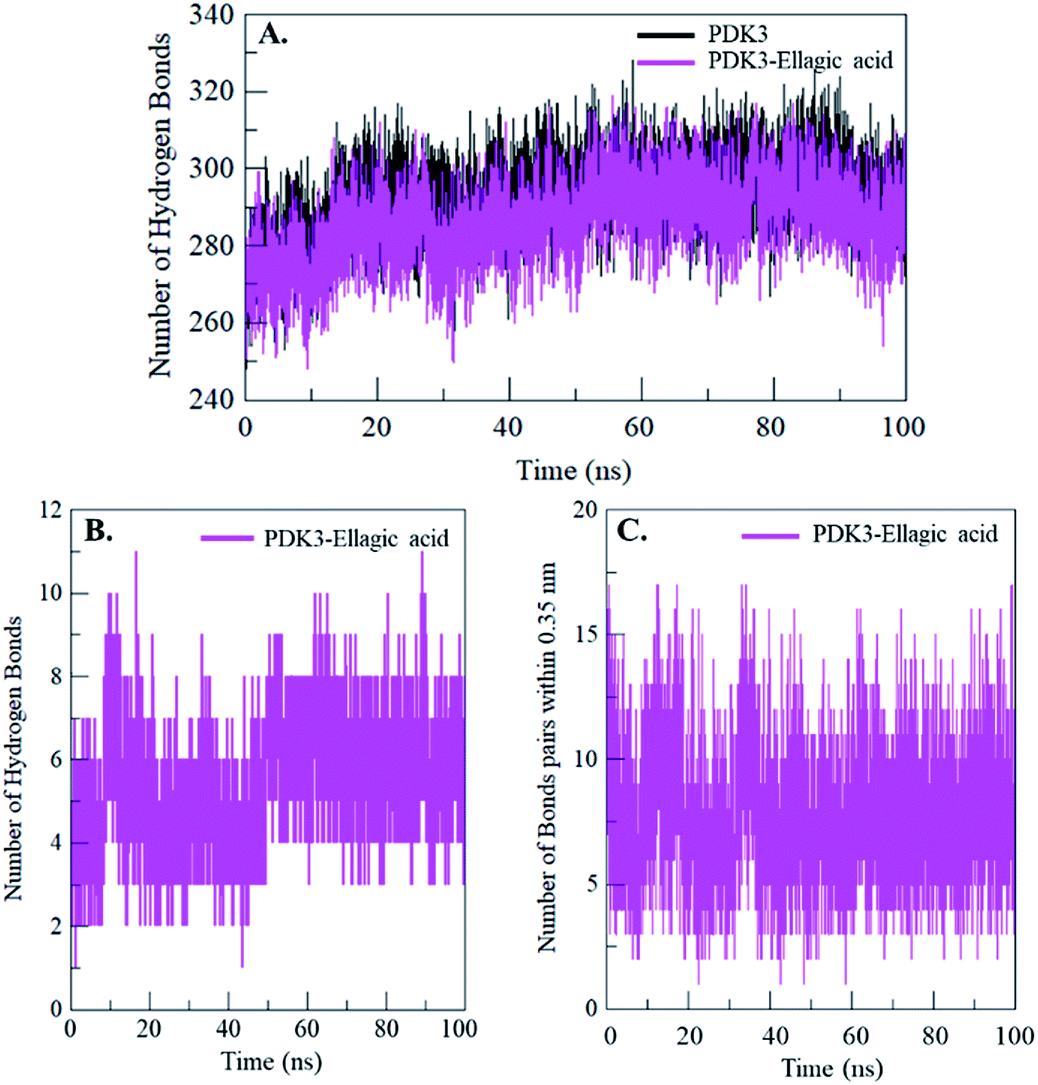 | ||
| Fig. 7 Time evolution and stability of hydrogen bonds formed (A) intra-PDK3, (B) hydrogen bonds between EA and PDK3, and (C) bonds paired within 0.35 nm between EA and PDK3. | ||
3.10. Secondary structure changes in PDK3-EA complex
Secondary structural components of PDK3 were calculated to measure the changes in overall structural content upon EA binding as a function of time. The secondary structure elements such as α-helix, β-sheet and turns in PDK3 were broken into individual residues for each time step, and the average number of residues involved in secondary structure formation were plotted as a function of time. The structural elements in free-PDK3 remain almost constant and equilibrated during the entire simulation (Fig. 8). Although, a little decrement in α-helix and β-bridges can be seen in PDK3 upon EA binding (Fig. 8B). The average number of residues participated in secondary structure formation in case of PDK3-EA complex were found to be slightly decreased due to coil and bend formation as compared with free PDK3 (Fig. 8 and Table S1†). Here, no major changes were seen in secondary structure content of PDK3 upon EA binding which further supports a strong stability of the complex.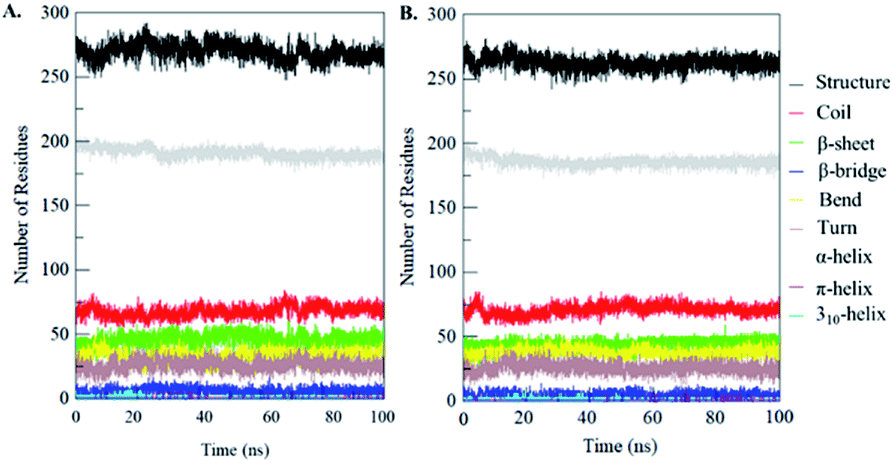 | ||
| Fig. 8 Secondary structure content of (A) free PDK3 and (B) PDK3 upon EA binding. *Structure = α-helix + β-sheet + β-bridge + turn. | ||
3.11. Principal component and free energy landscape analyses
Proteins perform their specific functions through collective atomic motions which can be utilized as a useful parameter to understand the stability of a protein. Principal component analysis (PCA) is used to investigate the global motion of a protein into a few principal motions characterized by eigenvectors. The conformational sampling of free PDK3 and PDK3-EA complex in the essential subspace is shown in Fig. 9A which represents 2D projection of the tertiary conformations along the eigenvector 1 and 2 projected by the Cα atom (Fig. 9B). A cluster of stable states in PDK3 clearly depict that the protein covers a wider range of phase spaces in presence of EA, but no overall switching was observed in motion of PDK3 after binding of EA (Fig. 9).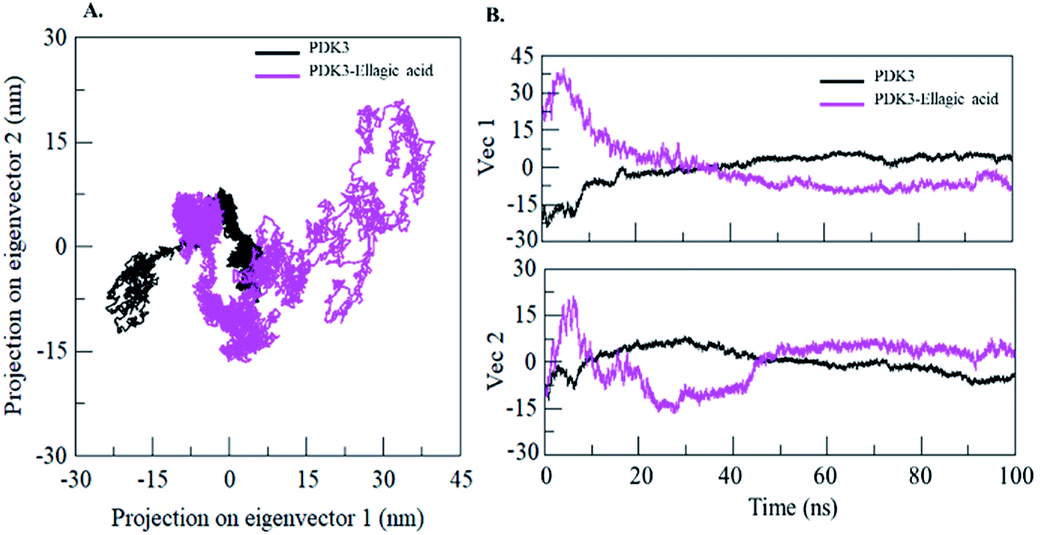 | ||
| Fig. 9 Principal component analysis. (A) 2D projections of trajectories on eigenvectors showing different projections of PDK3. (B) The projections of trajectories on eigenvectors plotted with respect to time. Black and magenta represents values obtained for free PDK3 and PDK3-EA complex, respectively. | ||
To further understand the conformational behaviour of the systems, the Gibbs free energy landscapes (FELs) were analysed using the first two eigenvectors. The FELs of both the systems are shown in Fig. 10. The FEL of PDK3 depicts 1–2 stable global minima confined within majorly 2–3 basin. However, we observed a noticeable change in the conformational behaviour which progress to multiple energy minima acquired by PDK3 in presence of EA (Fig. 10).
 | ||
| Fig. 10 The Gibbs free energy landscape obtained during 100 ns MD simulation of (A) free PDK3 and (B) PDK3-EA complex. | ||
4. Discussion
The energetic needs of cancer cells are different from the cells/tissues they are derived from due to which these cells constantly modify their usage of metabolites according to their requirements. The altered metabolism of cancer cells involves increased glycolysis regardless of the oxygen presence, a phenomenon known as Warburg effect.79,80 Increase glycolysis constitutes a hallmark of metabolic switch in cancer which allows to produce enough energy for survival in limited resources. In normal cells, metabolic activities primarily depend on the mitochondrial OXPHOS for the generation of ATP. In contrast, in cancer cells, OXPHOS is reduced and glycolysis is substantially enhanced for energy demands. The diversion of OXPHOS to aerobic glycolysis also provides metabolic intermediates to support cell proliferation. Interestingly, since the metabolism of cancer cells is reversible, it therefore represents a therapeutic target. Thus, targeting cancer cells which are addicted to glycolysis with the use of molecules that mimic energy restriction could be a promising therapeutic approach.Aerobic glycolysis and loss of OXPHOS in many cancers is due to the inactivation of pyruvate dehydrogenase complex (PDC) through the combined actions of PDKs. PDC is responsible for the catalytic conversion of pyruvate to acetylCoA which then supplies the procession of mitochondrial respiration. PDC substrate pyruvate affects the activity of PDK1, -2, and -4, but not PDK3 through feedback inhibition.15,81 PDK3 belongs to GHKL (DNA ![[G with combining low line]](https://www.rsc.org/images/entities/char_0047_0332.gif) yrase B,
yrase B, ![[H with combining low line]](https://www.rsc.org/images/entities/char_0048_0332.gif) sp90, histidine
sp90, histidine ![[k with combining low line]](https://www.rsc.org/images/entities/char_006b_0332.gif) inases, and Mut
inases, and Mut![[L with combining low line]](https://www.rsc.org/images/entities/char_004c_0332.gif) ) ATPase/kinase superfamily which share four conserved structural motifs (N-, G1-, G2-, and G3-boxes) and forms a unique ATP-binding fold which consists of an ‘ATP lid’.65 This distinct quality of PDK3 renders it with the inhibitory functions against PDC and implicates its utmost importance in the cancer cells metabolic switch.82 In cancers, overexpressed PDK3 levels are positively correlated with the metastatic progression and therefore PDK3 is identified as a prominent target in cancer therapy.16,22 Cancer cells face severe hypoxic stress with an increased size of tumor along with the slow growth of blood vessels83 which is responded through the expression of HIF-regulated genes which modulate the cancer proliferation, migration, angiogenesis, and metastasis.84 Interestingly, HIF-1α levels substantially upregulates PDK3 levels which correlates with disease severity and early recurrence further contributing to the hypoxia-driven drug resistance in tumors.21
) ATPase/kinase superfamily which share four conserved structural motifs (N-, G1-, G2-, and G3-boxes) and forms a unique ATP-binding fold which consists of an ‘ATP lid’.65 This distinct quality of PDK3 renders it with the inhibitory functions against PDC and implicates its utmost importance in the cancer cells metabolic switch.82 In cancers, overexpressed PDK3 levels are positively correlated with the metastatic progression and therefore PDK3 is identified as a prominent target in cancer therapy.16,22 Cancer cells face severe hypoxic stress with an increased size of tumor along with the slow growth of blood vessels83 which is responded through the expression of HIF-regulated genes which modulate the cancer proliferation, migration, angiogenesis, and metastasis.84 Interestingly, HIF-1α levels substantially upregulates PDK3 levels which correlates with disease severity and early recurrence further contributing to the hypoxia-driven drug resistance in tumors.21
Numerous challenges hamper effective cancer treatment and the most threatening of all is the high cytotoxity of drugs, various side-effects caused by their non-specific distribution within tissues, cancer cells resistance acquired in their course further triggering cross-resistance to a wide range of different drugs. In line with the challenges raised by many anti-cancer drugs, the most promising approaches involved the usage of natural compounds with effective therapeutic significances. Naturally produced bioactive compounds like carotenoids, anthocyanins, phenolic compounds like flavonoids, lignins, tannins, and tocopherols are rich source of antioxidants.85 Numerous phytochemicals are non-cytotoxic, have significant therapeutic potential and are better option for drug designing. Dietary polyphenols potentially inhibit tumor growth and development, angiogenesis, metastasis through induction of apoptosis.86–89 Consumption of plant products are recommended for several health benefits including numerous medicinal properties along with high nutritional value.90 Due to the established roles of many plant products as significant anti-cancer agents, more than 60% of known plants are in use in pharmaceutical studies without imposing major side effects.27 Moreover, bioactive flavonoids are reported in the inhibition of various kinases involved in cancer signalling. Due to their immense importance as antioxidants and anti-cancer molecules, we investigated the potential of selected polyphenolic compounds in the inhibition of PDK3.
To ascertain the structural features and the mechanism of inhibition along with the analysis of the binding patterns and binding affinities, we performed molecular docking of selected polyphenols with PDK3. Molecular docking allows the evaluation of binding prototype of protein–ligand interactions using theoretical approach which save the cost, resources and time needed to perform binding screening experimentally. Docking analysis revealed the strong binding affinity of EA (−7.9 kcal mol−1) followed by limonin with a binding affinity of −7.7 kcal mol−1 along with other natural polyphenols towards PDK3 (Table 1). The PDK3 complexes formed by these polyphenols are stabilized by various interactions with the major binding residues of ATP-binding pocket (Fig. S2 and S3†). To further evaluate the binding affinities of these compounds with PDK3, we performed fluorescence quenching experiment studies to understand their roles as PDK3 inhibitor in detail (Fig. S4–S6†). Fluorescence experiments revealed a very strong interaction of EA with PDK3 in nanomolar concentrations (Fig. 3). Since, we observed an appreciable binding of EA with PDK3 as compared to other polyphenols, therefore, its several metabolic properties encouraged us to identify its inhibitory potential against PDK3 kinase.
We further complemented these strong binding affinities by estimating the thermodynamic parameters of PDK3-EA complex by ITC experiments (Fig. 3C and Table 2). Moreover, we also checked the ATPase activity of purified PDK3 with enzyme inhibition assay in the presence of increasing amount of EA (Fig. 4). The ATP-binding pocket of the PDK3 protein located at the C-terminal domain forms a very distinct ATP-lid which adopts a P-loop conformation (Fig. S1†). The ATP-lid closes the nucleotide-binding site through its specific binding to the nucleotide phosphates mediated by its main chain imino groups.91,92 Interestingly, EA substantially down regulates the kinase activity of PDK3 with an IC50 value of ∼5 μM. Our result supports the idea that inhibiting PDK3 with EA could downregulate the phosphorylation of PDC and might support the revival of metabolic OXPHOS in cancer cells.
EA is an antioxidant polyphenol which has many pharmacological significances, previously shown to cause apoptosis, cell cycle arrest, and strong anti-proliferative potential against cancer41,66,93,94 and thus considered as a promising therapeutic anticancer compound. We further investigated the cytotoxicity and antiproliferative potential of EA on HepG2, A549 and HEK293 cells. Analysis of the effects of EA on cytotoxicity and cellular viability indicated that it significantly inhibits the growth of cancer cells in a dose dependent manner (Fig. 5).
To further check the stability of PDK3 in complexed with EA, we performed all-atoms MD simulation for 100 ns. Numerous spectacular structural-functional aspects of proteins and their underlying profound dynamic mechanisms can be investigated by analysing their internal motions.72,95 The conformational stability of the complex and interaction mechanism was estimated with the simulation analysis. Interaction of even a very small molecule in the binding cavity of a protein can lead to very large conformational changes within the protein.72–75 During the MD simulations, it was observed that PDK3 showed minimal conformational changes upon EA binding as revealed from RMSD, RMSF and Rg trajectories throughout the simulation (Fig. 6). However, several random fluctuations can be seen at initial time, but no conformational switching was observed during the entire simulation. This analysis suggests a strong stability of PDK3 upon EA binding.
Overall, our results imply that since PDK3 is considered as an important drug target through its function as a positive regulator of cancer progression, proliferation and migration, therefore, targeting PDK3 with EA can be used to regulate pathways with potential effects on cancer, diabetes, myocardial ischemia along with other metabolic shifts. Understanding the complexity of the metabolic switching of cancer cells will help to develop new approaches in effective and targeted therapy. Our approach will be proved useful in the designing of drugs using potential leads from EA and other polyphenols as potent inhibitors of PDK3 against cancer and act as therapeutic models for metabolic reprogramming.
5. Conclusions
Here, we successfully cloned and purified hPDK3 (residues 1–406). Primarily, eight bioactive polyphenolic compounds were evaluated as potent inhibitor of PDK3. Molecular docking was performed to ascertain the interaction between the selected dietary polyphenols with PDK3 which suggested that the binding mode of all the selected natural compounds is similar to the crystal ligand as in PDK3–ADP complex. Results of docking analysis showed that these polyphenols bind to PDK3 with a common set of amino acid residues. EA shows highest binding affinity, as evident from the fluorescence quenching and ITC experiments and thus inhibits enzyme activity of PDK3. Fluorescence experiments revealed that EA and limonin along with DL-α-tocopherol exhibits significant fluorescence quenching effects at nanomolar and micromolar concentrations respectively. MD simulation was also performed to ascertain the conformational stability of PDK3-EA complex which revealed that EA forms a highly stable complex with PDK3 and resulted in minimal structural variations as observed with RMSD and RMSF plots. EA showed a superior anti-proliferative and minimal cytotoxic activity towards the cancer (A549 and HepG2) and normal cells (HEK293), respectively. Overall, our findings provide a strong evidence that EA is a promising compound to inhibit PDK3 and can be further exploited as a scaffold lead to design potent and selective molecules against PDK3 to ameliorate cancer progression.Conflicts of interest
There are no conflicts to declare.Acknowledgements
RD and MIH acknowledge the Indian Council of Medical Research for the financial support (Grant No. BIC/12(01)/2015). TM acknowledge the University Grants Commission, India for the award of Maulana Azad National Fellowship. MFA acknowledge the generous support from the Deanship of Scientific Research at King Saud University, Riyadh, Kingdom of Saudi Arabia (Grant No. RGP-150).References
- G. Manning, D. B. Whyte, R. Martinez, T. Hunter and S. Sudarsanam, Science, 2002, 298, 1912–1934 CrossRef CAS PubMed.
- G. Manning, G. D. Plowman, T. Hunter and S. Sudarsanam, Trends Biochem. Sci., 2002, 27, 514–520 CrossRef CAS PubMed.
- K. S. Bhullar, N. O. Lagarón, E. M. McGowan, I. Parmar, A. Jha, B. P. Hubbard and H. P. V. Rupasinghe, Mol. Cancer, 2018, 17, 48 CrossRef PubMed.
- K. M. Popov, N. Y. Kedishvili, Y. Zhao, Y. Shimomura, D. W. Crabb and R. A. Harris, J. Biol. Chem., 1993, 268, 26602–26606 CAS.
- R. A. Harris, K. M. Popov, Y. Zhao, N. Y. Kedishvili, Y. Shimomura and D. W. Crabb, Adv. Enzyme Regul., 1995, 35, 147–162 CrossRef CAS PubMed.
- M. S. Patel and T. E. Roche, FASEB J., 1990, 4, 3224–3233 CrossRef CAS PubMed.
- R. Gudi, M. M. Bowker-Kinley, N. Y. Kedishvili, Y. Zhao and K. M. Popov, J. Biol. Chem., 1995, 270, 28989–28994 CrossRef CAS PubMed.
- Z. H. Zhou, D. B. McCarthy, C. M. O'Connor, L. J. Reed and J. K. Stoops, Proc. Natl. Acad. Sci. U. S. A., 2001, 98, 14802–14807 CrossRef CAS PubMed.
- M. Smolle, A. E. Prior, A. E. Brown, A. Cooper, O. Byron and J. G. Lindsay, J. Biol. Chem., 2006, 281, 19772–19780 CrossRef CAS PubMed.
- Y. Hiromasa, T. Fujisawa, Y. Aso and T. E. Roche, J. Biol. Chem., 2004, 279, 6921–6933 CrossRef CAS PubMed.
- G. J. Sale and P. J. Randle, Eur. J. Biochem., 1981, 120, 535–540 CrossRef CAS PubMed.
- S. J. Yeaman, E. T. Hutcheson, T. E. Roch, F. H. Pettit, J. R. Brown, L. J. Reed, D. C. Watson and G. H. Dixon, Biochemistry, 1978, 17, 2364–2370 CrossRef CAS PubMed.
- S. Liu, J. C. Baker and T. E. Roche, J. Biol. Chem., 1995, 270, 793–800 CrossRef CAS PubMed.
- T. E. Roche and Y. Hiromasa, Cell. Mol. Life Sci., 2007, 64, 830–849 CrossRef CAS PubMed.
- J. C. Baker, X. Yan, T. Peng, S. Kasten and T. E. Roche, J. Biol. Chem., 2000, 275, 15773–15781 CrossRef CAS PubMed.
- C. W. Lu, S. C. Lin, C. W. Chien, S. C. Lin, C. T. Lee, B. W. Lin, J. C. Lee and S. J. Tsai, Am. J. Pathol., 2011, 179, 1405–1414 CrossRef CAS PubMed.
- K. Toustrup, B. S. Sørensen, M. Nordsmark, M. Busk, C. Wiuf, J. Alsner and J. Overgaard, Cancer Res., 2011, 71, 5923–5931 CrossRef CAS PubMed.
- D. M. Aebersold, P. Burri, K. T. Beer, J. Laissue, V. Djonov, R. H. Greiner and G. L. Semenza, Cancer Res., 2001, 61, 2911–2916 CAS.
- S. Rockwell, I. Dobrucki, E. Kim, S. Marrison and V. Vu, Curr. Mol. Med., 2009, 9, 442–458 CrossRef CAS PubMed.
- C. Holohan, S. Van Schaeybroeck, D. B. Longley and P. G. Johnston, Nat. Rev. Cancer, 2013, 13, 714 CrossRef CAS PubMed.
- C. W. Lu, S. C. Lin, K. F. Chen, Y. Y. Lai and S. J. Tsai, J. Biol. Chem., 2008, 283, 28106–28114 CrossRef CAS PubMed.
- J. Kluza, P. Corazao-Rozas, Y. Touil, M. Jendoubi, C. Maire, P. Guerreschi, A. Jonneaux, C. Ballot, S. Balayssac, S. Valable, A. Corroyer-Dulmont, M. Bernaudin, M. Malet-Martino, E. M. De Lassalle, P. Maboudou, P. Formstecher, R. Polakowska, L. Mortier and P. Marchetti, Cancer Res., 2012, 72, 5035–5047 CrossRef CAS PubMed.
- M. L. Kennerson, E. M. Yiu, D. T. Chuang, A. Kidambi, S. C. Tso, C. Ly, R. Chaudhry, A. P. Drew, G. Rance, M. B. Delatycki, S. Züchner, M. M. Ryan and G. A. Nicholson, Hum. Mol. Genet., 2013, 22, 1404–1416 CrossRef CAS PubMed.
- G. Perez-Siles, C. Ly, A. Grant, A. P. Drew, E. M. Yiu, M. M. Ryan, D. T. Chuang, S. C. Tso, G. A. Nicholson and M. L. Kennerson, Neurobiol. Dis., 2016, 94, 237–244 CrossRef CAS PubMed.
- M. L. Kennerson, E. J. Kim, A. Siddell, A. Kidambi, S. M. Kim, Y. B. Hong, S. H. Hwang, K. W. Chung and B. O. Choi, J. Peripher. Nerv. Syst., 2016, 21, 45–51 CrossRef CAS PubMed.
- J. Mann, Nat. Rev. Cancer, 2002, 2, 143 CrossRef CAS PubMed.
- A. Desai, G. Qazi, R. Ganju, M. El-Tamer, J. Singh, A. Saxena, Y. Bedi, S. Taneja and H. Bhat, Curr. Drug Metab., 2008, 9, 581–591 CrossRef CAS PubMed.
- A. N. Panche, A. D. Diwan and S. R. Chandra, J. Nutr. Sci., 2016, 5, 1–15 CrossRef PubMed.
- G. Beecher, J. Nutr., 2003, 133, 3248S–3254S CrossRef CAS PubMed.
- L. H. Yao, Y. M. Jiang, J. Shi, F. A. Tomás-Barberán, N. Datta, R. Singanusong and S. S. Chen, Plant Foods Hum. Nutr., 2004, 59, 113–122 CrossRef CAS PubMed.
- W. Ren, Z. Qiao, H. Wang, L. Zhu and L. Zhang, Med. Res. Rev., 2003, 23, 519–534 CrossRef CAS PubMed.
- A. M. Bower, L. M. Real Hernandez, M. A. Berhow and E. G. De Mejia, J. Agric. Food Chem., 2014, 62, 6147–6158 CrossRef CAS PubMed.
- J. Y. Dong and L. Q. Qin, Breast Cancer Res. Treat., 2011, 125, 315–323 CrossRef CAS PubMed.
- D. F. Romagnolo and O. I. Selmin, J. Nutr. Gerontol. Geriatr., 2012, 31, 206–238 CrossRef PubMed.
- F. Shahidi and J. D. Yeo, Int. J. Mol. Sci., 2018, 19, 1573 CrossRef PubMed.
- P. Batra and A. K. Sharma, 3 Biotech, 2013, 3, 439–459 CrossRef PubMed.
- S. Kumar and A. K. Pandey, Sci. World J., 2013, 2013, 1–16 Search PubMed.
- S. Schmitt-Schillig, S. Schaffer, C. C. Weber, G. P. Eckert and W. E. Müller, J. Physiol. Pharmacol., 2005, 56, 23–36 Search PubMed.
- C. S. Patil, V. P. Singh, P. S. V. Satyanarayan, N. K. Jain, A. Singh and S. K. Kulkarni, Pharmacology, 2003, 69, 59–67 CrossRef CAS PubMed.
- S. Chirumbolo, G. Bjørklund, R. Lysiuk, A. Vella, L. Lenchyk and T. Upyr, Int. J. Mol. Sci., 2018, 19, 3568 CrossRef PubMed.
- L. Vanella, I. Barbagallo, R. Acquaviva, C. Di Giacomo, V. Cardile, N. G. Abraham and V. Sorrenti, Curr. Pharm. Des., 2013, 19, 2728–2736 CrossRef CAS PubMed.
- R. Gualdani, M. M. Cavalluzzi, G. Lentini and S. Habtemariam, Molecules, 2016, 21, 1530 CrossRef PubMed.
- S. T. Wang, H. J. Ho, J. T. Lin, J. J. Shieh and C. Y. Wu, Cell Death Dis., 2017, 8, e2626 CrossRef CAS PubMed.
- N. Dudai, Y. Weinstein, M. Krup, T. Rabinski and R. Ofir, Planta Med., 2005, 5, 484–488 CrossRef PubMed.
- R. Clark and S.-H. Lee, Anticancer Properties of Capsaicin Against Human Cancer, Anticancer Res., 2016, 36, 837–843 CAS.
- E. J. Park, Y. M. Lee, T. I. Oh, B. M. Kim, B. O. Lim and J. H. Lim, Int. J. Mol. Sci., 2017, 18, 532 CrossRef PubMed.
- G. Sigounas, A. Anagnostou and M. Steiner, Nutr. Cancer, 1997, 28, 30–35 CrossRef CAS PubMed.
- Ł. Woźniak, S. Skąpska and K. Marszałek, Molecules, 2015, 20, 20614–20641 CrossRef PubMed.
- M. R. Loizzo, A. Pugliese, M. Bonesi, M. C. Tenuta, F. Menichini, J. Xiao and R. Tundis, J. Agric. Food Chem., 2016, 64, 2467–2474 CrossRef CAS PubMed.
- M. E. Goetz, S. E. Judd, T. J. Hartman, W. McClellan, A. Anderson and V. Vaccarino, J. Nutr., 2016, 146, 2233–2243 CrossRef CAS PubMed.
- J. Sambrook and D. W. Russell, Molecular Cloning: A Laboratory Manual, Cold Spring Harbor Laboratory, New York, 3th edn, 2001 Search PubMed.
- W. L. Delano, The PyMOL Molecular Graphics System, Schrodinger, p. 240061 Search PubMed.
- W. L. DeLano, PyMOL: An open-source molecular graphics tool, CCP4 Newsl. Protein Crystallogr., 2002, vol. 40, pp. 82–92 Search PubMed.
- W. Humphrey, A. Dalke and K. Schulten, J. Mol. Graphics, 1996, 14, 33–38 CrossRef CAS.
- P. Turner, XMGRACE, Version 5.1. 19, Cent. Coast. Land-Margin Res. Oregon Grad. Inst. Sci. Technol., Beavert., 2005, vol. 5 Search PubMed.
- N. Guex and M. C. Peitsch, Electrophoresis, 1997, 18, 2714–2723 CrossRef CAS PubMed.
- N. Guex, M. C. Peitsch and T. Schwede, Electrophoresis, 2009, 30, S162–S173 CrossRef PubMed.
- S. M. D. Rizvi, S. Shakil and M. Haneef, EXCLI J., 2013, 12, 831 Search PubMed.
- S. M. Kerwin, ChemBioOffice Ultra 2010 suite, J. Am. Chem. Soc., 2010, 2466–2467 CrossRef CAS PubMed.
- T. Oleg and O. J. Arthur, J. Comput. Chem., 2010, 31, 455–461 Search PubMed.
- Accelrys, Materials Studio is a Software Environment for Molecular Modeling, Discovery, 2009 Search PubMed.
- M. Voura, P. Khan, S. Thysiadis, S. Katsamakas, A. Queen, G. M. Hasan, S. Ali, V. Sarli and M. I. Hassan, Sci. Rep., 2019, 8, 1676 CrossRef PubMed.
- A. Queen, P. Khan, D. Idrees, A. Azam and M. I. Hassan, Int. J. Biol. Macromol., 2018, 106, 840–850 CrossRef CAS PubMed.
- M. Gulzar, S. B. Syed, F. I. Khan, P. Khan, S. Ali, G. M. Hasan, P. Taneja and M. I. Hassan, Int. J. Biol. Macromol., 2019, 122, 1297–1304 CrossRef CAS PubMed.
- R. Dutta and M. Inouye, Trends Biochem. Sci., 2000, 25, 24–28 CrossRef CAS PubMed.
- Q. Liu, X. Liang, C. Niu and X. Wang, Exp. Ther. Med., 2018, 16, 347–352 Search PubMed.
- M. Bowker-Kinley and K. M. Popov, Biochem. J., 1999, 344, 47–53 CrossRef CAS PubMed.
- M. Kato, J. Li, J. L. Chuang and D. T. Chuang, Structure, 2007, 15, 992–1004 CrossRef CAS PubMed.
- M. Kato, J. L. Chuang, S. C. Tso, R. M. Wynn and D. T. Chuang, EMBO J., 2005, 24, 1763–1774 CrossRef CAS PubMed.
- P. A. Brough, L. Baker, S. Bedford, K. Brown, S. Chavda, V. Chell, J. D'Alessandro, N. G. M. Davies, B. Davis and L. Le Strat, et. al., J. Med. Chem., 2017, 60, 2271–2286 CrossRef CAS PubMed.
- R. M. Wynn, M. Kato, J. L. Chuang, S. C. Tso, J. Li and D. T. Chuang, J. Biol. Chem., 2008, 25305–25315 CrossRef CAS PubMed.
- T. Mohammad, F. I. Khan, K. A. Lobb, A. Islam, F. Ahmad and M. I. Hassan, J. Biomol. Struct. Dyn., 2018, 107, 2580–2589 Search PubMed.
- S. A. Ali, M. I. Hassan, A. Islam and F. Ahmad, Curr. Protein Pept. Sci., 2014, 15, 456–476 CrossRef CAS PubMed.
- F. I. Khan, M. Shahbaaz, K. Bisetty, A. Waheed, W. S. Sly, F. Ahmad and M. I. Hassan, Gene, 2016, 576, 36–44 CrossRef CAS PubMed.
- F. I. Khan, D. Q. Wei, K. R. Gu, M. I. Hassan and S. Tabrez, Int. J. Biol. Macromol., 2016, 85, 48–62 CrossRef CAS PubMed.
- A. Kuzmanic and B. Zagrovic, Biophys. J., 2010, 98, 861–871 CrossRef CAS PubMed.
- Y. Mazola, O. Guirola, S. Palomares, G. Chinea, C. Menéndez, L. Hernández and A. Musacchio, J. Mol. Model., 2007, 24, 379–392 Search PubMed.
- A. Beg, F. I. Khan, K. A. Lobb, A. Islam, F. Ahmad and M. I. Hassan, J. Biomol. Struct. Dyn., 2019, 37, 2179–2192 CrossRef CAS PubMed.
- W. H. Koppenol, P. L. Bounds and C. V. Dang, Nat. Rev. Cancer, 2011, 11, 325 CrossRef CAS PubMed.
- S.-M. Jeon and N. Hay, Exp. Mol. Med., 2016, 48, e245 CrossRef CAS PubMed.
- M. M. Bowker-Kinley, W. I. Davis, P. Wu, R. A. Harris and K. M. Popov, Biochem. J., 1998, 329, 191–196 CrossRef CAS PubMed.
- P. W. Stacpoole, J. Natl. Cancer Inst., 2017, 109, 1–14 CrossRef PubMed.
- J. M. Brown and A. J. Giaccia, Cancer Res., 1998, 58, 1408–1416 CAS.
- G. L. Semenza, Oncogene, 2010, 29, 625 CrossRef CAS PubMed.
- M. S. Brewer, Compr. Rev. Food Sci. Food Saf., 2011, 10, 221–247 CrossRef CAS.
- D. N. Syed, F. Afaq and H. Mukhtar, Semin. Cancer Biol., 2007, 17, 375–385 CrossRef PubMed.
- D. N. Syed, Y. Suh, F. Afaq and H. Mukhtar, Cancer Lett., 2008, 265, 167–176 CrossRef CAS PubMed.
- P. Khan, S. Rahman, A. Queen, S. Manzoor, F. Naz, G. M. Hasan, S. Luqman, J. Kim, A. Islam, F. Ahmad and M. I. Hassan, Sci. Rep., 2017, 7, 9470 CrossRef PubMed.
- H. Amawi, C. R. Ashby, T. Samuel, R. Peraman and A. K. Tiwari, Nutrients, 2017, 9, 911 CrossRef PubMed.
- J. L. Slavin and B. Lloyd, Adv. Nutr., 2012, 3, 506–516 CrossRef CAS PubMed.
- Y. Devedjiev, C. N. Steussy and D. G. Vassylyev, J. Mol. Biol., 2007, 370, 407–416 CrossRef CAS PubMed.
- M. Saraste, P. R. Sibbald and A. Wittinghofer, Trends Biochem. Sci., 1990, 15, 430–434 CrossRef PubMed.
- N. Wang, Z. Y. Wang, S. L. Mo, T. Y. Loo, D. M. Wang, H. Bin Luo, D. P. Yang, Y. L. Chen, J. G. Shen and J. P. Chen, Breast Cancer Res. Treat., 2012, 134, 943–955 CrossRef CAS PubMed.
- T. Zhang, H.-S. Chen, L.-F. Wang, M.-H. Bai, Y.-C. Wang, X.-F. Jiang and M. Liu, Asian Pac. J. Cancer Prev., 2014, 15, 273–276 CrossRef PubMed.
- J. F. Wang and K. C. Chou, Biochem. Biophys. Res. Commun., 2009, 390, 608–612 CrossRef CAS PubMed.
Footnote |
| † Electronic supplementary information (ESI) available. See DOI: 10.1039/c9ra02864a |
| This journal is © The Royal Society of Chemistry 2019 |