 Open Access Article
Photolysis of carboxymethylflavin in aqueous and organic solvent: a kinetic study†
Iqbal Ahmad a,
Tania Mirzaa,
Syed Ghulam Musharraf
 b,
Zubair Anwar
 *a,
Muhammad Ali Sheraz
 a,
Sofia Ahmed
 a,
Muhammad Ahsan Ejaza and
Adeela Khurshida
aBaqai Institute of Pharmaceutical Sciences, Baqai Medical University, Super Highway, Gadap Road, Near Toll Plaza, Karachi, Pakistan. E-mail: zubair_ana@hotmail.com
bHEJ Research Institute of Chemistry, University of Karachi, Karachi-75270, Pakistan
First published on 27th August 2019
Abstract
This is the first study on the photolysis of carboxymethylflavin (CMF), an intermediate in the photolysis of riboflavin (RF). CMF is photodegraded by removal of side-chain to lumichrome (LC) in acid solution and to LC and lumiflavin (LF) in alkaline solution. It also undergoes alkaline hydrolysis to 1,2-dihydro-1-methyl-2-keto-3-quinoxaline carboxylic acid (KA) and 1,2,3,4-tetrahydro-1-methyl-2,3-dioxoquinoxaline (DQ) by cleavage of isoalloxazine ring. CMF degrades to LC in organic solvents. The formation of LC in acid solution and organic solvents takes place by second-order reaction and those of LC, LF, KA and DQ in alkaline solution by first-order reactions. The values of second-order rate constants for the photolysis of CMF at pH 2.0 to 7.0 are in the range of 1.13 to 2.45 M−1 s−1 and those of first-order rate constants (kobs) at pH 8.0–12.0 from 1.53 to 4.18 × 10⁻⁴ s−1 and for the formation of photoproducts from 0.37 to 16.6 × 10⁻⁵ s−1. The photolysis of CMF is enhanced, with pH, in the alkaline region since the excited state is sensitive to alkaline hydrolysis. The photolysis and fluorescence quantum yields of CMF in aqueous and organic solvents have been reported. CMF and photoproducts have been assayed spectrofluorimetrically. The mode of CMF photolysis is discussed.
Introduction
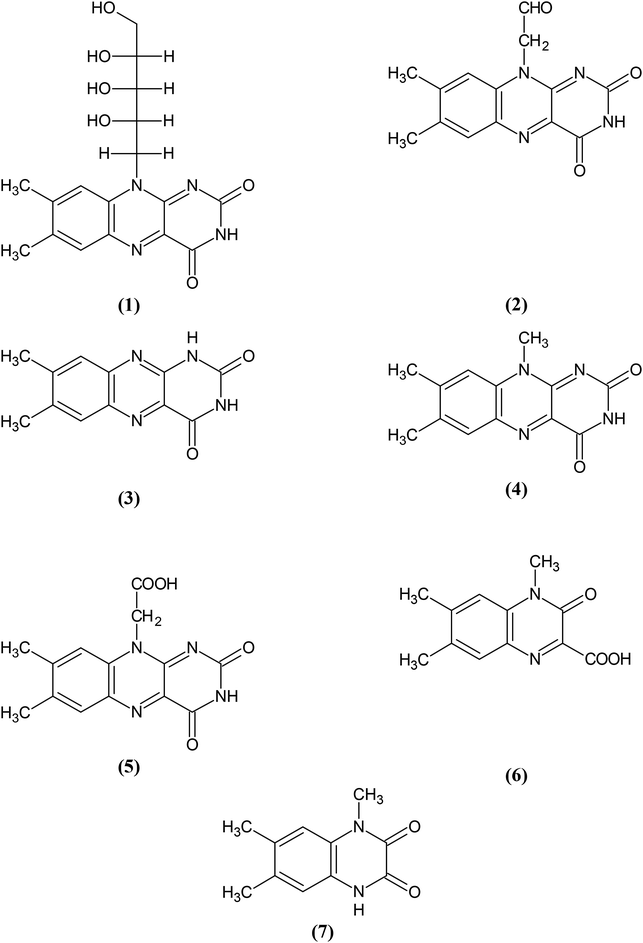
Riboflavin (vitamin B2) RF (1) (Fig. 1) has long been studied due to its biochemical importance, photosensitivity and pharmaceutical applications.1–8 It is photodegraded to several products in aqueous and organic solvents to yield formylmethylflavin (FMF) (2) as a major intermediate in the reaction.9–16 FMF undergoes hydrolysis17–19 and photolysis to form lumichrome (LC) (3) and lumiflavin (LF) (4) in aqueous solution20,21 and LC in organic solvents.20 It is photooxidized to carboxymethylflavin (CMF) (5) in aqueous and organic solvents.12,13,16,21,22 CMF has also been suggested to act as an intermediate in the formation of LC and LF during the photolysis of RF in aqueous solution.23 It is an isoalloxazine derivative like RF, FMF and LF1,24,25 and is susceptible to hydrolytic degradation in alkaline solution by the cleavage of the isoalloxazine ring to give 1,2-dihydro-1-methyl-2-keto-3-quinoxaline carboxylic acid (KA) (6) and 1,2,3,4-tetrahydro-1-methyl-2,3-dioxoquinoxaline (DQ) (7).26–29 So far no chemical or photodegradation studies of CMF have been reported since its isolation by Fukumachi and Sakurai in 1955.22An important consideration in degradation of chemical and pharmaceutical compounds is the effect of solvent on the rates of reaction.30–35 Solvent polarity plays an important role in the stabilization of drug formulations to prolong their shelf-lives.36–40 The effect of solvent on the photolysis of RF,5,16,41–44 FMF,20,21,45 LC45 and other flavins46–48 has been studied. The photo-dynamics aspects of RF have also been investigated.49 The photolysis of CMF in organic solvents needs to be investigated to determine the effect of solvent polarity on its degradation.
The present work involves a detailed kinetic study of photolysis of CMF in aqueous and organic solvents, characterize the photoproducts and evaluate the kinetics of its degradation reactions. The rate–pH profiles could provide information about the regions of minimum and maximum degradation of the compound. Attempts are made to correlate the kinetic parameters with solvent polarity and viscosity. The photochemical and fluorescence quantum yields of CMF in aqueous and organic solvents are determined. CMF and its photoproducts are assayed by a recently developed multicomponent spectrofluorimetric method.29 The mode of photodegradation reactions of CMF is discussed.
Experimental section
Materials
LC and LF were procured from Sigma. CMF was prepared by the method of Fukumachi and Sakurai.22 KA and DQ were prepared from RF by the methods of Surrey and Nachod50 and Miles et al.,51 respectively. The side-chain of KA and DQ was cleaved by periodic acid51 oxidation. The compounds were purified by cellulose column chromatography using 1-butanol–1 propanol–acetic acid–water (50![[thin space (1/6-em)]](https://www.rsc.org/images/entities/char_2009.gif) :
:![[thin space (1/6-em)]](https://www.rsc.org/images/entities/char_2009.gif) 30
30![[thin space (1/6-em)]](https://www.rsc.org/images/entities/char_2009.gif) :
:![[thin space (1/6-em)]](https://www.rsc.org/images/entities/char_2009.gif) 2
2![[thin space (1/6-em)]](https://www.rsc.org/images/entities/char_2009.gif) :
:![[thin space (1/6-em)]](https://www.rsc.org/images/entities/char_2009.gif) 18, v/v) as solvent system.18 All the reagents and solvents of the highest purity were procured from Merck & Co. The buffers used were citric acid–Na2HPO4 (pH 2.5–8.0), H3BO3–KCl–NaOH (pH 9.0–10.0) and Na2HPO4–NaOH (pH 11.0–12.0). The ionic strength was 0.001 M in each case.
18, v/v) as solvent system.18 All the reagents and solvents of the highest purity were procured from Merck & Co. The buffers used were citric acid–Na2HPO4 (pH 2.5–8.0), H3BO3–KCl–NaOH (pH 9.0–10.0) and Na2HPO4–NaOH (pH 11.0–12.0). The ionic strength was 0.001 M in each case.
Precautions
The photolysis of CMF, thin-layer chromatography and fluorimetric assay have been carried out in a dark chamber.Measurement of pH
All pH measurements were carried out with a digital pH meter (Model CP-501; sensitivity ±0.01 units, Poland) using a combination pH electrode. The calibration of the electrode was performed using buffer solutions of pH 4.0, 7.0 and 9.0.Measurement of UV-visible spectra
The spectral measurements were carried out with Thermo-Scientific UV-visible spectrophotometer (Evolution 201) using quartz glass cells of 10 mm path length.Measurement of fluorescence
The measurement of fluorescence of CMF and photoproducts was performed out at 25 ± 1 °C using Jasco FP-8300 spectroflurimeter (Japan). The wavelengths used for the determination of CMF and photoproducts are given in Table 1.| Compound | Excitation wavelength (λex) nm | Emission wavelength (λem) nm |
|---|---|---|
| CMF | 445 | 530 |
| LC | 356 | 478 |
| LF | 445 | 530 |
| KA | 364 | 443 |
| DQ | 332 | 420 |
The fluorescence intensity was measured in relative units. Pure 0.01 mM solutions (pH 6.5) of these compounds were used as standards.
Light intensity measurement
The intensity of the radiation source, a Philips HPLN 125 W high pressure mercury vapor lamp, was determined by ferrioxalate actinometry52 and a value of 1.12 ± 0.08 × 10¹⁷ quanta per s was obtained.Determination of quantum yields of photolysis
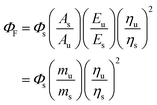
The quantum yields (ΦPD) for the photochemical formation of LC in acid solution and organic solvents by second-order reaction and the photodegradation of CMF in alkaline solution by first-order reaction have been determined by the method of Zirak et al.53,54 and Tyagi and Penzkofer55 as follows.Formation of LC
 | (1) |
 | (2) |
Photodegradation of CMF
 | (3) |
 | (4) |
It can be determined of a comparative method56 using standard samples of a compound whose ΦF is known. The standard and the test samples having identical absorbance at the same excitation wavelength are assumed to absorb same number of photons. Therefore, the ratio of integrated fluorescence intensities of the two solutes determined under identical conditions gives the ratio of values of the quantum yields. Since ΦF of the standard is known, the ΦF of test sample can be calculated.
The method involves the measurement of absorbance and the integrated fluorescence intensity (i.e. area of the fluorescence spectra) of the sample of the standard and the test samples. The integrated fluorescence intensity of the standard and the test samples are plotted against the absorbance of each sample. The gradients of the two plots are proportional to the quantum yields of the two compounds. The fluorescence quantum yield of the unknown is calculated from the product of the quantum yield of the standard and the quotient of the two gradients according to the following equation.
Thin-layer chromatography (TLC)
CMF and its side-chain cleavage products (LC and LF) were detected using 250 μm cellulose plates (Whatman CC41) and the solvent systems: (a) 1-butanol–1-propanol–acetic acid–water (50![[thin space (1/6-em)]](https://www.rsc.org/images/entities/char_2009.gif) :
:![[thin space (1/6-em)]](https://www.rsc.org/images/entities/char_2009.gif) 30
30![[thin space (1/6-em)]](https://www.rsc.org/images/entities/char_2009.gif) :
:![[thin space (1/6-em)]](https://www.rsc.org/images/entities/char_2009.gif) 2
2![[thin space (1/6-em)]](https://www.rsc.org/images/entities/char_2009.gif) :
:![[thin space (1/6-em)]](https://www.rsc.org/images/entities/char_2009.gif) 18, v/v) and (b) 1-butanol–acetic acid–water (40
18, v/v) and (b) 1-butanol–acetic acid–water (40![[thin space (1/6-em)]](https://www.rsc.org/images/entities/char_2009.gif) :
:![[thin space (1/6-em)]](https://www.rsc.org/images/entities/char_2009.gif) 10
10![[thin space (1/6-em)]](https://www.rsc.org/images/entities/char_2009.gif) :
:![[thin space (1/6-em)]](https://www.rsc.org/images/entities/char_2009.gif) 50, v/v, organic phase).12
50, v/v, organic phase).12
The isoalloxazine ring cleavage products of CMF, i.e. KA and DQ, were detected using 250 μm silica gel G plates and the solvent system (c) chloroform–acetic acid–pyridine (50![[thin space (1/6-em)]](https://www.rsc.org/images/entities/char_2009.gif) :
:![[thin space (1/6-em)]](https://www.rsc.org/images/entities/char_2009.gif) 10
10![[thin space (1/6-em)]](https://www.rsc.org/images/entities/char_2009.gif) :
:![[thin space (1/6-em)]](https://www.rsc.org/images/entities/char_2009.gif) 10, v/v).27 The spots of all these products were located by their characteristic fluorescence on excitation at 366 nm.
10, v/v).27 The spots of all these products were located by their characteristic fluorescence on excitation at 366 nm.
Photodegradation of CMF
A CMF solution (5 × 10⁻⁵ M) was prepared at pH 2.0–12.0, using appropriate buffer, in a 100 ml volumetric flask and placed in a thermostat bath maintained at 25 ± 1 °C in the radiation chamber. It was irradiated with the Philips HPLN 125 W high pressure mercury vapor lamp (emission at 405 and 435 nm, the later wavelength corresponding to the absorption maximum of CMF at 445 nm),19,22,29 fixed horizontally at a distance of 25 cm from the center of the flask. The same procedure was used for photolysis of CMF in organic solvents. Samples of degraded solutions were subjected to TLC and assay at appropriate intervals.Assay of CMF and photoproducts
Results and discussion
Absorption characteristics of CMF
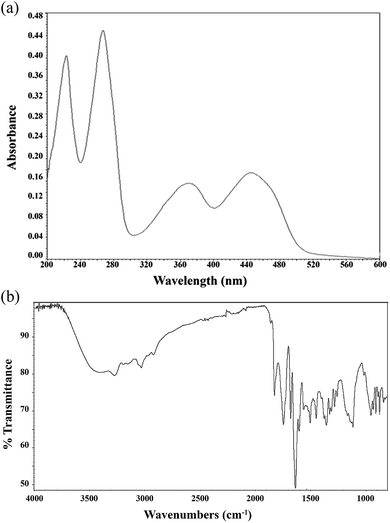
The UV-visible and IR spectra of CMF are shown in Fig. 2a and b, respectively. CMF exhibits absorption maxima at 223 nm (molar decadic extinction coefficient, ε = 24![[thin space (1/6-em)]](https://www.rsc.org/images/entities/char_2009.gif) 700 M−1 cm−1), 266 nm (ε = 27
700 M−1 cm−1), 266 nm (ε = 27![[thin space (1/6-em)]](https://www.rsc.org/images/entities/char_2009.gif) 800 M−1 cm−1), 376 nm (ε = 9000 M−1 cm−1) and 445 nm (ε = 10
800 M−1 cm−1), 376 nm (ε = 9000 M−1 cm−1) and 445 nm (ε = 10![[thin space (1/6-em)]](https://www.rsc.org/images/entities/char_2009.gif) 200 M−1 cm−1) at pH 7.0 (Fig. 2a). These values are similar to those of RF and FMF having the same nucleus and different side-chains.58 The FTIR spectrum of CMF shows peaks at 3250 cm−1 (NH), 1650 cm−1 (C
200 M−1 cm−1) at pH 7.0 (Fig. 2a). These values are similar to those of RF and FMF having the same nucleus and different side-chains.58 The FTIR spectrum of CMF shows peaks at 3250 cm−1 (NH), 1650 cm−1 (C![[double bond, length as m-dash]](https://www.rsc.org/images/entities/char_e001.gif) O), 1580 cm−1 (C
O), 1580 cm−1 (C![[double bond, length as m-dash]](https://www.rsc.org/images/entities/char_e001.gif) C) and 1540 cm−1 (C
C) and 1540 cm−1 (C![[double bond, length as m-dash]](https://www.rsc.org/images/entities/char_e001.gif) N) (Fig. 2b). The broad absorption band in the 3300–2800 cm−1 region indicates hydrogen bonded O–H stretching of the carboxylic group. This is further supported by the peaks at 1700 cm−1 and 1300 cm−1.
N) (Fig. 2b). The broad absorption band in the 3300–2800 cm−1 region indicates hydrogen bonded O–H stretching of the carboxylic group. This is further supported by the peaks at 1700 cm−1 and 1300 cm−1.
Nature of photoproducts
CMF was originally reported as a photoproduct in the photolysis of RF in alkaline solution in the presence of H2O2, along with LC and LF.22,23 It has also been detected in the photolysis of RF12,13,51 and FMF and may be formed directly from RF23 or by the oxidation of FMF.21 LC and LF are formed on the photolysis9,11,20,21 or hydrolysis of FMF17–19 and CMF29 in the alkaline solution.It has been found that the formation of LC and LF takes place on the photolysis of CMF. Thus, a second route of the formation of LC and LF, in addition to that of FMF, in the photolysis of RF is through CMF. The other two products formed by isoalloxazine ring cleavage of CMF in alkaline solution are quinoxaline derivatives, KA and DQ. The formation of both of these products is enhanced with an increase in pH due to the hydrolysis of the isoalloxazine ring,29 as has previously been observed in the case of the hydrolysis of 9-methylisoalloxazine.27,28 The only product detected on the photolysis of CMF in organic solvents is LC. All these products have been identified on comparison of their characteristics fluorescence under UV light (CMF and LF, yellow green; LC, sky blue; KA and DQ, blue) and retention (Rf) values with those of the reference compounds using the solvent systems reported in the experimental section. The identification of photoproducts of CMF was necessary to confirm their presence in degraded solutions prior to the application of the spectrofluorimetric method for their assay during the photolysis reactions.
Product composition
The photolysis of CMF leads to the formation of LC, LF, KA and DQ in aqueous solution as described in the above section. The composition of these products at 50% degradation of CMF at pH 8.0–12.0 is given in Table 2. The formation of LC in acid solution amounts to 50% and in the alkaline solution from 20 to 35% while the formation of LF in alkaline solution takes place to the extent of 8 to 13% of the degraded CMF in the pH range studied. The ring cleavage products, KA and DQ, occur to the extent of 5 to 10% and 2 to 6%, respectively. These results indicate that the formation of these photoproducts is gradually increased with pH due to the hydrolytic degradation of CMF which is accelerated in the presence of light. The decrease in the concentration of LC, with pH, is due to its formation by an acid-catalyzed reaction.17| pH | Time (min) | LC (%) | LF (%) | KA (%) | DQ (%) |
|---|---|---|---|---|---|
| 8 | 75.3 | 34.8 | 8.4 | 4.8 | 2.0 |
| 9 | 36.5 | 30.8 | 10.4 | 6.0 | 3.0 |
| 10 | 30.8 | 26.2 | 11.0 | 7.8 | 4.8 |
| 11 | 28.7 | 23.2 | 12.4 | 9.2 | 6.0 |
| 12 | 27.6 | 20.2 | 13.0 | 10.4 | 6.4 |
Spectral characteristics of photolyzed solutions
CMF has been found to undergo spectral changes during photolysis in acid and alkaline solutions (Fig. 3). These changes have been found to vary with pH and the loss of the molecule on degradation. A typical set of absorption spectra of CMF on degradation at pH 4.0 is presented in Fig. 3a. It indicates the loss of peak at 445 nm and a shift towards 356 nm with concomitant increase in absorbance showing the formation of LC in acid solution. Another set of absorption spectra of CMF during photolysis at pH 11.0 is shown in Fig. 3b. The loss of absorbance at 445 nm indicates the degradation of CMF and a prominent shift of the 374 nm peak towards 356 nm showing the formation of LC. The absorption spectrum of LF is similar to that of CMF and, therefore, it cannot be distinguished from CMF to indicate any spectral change. The disappearance of 445 nm peak indicates the cleavage of the isoalloxazine ring to form KA and DQ absorbing in the 300–400 nm region.27,28,59 Thus, the spectral changes on the photolysis of CMF at pH 11.0 indicate that the molecule is being transformed into its side-chain and ring cleavage products.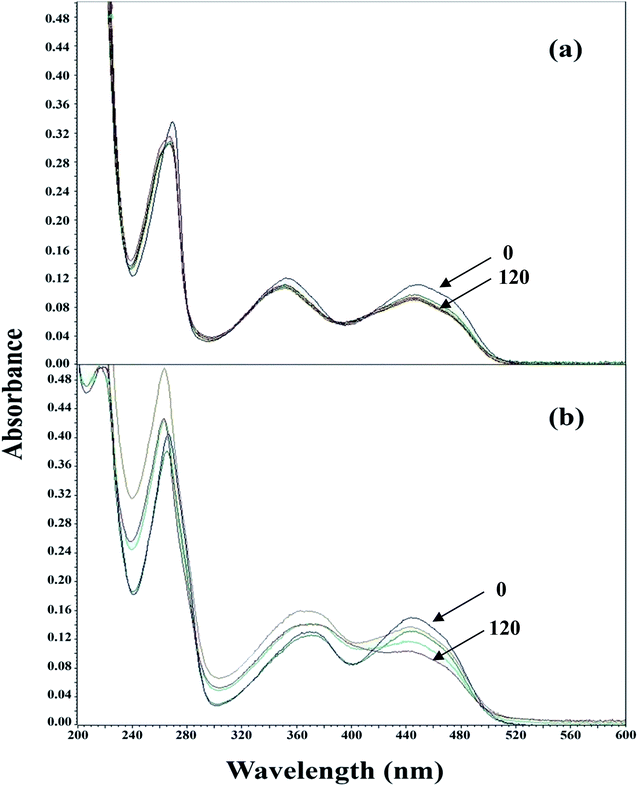 | ||
| Fig. 3 Absorption spectra of CMF on photolysis at pH 4.0 (a), and at pH 11.0 (b). Times indicated are in min. | ||
Assay of CMF and photoproducts
The photoproducts of CMF in acid (LC) and alkaline solution (LC, LF, KA and DQ) are same as those of the hydrolytic degradation reaction. However, the formation of LC and LF is increases in presence of light. Therefore, a single method can be applied to the determination of the products of hydrolytic and photolytic degradation. Recently, a spectrofluorimetric method has been developed and validated for the determination of CMF and its side-chain cleavage (LC and LF) and ring cleavage products (KA and DQ).29 The accuracy of the method has been reported to be within 1%.29 This is used for the determination of CMF and photoproducts during photolysis. The results of the assay of these compounds on the photolysis of CMF for a typical reaction (pH 10) are given in Table 3. These indicate an almost constant molar balance at various intervals showing the accuracy of the method. The assay data for the reactions carried out at pH 2.0–12.0 have been used to evaluate the kinetics of degradation of CMF.| Time (min) | CMF (M × 105) | LC (M × 105) | LF (M × 105) | KA (M × 105) | DQ (M × 105) | Total (M × 105) |
|---|---|---|---|---|---|---|
| 0 | 5.00 | — | — | — | — | 5.00 |
| 15 | 2.38 | 0.91 | 0.85 | 0.46 | 0.42 | 5.03 |
| 30 | 1.22 | 1.31 | 1.15 | 0.85 | 0.51 | 5.05 |
| 45 | 0.59 | 1.43 | 1.28 | 1.10 | 0.56 | 4.98 |
| 60 | 0.31 | 1.52 | 1.39 | 1.18 | 0.62 | 5.02 |
Kinetics of photolysis of CMF
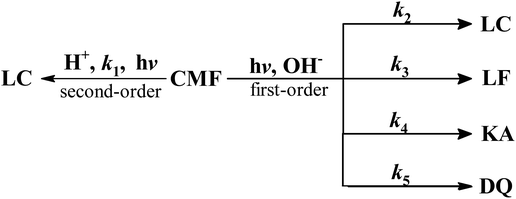
CMF undergoes photolysis to form LC in acid solution and LC, LF, KA and DQ in alkaline solution (Scheme 1).The kinetics of these reactions has not so far been studied. A recent study29 has shown that CMF is degraded by hydrolysis to form the above mentioned compounds in aqueous solution. Considering the photolysis of CMF in acid solution to form LC by a second-order reaction (k1) and to form LC, LF, KA and DQ in alkaline solution by parallel first-order reactions, the rate constants, k2, k3, k4 and k5, can be calculated by the method of Frost and Pearson60 an applied previously to the photolysis of RF.61
Photolysis of CMF in acid solution
 | (5) |
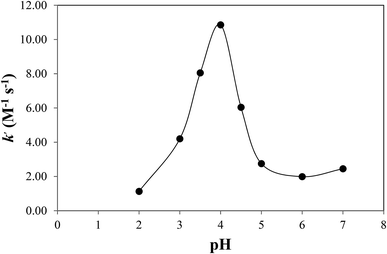
The rate constants, k1, for second-order photolysis reactions of CMF in acid solution determined from slopes of inverse concentration (1/c) against time plots are given in Table 4.
| pH | k1 (M−1 s−1) ± SD | t1/2 (min) | Φa |
|---|---|---|---|
| a It represents the quantum yields for the formation of LC, the major side-chain photoproduct. | |||
| 2.0 | 1.13 ± 0.01 | 295.0 | 0.16 |
| 3.0 | 4.20 ± 0.05 | 79.3 | 0.20 |
| 3.5 | 8.05 ± 0.09 | 41.4 | 0.23 |
| 4.0 | 10.85 ± 0.11 | 30.7 | 0.29 |
| 4.5 | 6.04 ± 0.07 | 55.2 | 0.06 |
| 5.0 | 2.75 ± 0.03 | 121.2 | 0.05 |
| 6.0 | 1.99 ± 0.02 | 167.5 | 0.05 |
| 7.0 | 2.45 ± 0.02 | 136.1 | 0.12 |
Therefore
| kobs = k2 + k3 + k4 + k5 | (6) |
or
A = Ao![[thin space (1/6-em)]](https://www.rsc.org/images/entities/char_2009.gif) e−kt e−kt
| (7) |
Considering the degradation of A as a first-order reaction
or
 | (8) |
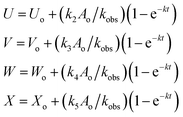
If Uo = Vo = Wo = Xo = 0, the equations can be expressed as
| V/U = k3/k2 |
| W/U = k4/k2 |
| X/U = k5/k2 |
U![[thin space (1/6-em)]](https://www.rsc.org/images/entities/char_2009.gif) : :![[thin space (1/6-em)]](https://www.rsc.org/images/entities/char_2009.gif) V V![[thin space (1/6-em)]](https://www.rsc.org/images/entities/char_2009.gif) : :![[thin space (1/6-em)]](https://www.rsc.org/images/entities/char_2009.gif) W W![[thin space (1/6-em)]](https://www.rsc.org/images/entities/char_2009.gif) : :![[thin space (1/6-em)]](https://www.rsc.org/images/entities/char_2009.gif) X = k2 X = k2![[thin space (1/6-em)]](https://www.rsc.org/images/entities/char_2009.gif) : :![[thin space (1/6-em)]](https://www.rsc.org/images/entities/char_2009.gif) k3 k3![[thin space (1/6-em)]](https://www.rsc.org/images/entities/char_2009.gif) : :![[thin space (1/6-em)]](https://www.rsc.org/images/entities/char_2009.gif) k4 k4![[thin space (1/6-em)]](https://www.rsc.org/images/entities/char_2009.gif) : :![[thin space (1/6-em)]](https://www.rsc.org/images/entities/char_2009.gif) k5 k5
| (9) |
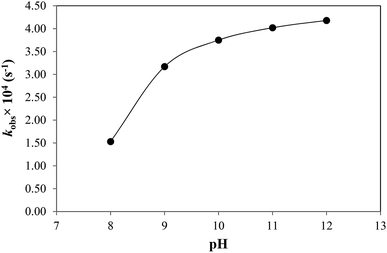
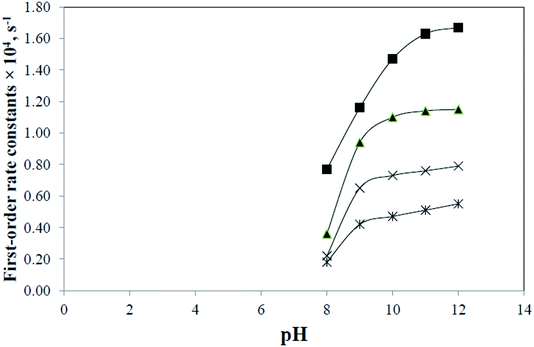
The concentrations of the photoproducts are in a constant ratio to each other. These are independent of time and the initial concentration of CMF and can be used to determine the rate constants for the individual reactions. The values of kobs for disappearance of CMF and k2, k3, k4 and k5 for formation of LC, LF, KA and DQ, respectively, at pH 8–12 are reported in Table 5. These rate constants vary with pH as discussed in a later section. The sum of the individual rate constants for the formation of the photoproducts is almost equal to the values of the kobs for the photolysis of CMF at a particular pH (Table 5).
| pH | kobs × 104 (s−1) ±SD | t1/2 (min) | k2 × 104 (s−1) | k3 × 104 (s−1) | k4 × 104 (s−1) | k5 × 104 (s−1) | k′ (M−1 s−1) | Φa |
|---|---|---|---|---|---|---|---|---|
| a It represents the overall quantum yields for the photolysis of CMF. | ||||||||
| 8 | 1.53 ± 0.06 | 75.3 | 0.76 | 0.36 | 0.23 | 0.18 | 153.0 | 0.32 |
| 9 | 3.07 ± 0.12 | 36.5 | 1.08 | 0.91 | 0.66 | 0.42 | 31.7 | 0.34 |
| 10 | 3.75 ± 0.15 | 30.8 | 1.47 | 1.10 | 0.70 | 0.48 | 3.75 | 0.36 |
| 11 | 4.01 ± 0.14 | 28.7 | 1.63 | 1.13 | 0.75 | 0.50 | 0.40 | 0.39 |
| 12 | 4.15 ± 0.16 | 27.6 | 1.67 | 1.15 | 0.80 | 0.53 | 0.04 | 0.41 |
 | (10) |
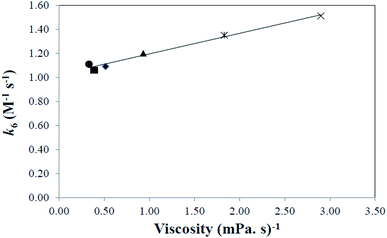
It is similar to that of CMF in acid solution as described above. However, the rates of the reaction are lower than those observed in the acid solution. This is due to a change in the polarity of the medium. The second-order rate constants, k6, for these reactions are reported in Table 6. The values increase on increasing the polarity of solvent.
| Solvent | Acceptor number | Dielectric constant (ε) | Inverse viscosity (mPa s)−1 (25 °C) | k6 (M−1 s−1) |
|---|---|---|---|---|
| Ethyl acetate | 17.1 | 6.02 | 2.268 | 0.98 |
| 1-Butanol | 36.8 | 17.8 | 0.387 | 1.15 |
| 1-Propanol | 37.3 | 20.1 | 0.514 | 1.20 |
| Acetone | 12.5 | 20.7 | 0.330 | 1.23 |
| Ethanol | 37.1 | 24.3 | 0.931 | 1.26 |
| Methanol | 41.3 | 32.6 | 1.828 | 1.42 |
| Acetonitrile | 18.9 | 38.5 | 2.898 | 1.56 |
| Water | 54.8 | 78.5 | 1.123 | 2.45 |
pH effect
CMF is sensitive to pH in the presence or absence of light and undergoes degradation to give LC in acid solution and LC, LF, KA and DQ in alkaline solution. The kinetic results (Table 2) indicate that CMF is more labile to side-chain cleavage than the ring cleavage. The k–pH profiles for photolysis of CMF in acid and alkaline regions have been determined. A plot of k1 for the photolysis of CMF in acid region versus pH is shown in Fig. 4. The rate of the reaction is slow in the pH range 2 to 3 due to protonation of the molecule (N-10) as observed in the case of RF (pKa 1.7)13,62 and is then increased up to pH 4. Above this value a rapid decrease in the rate up to pH 6 is observed. This is similar to that of the photolysis of FMF (pKa 3.5)63 which also have the highest rate around pH 4 in the acid region.21 The decrease in the rate above pH 4 can be explained on the basis of redox potentials of flavins which have lowest values in the pH range of 5 to 6 (e.g. RF −0.117 V at pH 5.0, −0.208 at pH 7.0).39 This would slow down the photoreduction of CMF and lead to a decrease in rate in this region. The values of k1 for the photolysis of CMF in acid solution are in the range of 1.13 to 2.45 M−1 s−1 at pH 2 to 7 (Table 4). Flavins are known to degrade by photoreduction process.4,24,25The k–pH profile for photolysis of CMF in alkaline region is shown in Fig. 5. It represents a steep curve in the pH range 8–10 followed by a decline in rate upto pH 12 as a result of hydrolytic degradation. The lowering of rate above pH 10 appears to be due to the ionization of the N3–H group (pKa 10.2)62 of the isoalloxazine nucleus. This is in accordance with the photolysis behavior of RF which is also less susceptible to degradation in the pH range 10.0–12.0.13 The increase in the rate in alkaline region is probably due to the fact that the flavin triplet state exists in a bent, diradical form which is more sensitive to alkaline hydrolysis.11 At pH 8 and above CMF undergoes isoalloxazine ring cleavage to form KA and DQ and, therefore, the values of kobs are further increased with pH in this region as observed in the case of FMF19 and 9-methylisoalloxazine.27,28 All the products of alkaline photolysis of CMF (LC, LF, KA, DQ) are formed by parallel first-order kinetics and the rates of these reactions are in the range of 0.18–1.67 × 10⁻⁴ s−1 at pH 8.0–12.0 (Table 5). The rate–pH profiles for formation of LC, LF, KA and DQ in the alkaline region are similar to that of the degradation of CMF (Fig. 6). However, the individual rates of formation of these products are lower than that of the overall loss of CMF. The ratio of the rate constants for the formation of side-chain cleavage products, LC and LF (k2 and k3) and those of the formation of ring cleavage products, KA and DQ (k4 and k5) on the photolysis of CMF at pH 12 is 6.8![[thin space (1/6-em)]](https://www.rsc.org/images/entities/char_2009.gif) :
:![[thin space (1/6-em)]](https://www.rsc.org/images/entities/char_2009.gif) 3.2.
3.2.
Hydroxyl ion catalysis
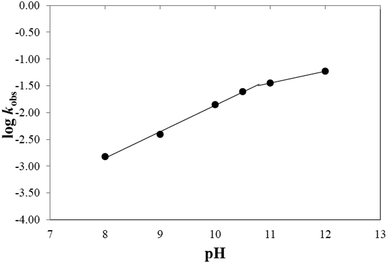
In alkaline solution the photolysis of CMF is catalyzed by OH− ions. In order to evaluate the effect of OH− ions on the rate of photolysis of CMF, the log![[thin space (1/6-em)]](https://www.rsc.org/images/entities/char_2009.gif) kobs values were plotted against pH which showed a biphasic linear relation (Fig. 7). The values of second-order rate constants (k′) for the OH− ion catalyzed reactions at various pH values are reported in Table 5. The slight deviation in rate constants at 10.5 to 12.0 is due to the involvement of the N3-anion of CMF with a pKa value similar to that of RF (10.2)62 and being less sensitive to photolysis.
kobs values were plotted against pH which showed a biphasic linear relation (Fig. 7). The values of second-order rate constants (k′) for the OH− ion catalyzed reactions at various pH values are reported in Table 5. The slight deviation in rate constants at 10.5 to 12.0 is due to the involvement of the N3-anion of CMF with a pKa value similar to that of RF (10.2)62 and being less sensitive to photolysis.
Effect of solvent
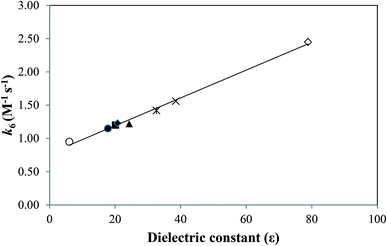 | ||
| Fig. 8 Plot of kobs for photolysis of RF against dielectric constant: (○) ethyl acetate, (●) 1-butanol, (■) 1-propanol, (◆) acetone, (▲) ethanol, (*) methanol, (×) acetonitrile, (◊) water. | ||
The effect of solvent on the rate of a reaction can also be considered in terms of the acceptor number (AN) which determines the ability of a solvent to take shares in electron pairs from suitable donors.64 When the ln![[thin space (1/6-em)]](https://www.rsc.org/images/entities/char_2009.gif) (k6) values for the photolysis of CMF are plotted against the AN of highly structured solvents (i.e. above 25), a linear relation is observed (Fig. 9). The AN is considered as a measure of the reactivity of a species in different solvents.65 The solvent dielectric constant is considered as a good indicator for prediction of the extent of solute–solvent interaction.
(k6) values for the photolysis of CMF are plotted against the AN of highly structured solvents (i.e. above 25), a linear relation is observed (Fig. 9). The AN is considered as a measure of the reactivity of a species in different solvents.65 The solvent dielectric constant is considered as a good indicator for prediction of the extent of solute–solvent interaction.
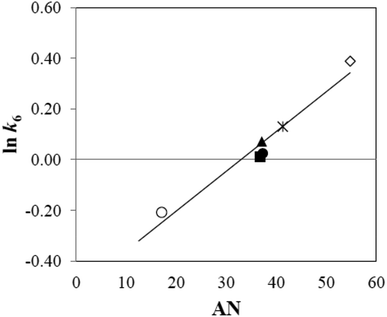 | ||
Fig. 9 Relation between ln![[thin space (1/6-em)]](https://www.rsc.org/images/entities/char_2009.gif) k6 for CMF photodegradation and solvent acceptor number (AN) (symbols are as in Fig. 7). k6 for CMF photodegradation and solvent acceptor number (AN) (symbols are as in Fig. 7). | ||
Effect of fluorescence
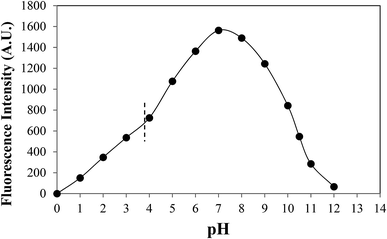
CMF possesses an isoalloxazine nucleus similar to that of other flavins (e.g. RF, FMF and LF) and emits a yellow green fluorescence at 530 nm when excited at 445 nm.19,29 Flavins are dipolar molecules and their fluorescence is destroyed by acid or alkali as a result of the cation or anion formation.66 To observe the effect of pH on the ionization behavior of the molecule, the fluorescence intensity of CMF was plotted against pH (Fig. 11). The curve indicates a slow increase in fluorescence intensity, with pH, in acid region due to gradual deprotonation of CMF. The maximum fluorescence is exhibited in the pH range 7 to 8 followed by a decline due to anion formation of the molecule in alkaline region. The ionized forms of flavins are less susceptible to photolysis in aqueous solution.13 The fluorescence of CMF has also been measured in organic solvents and the relative values of fluorescence intensity and quantum yields (0.09–0.27) of CMF in aqueous and organic solvents are given in Table 7. The deactivation of the excited singlet state (S1) is enhanced with an increase in the polarity of the solvent and hence an increase in k6 values with a loss in fluorescence intensity of CMF in the medium has been observed.| Solvent | % F | ΦF |
|---|---|---|
| Water (pH 7.0) | 48.5 | 0.13 |
| Acetonitrile | 68.6 | 0.18 |
| Methanol | 87.2 | 0.23 |
| Ethanol | 100.0 | 0.27 |
| 1-Propanol | 79.8 | 0.21 |
| 1-Butanol | 36.1 | 0.10 |
| Acetone | 76.3 | 0.20 |
| Ethyl acetate | 33.7 | 0.09 |
The quantum yield of fluorescence (ΦF) of flavins depends on the solvent and is decreased with an increase in the polarity of the solvent.41 This is evident from the values of ΦF and indicates a higher photostability of flavins in less polar solvents.67 The fluorescence quantum yields may be affected by the degree of hydrogen bonding between the flavin and the solvent.68
Dissociation constants of CMF
CMF tends to ionize in acid and alkaline medium due to protonation (N10+H) and anion formation (N10CH2COO− and N3−) of the molecule. The pKa values of these groups have not been reported. Since CMF possesses the nucleus same as that present in RF, the pKas of N10+H and N3− group would be similar to those of RF (1.7 and 10.2, respectively).62 However, since the fluorescence of flavins is quenched by acid and alkali66 due to ionization, the pKa of the N10CH2COOH group in the side-chain can be determined from the plot of fluorescence intensity versus pH (Fig. 11) according to the Henderson–Hasselbalch equation:
 | (11) |
Considering the fluorescence intensity–pH curve, there appears to be an inflection point around pH 4.1 (with a fluorescence intensity corresponding to 50% ionization of the molecule). Therefore, a value of 4.1 can be considered as the pKa of the N10CH2COOH group of CMF. N-heterocyclic carboxylic acids have pKas in the range of 2.9 to 4.4.69,70 Fluorimetry has been used for the determination of the pKa values of N-heterocyclic bases such as 8-methylquinoline and acridine.71
Quantum yields of photolysis
The quantum yields (Φ) of the photolysis of CMF at pH 2.0–12.0 have been determined and are given in Tables 3 and 4. The values of Φ in this pH range vary from 0.05 to 0.41 and are affected by the pH and reactivity of the excited triplet state of CMF. In the acid and neutral range (2.0–7.0), the Φ of formation of LC are low. In alkaline range (8.0–12.0), the Φ gradually increases since the triplet state has high reactivity in alkaline solution.11 These values show a slight decrease in the pH range 10–12 due to anion formation of the molecule which has low susceptibility to photolysis like those of RF13 and FMF.21 The values of Φ of CMF are higher than those of RF photolysis in presence of divalent anions.72Mode of photolysis
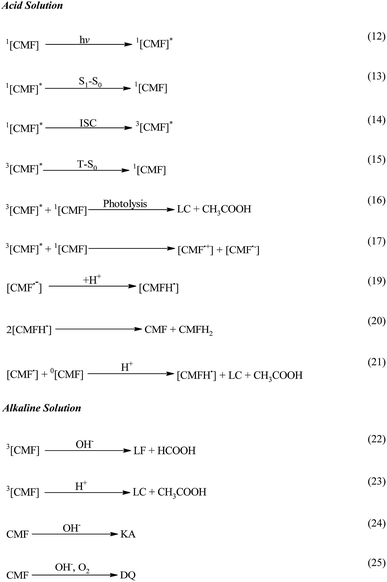
CMF undergoes photolysis to form LC in acid solution. The kinetic data indicate that the transformation of CMF to LC takes place by a second-order reaction. This is in accordance with the photolysis of FMF which also yields LC in acid solution.21 The formation of LC and LF in alkaline solution has been found to take place by parallel first-order reactions as observed in the case of FMF.17–19,21 Therefore, an analogous scheme for the photolysis of CMF is proposed (Scheme 2).In acid solution CMF is promoted to the excited singlet state, 1[CMF]*, by the absorption of a photon of light (eqn (12)) which may be deactivated to the ground state, 1[CMF] (eqn (13)), or is converted to triplet state, 3[CMF]* (eqn (14)) by intersystem crossing (ISC). 3[CMF]* may return to the ground state (eqn (15)) or on interaction with a ground state molecule is photolyzed to LC and CH3COOH (eqn (16)). Alternatively it may give rise to a cationic [CMF˙+] and an anionic [CMF˙−] radical (eqn (17)), which on losing or accepting a proton form a neutral radical [CMF˙] (eqn (18)) and a semiquinone radical [CMFH˙] (eqn (19)), respectively, as described previously in the case of other flavins.48 Two semiquinone radicals disproportionate73 to give a neutral molecule and a dihydro intermediate product [CMFH2] (eqn (20)) similar to that predicted by Berdicka74 in the photolysis of RF and suggested by Ahmad et al. eqn (21) in the photolysis of FMF. The neutral radical reacts with a neutral molecule and they are degraded to a semiquinone radical, LC and CH3COOH (eqn (22)).
In the alkaline solution the photolysis of CMF takes place by hydrolytic degradation as reported in the case of FMF.17,18,21 An increase in rate at pH 8.0–10.0 could be attributed to configurational changes and greater reactivity of the flavin triplet state to alkaline hydrolysis.11 This leads to the formation of LF and formic acid (eqn (22)) and LC and acetic acid (eqn (23)). CMF is also degraded by hydrolytic cleavage of isoalloxazine ring in alkaline solution to yield KA (eqn (24)) and DQ (eqn (25)).29
Conclusions
CMF is an intermediate product in the photolysis of RF. On visible irradiation the side-chain of CMF is removed to form LC in acid solution and LC and LF in alkaline solution. The isoalloxazine ring of the molecule is also cleaved in alkaline solution to yield quinoxaline derivatives. In organic solvents CMF is photodegraded to LC only. CMF is degraded in acid solution and organic solvents by second-order kinetics and in alkaline solution by simultaneous first-order kinetics. The rate constants for the formation of LC and LF in alkaline solution are higher than those of the quinoxaline derivatives. CMF degradation is increased in alkaline solutions due to the enhanced reactivity of the excited triplet state. The photostability of CMF is greater in organic solvents than in the aqueous solution due to a decrease polarity of the medium. The photoproducts of CMF have been identified chromatographically and determined spectrofluorimetrically in degraded solutions. The quantum yields of fluorescence and photolysis of CMF have been reported. A scheme for photodegradation reactions of CMF in aqueous and organic solvent is presented.Conflicts of interest
There are no conflicts to declare.Acknowledgements
The authors gratefully acknowledge Higher Education Commission of Pakistan for financial support to conduct this study through a grant (Research Project # 20-3968) to Iqbal Ahmad. They Thank Professor Alfons Penzkofer University of Regensburg, Germany and Professor Marek Sikorski, Adam Mickiewicz University of Poznan, Poland for helpful discussions.References
- R. S. Rivlin, in Handbook of Vitamins, ed. J. Zempleni, R. B. Rucker, D. B. McCormick and J. W. Suttie, Taylor & Francis, CRC Press, Boca Raton, FL, 2007, pp. 233–251 Search PubMed.
- V. Massey, Biochem. Soc. Trans., 2000, 28, 283–296 CrossRef CAS PubMed.
- P. F. Heelis, in Chemistry and Biochemistry of Flavoenzymes, ed. F. Muller, CRC Press, Boca Raton, FL, 1991, pp. 171–193 Search PubMed.
- I. Ahmad and F. H. M. Vaid, in Flavins: Photochemistry and Photobiology, ed. E. Silva and A. M. Edwards, The Royal Society of Chemistry, Cambridge, 2006, pp. 13–40 Search PubMed.
- M. A. Sheraz, S. H. Kazi, S. Ahmed, Z. Anwar and I. Ahmad, Beilstein J. Org. Chem., 2014, 10, 1999–2012 CrossRef PubMed.
- Z. Anwar and I. Ahmad, in Advances in Medicine and Biology, ed. L. V. Berhardt, Nova Science Publishers, USA, 2017, pp. 139–180 Search PubMed.
- British Pharmacopoeia, Her Majesty‘s Stationary Office, London, UK, 2016 Search PubMed.
- United States Pharmacopeia 29, United States Pharmacopoeial Convention, Rockville, MD, 2016 Search PubMed.
- E. C. Smith and D. E. Metzler, J. Am. Chem. Soc., 1963, 85, 3285–3288 CrossRef CAS.
- G. E. Treadwell, W. L. Cairns and D. E. Metzler, J. Chromatogr., 1968, 35, 376–388 CrossRef CAS PubMed.
- W. L. Cairns and D. E. Metzler, J. Am. Chem. Soc., 1971, 93, 2772–2777 CrossRef CAS PubMed.
- I. Ahmad and H. D. Rapson, J. Pharm. Biomed. Anal., 1990, 8, 217–223 CrossRef CAS PubMed.
- I. Ahmad, Q. Fasihullah, A. Noor, I. A. Ansari and Q. N. Ali, Int. J. Pharm., 2004, 280, 199–208 CrossRef CAS PubMed.
- I. Ahmad, S. Ahmed, M. A. Sheraz, F. H. M. Vaid and I. A. Ansari, Int. J. Pharm., 2010, 390, 174–182 CrossRef CAS PubMed.
- I. Ahmad, Z. Anwar, K. Iqbal, S. A. Ali, T. Mirza, Ad. Khurshid, Aq. Khurshid and A. Arsalan, AAPS PharmSciTech, 2014, 15, 550–559 CrossRef CAS PubMed.
- I. Ahmad, Z. Anwar, S. Ahmed, M. A. Sheraz, R. Bano and A. Hafeez, AAPS PharmSciTech, 2015, 16, 1122–1128 CrossRef CAS PubMed.
- P. S. Song, E. C. Smith and D. E. Metzler, J. Am. Chem. Soc., 1965, 87, 4181–4184 CrossRef CAS.
- I. Ahmad, H. D. Rapson, P. F. Heelis and G. O. Phillips, J. Org. Chem., 1980, 45, 731–733 CrossRef CAS.
- I. Ahmad, T. Mirza, Z. Anwar, M. A. Ejaz, M. A. Sheraz and S. Ahmed, Spectrochim. Acta, Part A, 2018, 205, 540–550 CrossRef CAS PubMed.
- I. Ahmad, Q. Fasihullah and F. H. M. Vaid, Photochem. Photobiol. Sci., 2006, 5, 680–685 RSC.
- I. Ahmad, T. Mirza, K. Iqbal, S. Ahmed, M. A. Sheraz and F. H. M. Vaid, Aust. J. Chem., 2013, 66, 579–585 CrossRef CAS.
- C. Fukamachi and Y. Sakurai, J. Vitaminol., 1955, 1, 217–220 CrossRef CAS.
- S. Svobodova-Leblova, J. V. Kostir and I. M. Hais, J. Chromatogr., 1964, 14, 451–455 CrossRef.
- P. F. Heelis, Chem. Soc. Rev., 1982, 11, 15–39 RSC.
- P. Hemmerich, Fortschr. Chem. Org. Naturst., 1976, 33, 451–527 CrossRef CAS PubMed.
- I. Ahmad, A. E. Beg and S. M. S. Zoha, Pak. J. Pharm. Sci., 1973, 2, 84–91 Search PubMed.
- D. A. Wadke and D. E. Guttman, J. Pharm. Sci., 1966, 55, 1088–1092 CrossRef CAS.
- D. A. Wadke and D. E. Guttman, J. Pharm. Sci., 1966, 55, 1363–1368 CrossRef CAS.
- T. Mirza, Z. Anwar, M. A. Ejaz, S. Ahmed, M. A. Sheraz and I. Ahmad, Luminescence, 2018, 33, 1314–1325 CrossRef CAS PubMed.
- E. S. Amis and J. F. Hinton, Solvent Effect on Chemical Phenomena, Academic Press, New York, 1973 Search PubMed.
- M. H. Abraham, Pure Appl. Chem., 1985, 57, 1055–1064 CAS.
- C. Reichardt, Solvents and Solvent Effects in Organic Chemistry, VCH Publishers, New York, 1988, pp. 7–64 Search PubMed.
- H. Heitele, Angew. Chem., Int. Ed. Engl., 1993, 32, 359–377 CrossRef.
- E. Buncel, R. A. Stairs and H. Wilson, The Role of the Solvent in Chemical Reactions, Oxford University Press, New York, 2003 Search PubMed.
- N. J. Turro, V. Ramamurthy and J. C. Scaierno, Modern Molecular Photochemistry of Organic Molecules, University Science: Sausalito, 2010, pp. 469–474 Search PubMed.
- K. A. Connors, G. L. Amidon and V. J. Stella, Chemical Stability of Pharmaceuticals A Handbook for the Pharmacist, Wiley, New York, 1986, pp. 38–41 Search PubMed.
- J. T. Carstensen, in Drug Stability Principles and Practices, ed. J. T. Carstensen and C. T. Rhodes, Marcel Dekker, New York, 2000, pp. 58–60, 65–67 Search PubMed.
- S. Yoshioka and V. J. Stella, Stability of Drugs and Dosage Forms, Kluwer Academic/Plenum Publishers, New York, 2000, pp. 102–104 Search PubMed.
- G. K. Jain, F. Jain, F. J. Ahmad, R. K. Khar, L. Lachman, P. Deluca and M. G. Akers, in The Theory and Practice of Industrial Pharmacy, ed. R. K. Kharm, S. P. Vyas, F. J. Ahmad and G. K. Jain, CBS Publishers & Distributors, India, 2009, pp. 1036–1072 Search PubMed.
- P. J. Sinko, in Martin's Physical Pharmacy and Pharmaceutical Sciences, Lippincott Williams & Wilkins, Philadelphia, 2006, pp. 413–416 Search PubMed.
- J. Koziol, Photochem. Photobiol., 1966, 5, 55–62 CrossRef CAS.
- W. E. Kurtin, M. A. Latino and P. S. Song, Photochem. Photobiol., 1967, 6, 247–259 CrossRef CAS PubMed.
- W. M. Moore and R. C. Ireton, Photochem. Photobiol., 1977, 25, 347–356 CrossRef CAS PubMed.
- M. Insinska-Rak, A. Golczak and M. Sikorski, J. Phys. Chem., 2012, 116, 1199–1207 CrossRef CAS PubMed.
- I. Ahmad and Q. Fasihullah, Pak. J. Pharm. Sci., 1991, 4, 21–26 CAS.
- E. Sikorski, D. R. Worrall, J. I. Bourdelande and M. Sikroski, Pol. J. Chem., 2003, 77, 65–73 Search PubMed.
- V. Szezesma and J. Koziol, Physiochemical Properties and Functions, in Flavins and Flavoproteins, ed. W. Ostrowski, Polish Scientific Publishers, Warsaw, 1977, pp. 117–126 Search PubMed.
- I. Ahmad and G. Tollin, Biochemistry, 1981, 20, 5925–5928 CrossRef CAS PubMed.
- P. Zirak, A. Penzkofer, T. Mathes and P. Hegemann, Chem. Phys., 2009, 358, 111–122 CrossRef CAS.
- A. R. Surrey and F. C. Nachod, J. Am. Chem. Soc., 1951, 73, 2336–2338 CrossRef CAS.
- H. T. Miles, P. Z. Smyrniotis and E. R. Stadtman, J. Am. Chem. Soc., 1959, 81, 1945–1951 CrossRef.
- C. G. Hatchard and C. A. Parker, Proc. R. Soc. London, Ser. A, 1956, 235, 518–536 CrossRef CAS.
- P. Zirak, A. Penzkofer, T. Schiereis, P. Hegemann, A. Jung and I. Schlichting, Chem. Phys., 2005, 315, 142–154 CrossRef CAS.
- P. Zirak, A. Penzkofer, P. Hegemann and T. Mathes, Chem. Phys., 2007, 335, 15–27 CrossRef CAS.
- A. Tyagi and A. Penzkofer, J. Photochem. Photobiol., A, 2010, 215, 108–117 CrossRef CAS.
- A. T. R. Williams, S. A. Winfield and J. N. Miller, Analyst, 1983, 108, 1067–1071 RSC.
- G. Weber and F. H. J. Teale, Trans. Faraday Soc., 1957, 55, 646–655 RSC.
- H. H. Fall and H. G. Petering, J. Am. Chem. Soc., 1956, 78, 377–381 CrossRef CAS.
- I. Ahmad, S. Ahmed, M. A. Sheraz and F. H. M. Vaid, J. Photochem. Photobiol., B, 2008, 93, 82–87 CrossRef CAS PubMed.
- A. Frost and R. G. Pearson, Kinetics and Mechanism, John Wiley, New York, 1964, pp. 150–155, 160–162 Search PubMed.
- I. Ahmad, Z. Anwar, S. A. Ali, K. A. Hasan, M. A. Sheraz and S. Ahmed, J. Photochem. Photobiol., B, 2016, 157, 113–119 CrossRef CAS PubMed.
- The Merck Index, ed. M. J. O'Neil, Merck & Co. Inc., Rahway, NJ, USA, 13th edn, 2013 Search PubMed.
- C. H. Suelter and D. E. Metzler, Biochim. Biophys. Acta, 1960, 44, 23–33 CrossRef CAS.
- V. Guttman, The Donor-Acceptor Approach to Molecular Interactions, Plenum Press, New York, 1978 Search PubMed.
- R. Schmidt and V. N. Sapunov, Non-Formal Kinetics, Verlag Chemie, Weinheim, Germany, 1982, pp. 123–154 Search PubMed.
- G. Weber, Biochem. J., 1950, 47, 114–121 CrossRef CAS PubMed.
- J. Koziol, Photochem. Photobiol., 1966, 5, 41–54 CrossRef CAS.
- K. Yagi, N. Ohisi, K. Nishimoto, J. D. Choi and P. S. Song, Biochemistry, 1980, 19, 1553–1557 CrossRef CAS PubMed.
- A. Albert and E. P. Serjeant, Non-Formal Kinetics, John Wiley & Sons Inc., New York, 1962, p. 127 Search PubMed.
- W. F. Gum Jr and M. M. Joullie, J. Org. Chem., 1965, 30, 3982–3985 CrossRef.
- L. S. Rosenberg, J. Simons and S. G. Schulman, Talanta, 1979, 26, 867–871 CrossRef CAS PubMed.
- F. H. M. Vaid, W. Gul, A. Faiyaz, Z. Anwar, M. A. Ejaz, S. Zahid and I. Ahmad, J. Photochem. Photobiol., A, 2019, 371, 59–66 CrossRef CAS.
- I. Ahmad, M. A. Cussanovich and G. Tollin, Proc. Natl. Acad. Sci. U. S. A., 1981, 68, 6724–6728 CrossRef PubMed.
- R. Berdicka, Collect. Czech. Chem. Commun., 1949, 14, 130–144 CrossRef.
Footnote |
| † Electronic supplementary information (ESI) available. See DOI: 10.1039/c9ra02818h |
| This journal is © The Royal Society of Chemistry 2019 |

