 Open Access Article
Performance enhanced electromagnetic wave absorber from controllable modification of natural plant fiber†
Lin Guoa,
Qing-Da An *a,
Zuo-Yi Xiaoa,
Shang-Ru Zhai
 *a,
Li Cuia and
Zhong-Cheng Li
 b
b
aFaculty of Light Industry and Chemical Engineering, Dalian Polytechnic University, Dalian 116034, P. R. China. E-mail: anqingdachem@163.com; zhaisrchem@163.com
bKey Laboratory of Optic-electric Sensing and Analytical Chemistry for Life Science, MOE, College of Chemistry and Molecular Engineering, Qingdao University of Science and Technology, Qingdao 266042, P. R. China
First published on 29th May 2019
Abstract
Short, surface rough carbon rods, which were derived from natural sisal fiber and went through two different modifications, with excellent electromagnetic wave absorption performance, were studied in this work for the first time. The structure–property relationship was clearly established here. It was shown that these green, cheap and easily obtained carbon rods with mass preparation possibility presented eye-catching absorbing behaviors towards electromagnetic wave. Based on the natural structure of sisal fiber, the minimum reflection loss of KOH activated product reached −51.1 dB and the maximum effective absorbing bandwidth achieved 7.88 GHz. The magnetically modified sample presented −48.6 dB of minimum reflection loss and 4.32 GHz of optimal absorbing bandwidth. Its pioneering application in this field not only opens a new road for this traditional textile sisal fiber but also would possibly make a referable contribution to the design and synthesis of superior carbonaceous electromagnetic wave absorption materials based on bioresource.
Introduction
The explosive development of electronic communication devices not only brings great convenience to our life, but also causes electromagnetic wave (EMW) pollution that cannot be neglected.1–3 Additionally, electromagnetic interference (EMI) often causes thorny problems in military and civilian communication.4,5 To change the way, we must look at protecting vulnerable population and eliminate the disadvantages of EMW. Thus, EMW absorption materials are the first choice to solve these troubles.6,7 For years, researchers have been focusing on developing light weight and effective absorber with strong reflection loss and broad absorbing bandwidth.8,9 In the last few years, various carbonaceous materials have always been ideal candidates for EMW absorbing materials due to their controllable structure and properties. Particularly, graphene oxide (GO), carbon nanotubes (CNT), as well as their derivatives, have made great progress as precursors of EMW absorbing materials.10–13 The booming employment of them benefits from the special structure, high electric conductivity, and good compatibility. Unfortunately, along with some unavoidable shortcomings such as expensive starting materials, fussy synthesis methods, harmful by-products, the further development of these materials in practical application has been limited. Thus, developing cheap, easy-obtained starting materials, accompanied with facile preparation and even mass production possibility is of important practical significance.Biomass sources draw more and more attention when fossil energy dried up. Biomass carbon, a green and sustainable substitute of the traditional carbon, has natural advantages such as intrinsic porous structure, artificially tailored decoration and trace inherent metal ions including Na+, K+, Ca2+ and so on.14,15 More importantly, it offers advantages in mass preparation and production. Given this, many researchers, in particular for the EMW absorption investigators, pay attention to the development and application of these advanced sources. Singh and co-workers developed interesting heteroatom-doped carbon derived from chicken feather fibers, the inherent large fraction of heteroatoms and defects play a vital role in the outstanding performance, but the absorbing bandwidth was limited in X band (8.2–12.4 GHz).16 Wang's group prepared ferromagnetic hierarchical carbon nanofiber bundles derived from natural collagen fibers, apart from the complicated procedure, the starting materials were sundry and expensive.17 On this occasion, the exploration of a more sustainable strategy to fabricate easy-obtained, low-cost and high-efficiency microwave absorption materials with broad absorbing band, even feasible mass production, is of practical significance to meet the requirement of ideal EMW absorbers. However, till now, there are limited successful examples accessible.
We pursue the functionalization of materials by various preparation or regulation methods, but at the same time, we tend to ignore the cost of raw materials. Mother nature always gives, inspired by the concept of green chemistry, here, for the first time, we developed a novel EMW absorber which derives from cheap plant sisal fiber, the fabrication process is truly brief and the product obtained by two different modification methods all displayed brilliant performance. To the best of our knowledge, sisal fiber has been used in textile long ago, but almost no related works showing that it has directly applied breakthrough in the field of functional materials. Elammaran and his workmates gave a new investigation of sound absorption on sisal fiber poly composites, in which the voids and roughness of sisal fiber tremendously enhance the absorption coefficient.18 Up to now, sisal fiber has never been used in EMW absorption. As a groundbreaking, we obtained porous carbon rods from sisal fiber in different fabricating process, and then studied the structure–property relationship in EMW absorption. The as-made sample activated by KOH presents outstanding absorbing behavior, of which the minimal reflection loss is −51.1 dB at 9.44 GHz for 2.0 mm thickness and the effective absorbing bandwidth under −10 dB climbs to 7.88 GHz from 10.12 to 18 GHz, corresponding with the thickness of 2.5 mm. For the sample loaded with magnetic Fe3O4 particles, its performance is also impressive. The optimal effective absorbing bandwidth reaches 4.32 GHz and the minimal reflection loss is −48.6 dB at 10 GHz. Based on the eye-catching starting material and splendid performance of obtained product, we consider this work would possibly make a referable contribution to the design and fabrication of high-performance EMW absorption materials, especially open a new horizon of the biomass-derived absorbers.
Experimental section
Raw materials
Commercial natural sisal fiber was purchased from Guangxi Longli Plant Fiber Co. Lt. Hydrochloric acid (HCl), potassium hydroxide (KOH), ferric chloride (FeCl3·6H2O) and alcohol were all provided by Aladdin Industrial Co. Lt. The chemicals used in this work were of analytical grade without any further purification.Preparation of carbon rods
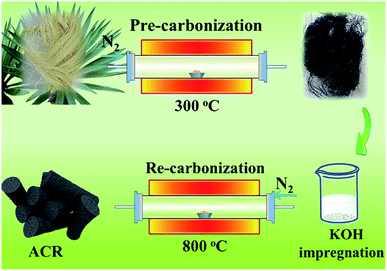
8 g natural sisal fiber was cleaned by distilled water and alcohol, and afterwards dried in oven at 60 °C for 6 h. After that, the fiber was transferred into a tube furnace for pre-carbonization process under N2 atmosphere, during which the heating rate was 5 °C min−1 from room temperature to 300 °C for 2 h. Then, the black hair-like sample was cooled down to room temperature naturally in tube furnace. Next, 3 g pre-carbonized sample was impregnated in 4 mol L−1 KOH solution under magnetic stirring for 6 h and then re-carbonized in tubular furnace after drying. The carbonization condition was 800 °C for 2 h and the heating rate was 5 °C min−1. Finally, after water cleaning, drying and grinding, activated carbon rods were obtained and marked as ACR. The mechanism of KOH activation on carbon matrix can be illustrated as:19| 6KOH + 2C → 2K + 3H2 + 2K2CO3 | (1) |
| K2CO3 → K2O + CO2 | (2) |
| CO2 + C → 2CO | (3) |
| K2CO3 + 2C → 2K + 3CO | (4) |
| K2O + C → 2K + CO | (5) |
The preparation process of magnetic modified samples was similar to that of ACR except the impregnation process using 1% (w/v) FeCl3 solution, and the sample was labeled as FCR. For comparison, the sample only with one step carbonization and no modification was marked as CR. After removal of intrinsic metal ions that coming from raw fiber by acid pickling (pH = 2 HCl solution) for CR, the obtained special sample was named as PCR. PCR would perform a simple comparison with CR in subsequent experiments to verify whether the inherent trace metal ions in sisal fiber might do something on EMW absorption. The main manufacturing process of ACR was illustrated in Scheme 1.
Characterizations
The micro-morphologies of samples were investigated by field-emission scanning electron microscopy (SEM, JEOL JSM-7200F) and transmission electron microcopy (TEM, JEOL JEM-2010), respectively. Phase analysis was performed by powder X-ray diffraction (XRD, Bruker D8 Advance) with Cu-Kα radiation (λ = 1.540 Å) at 40 kV with the angular increasing from 10° to 70°. The specific surface properties of samples were studied by Brunauer–Emmett–Teller (BET, JWGB SCI&TECH JW-BK222) methods via nitrogen adsorption and desorption measurements. Raman microscopy (Renishaw PLC) was employed to obtain the Raman spectra. X-ray photoelectron spectroscopy (XPS, ESCALAB210) analysis was employed to prove the existence of Fe3O4 for FCR. Besides, to test the thermal stability, a thermogravimetric analyzer (TG, NETZSCH 209 F1) was applied, and the temperature ranged from 25 °C to 900 °C at a speed of 10 °C min−1.EMW absorption performances were measured by an Agilent N5224A vector network analyzer at room temperature. The as-made samples mixed by paraffin with a weight loading ratio of 30% were pressed into torus (Φout = 7.0 mm, Φin = 3.04 mm), the complex permittivity and permeability values were measured in the 2–18 GHz frequency range with the coaxial line method.
Results and discussion
Characterization of samples
Fig. 1 shows the SEM images of as-obtained samples CR, ACR and FCR. In visual field, undoubtedly, the major structure of all three samples is rod-like, despite a tiny bit of fragments that splitting away off the rods body after grinding. The three kinds of carbon rods that come from three different treatments all present many wrinkles and bumps on the surface, owing which the surface of rods is rough and looks like a bitter gourd. More importantly, obvious pores emerge in the cross section of CR, ACR and FCR rods. The formation of these pores mainly results from different thermal shrinkage coefficients of the three main components of sisal fiber, that is, the lignin (20–30%), cellulose (35–50%) and hemicellulose cellulose (20–30%).20 According to the SEM images, for associative analysis, a thermogravimetric method was carried out to investigate the thermal stability of natural sisal fiber and the curve was shown in Fig. S1.† Obviously, there are three apparent turning points severally locating at 250, 350 and 700 °C in the curve, suggesting that pyrolysis processes of different compositions in sisal fiber were respectively achieved under different temperature intervals. Notably, after 700 °C, the curve maintains flat, it reveals the end of pyrolysis and completed carbonization for fiber. Therefore, it was after the completed carbonization that the effect of thermal shrinkage in pores formation began showing and this agrees with the observation from SEM.21 The rough surface provided by wrinkles and bumps could increase the interface between carbon rods and air, thereby lead to improved interfacial polarization and more EMW would enter the absorber to be attenuated.22,23 Similarly, the voids came from the micron-scale macropores also offer additional interface, and besides, multi-reflection could happen in these pores.24,25 Hence, the special microstructure of these carbon rods helps to benefit EMW absorption.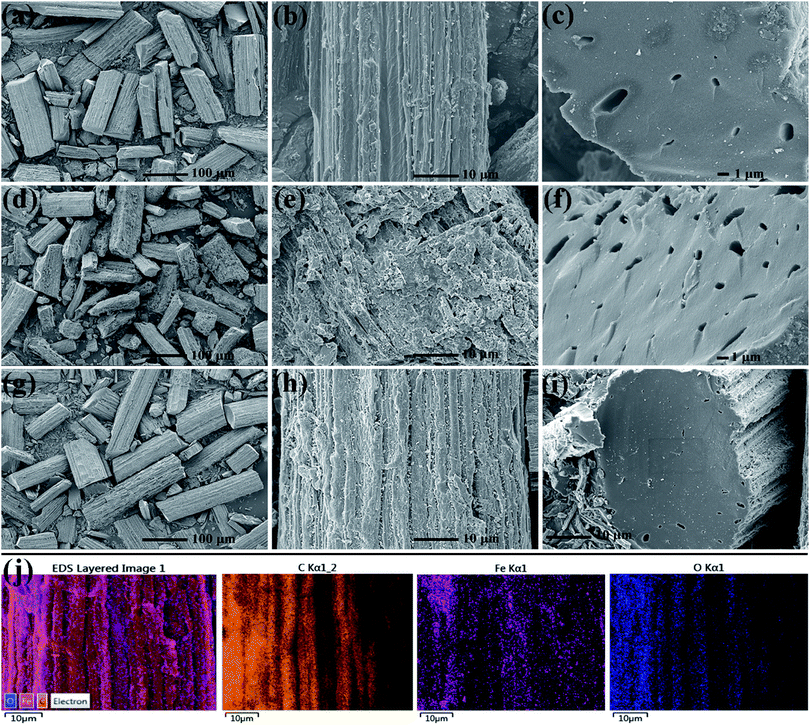 | ||
| Fig. 1 SEM images of samples with different magnifications (CR (a–c), ACR (d–f), FCR (g–i)), elemental mapping of FCR (j). | ||
Further details of micro-morphology and structure are shown in Fig. 2 of representative TEM images. It is noteworthy that many black spots on the rod are exhibited in the projection of Fig. 2a and c for CR and ACR sample, the black spots are considered as inorganic salt crystals derived from the innate trace amount of metal ions like K+, Ca2+, Na+, Fe2+/Fe3+ or any others in natural sisal fiber. In contrast, the PCR TEM image in Fig. S2† is smooth and clean, even almost no black spots are observed, illustrating that the trace inorganic salt ions in PCR were removed after acid pickling. These inherent ions served as doped heteroatoms could play the part of polarization centers and help to attenuate EMW.26 Accordingly, there should be some lifted difference between CR and PCR, and complete details of this case in EMW absorption performance will be provided at below. Compared with CR and ACR, FCR shows dense black spots in Fig. 2e, the spots density of FCR is obviously higher than that of CR and ACR. Most of these black spots are believed to be the generated Fe3O4 particles, and it is confirmed in Fig. 2g. In the high resolution image of Fig. 2g, these lattice fringes coincide well with the (311) plane of Fe3O4, indicating that these particles are Fe3O4 crystals. Magnetic Fe3O4 particles were formed by iron salt impregnation in the subsequent carbonization of FCR. Supplementary saturation magnetization curve of FCR is provided in Fig. S3,† it can be seen that FCR has good paramagnetism. Additionally, the XPS spectra in Fig. S4† were also delivered to describe the Fe element state in FCR. It can be found in Fig. S4b† that the Fe 2p peaks are mainly centered at 707.90 and 721.40 eV, corresponding to Fe 2p1/2 and Fe 2p3/2 state in Fe3O4. Besides, another small satellite peak at 715.20 eV was aroused by Fe 2p3/2 state in trace amount of elemental iron.
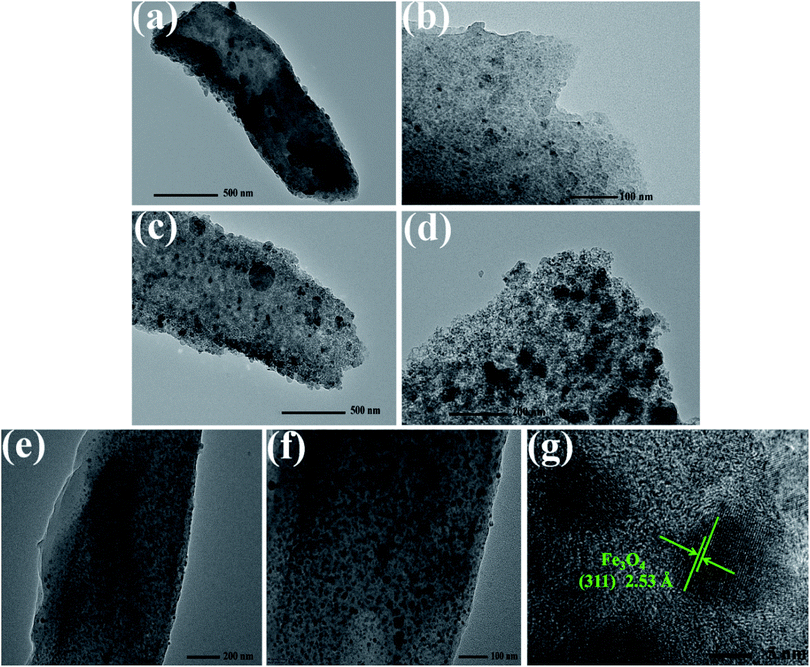 | ||
| Fig. 2 TEM images of samples (CR (a and b), ACR (c and d) and FCR (e and g)) with different magnifications. | ||
Fig. 3 presents the XRD patterns, Raman spectra and N2 adsorption–desorption isotherms of CR, ACR and FCR. In Fig. 3a, ACR and CR characterized two broad peaks that locating at ∼25° and 42°, assigning to the classical (002) and (100) crystal plane of hexagonal graphite (ICSD #85-1436), and no other obvious impurity peaks detected in the patterns. The trace metal elements did not give recognizable diffraction peaks might because of the low content, or weaker diffraction peaks were concealed by the stronger peaks from hexagonal graphite. For FCR, beyond the graphite peaks, the sharp and obvious diffraction peaks correspond well with the standard peaks of face center cubic spinel phase Fe3O4 (ICSD #85-1436), which is consistent with previous TEM analysis.
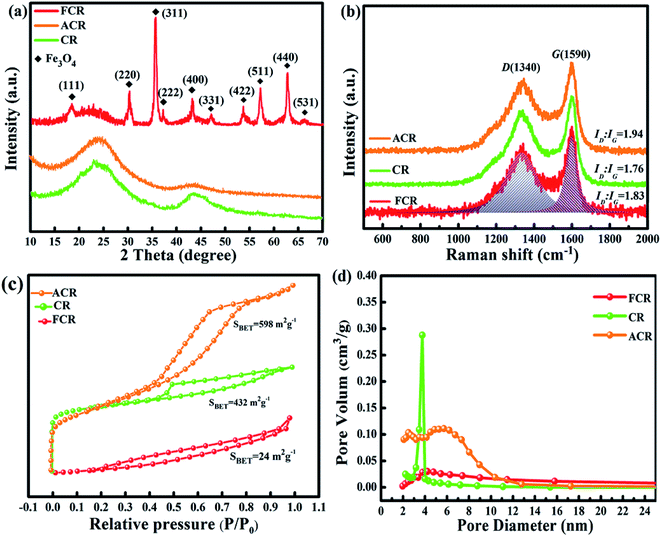 | ||
| Fig. 3 XRD patterns (a), Raman spectra (b), N2 adsorption–desorption isotherms (c) and pore size distribution plots (d) of FCR, ACR and CR. | ||
Moreover, Raman spectra were used to evaluate the graphitization degree of samples. In general, two distinguishable peaks standing at 1340 and 1590 cm−1 are named as D band (A1g carbon vibration modes) and G band (E2g carbon vibration modes).27,28 The D band usually associates with disorder carbon which contains vacancies, substitutional heteroatoms, amorphous carbon species, grain boundaries or any other defects, while the G band is subject to sp2-hybridized carbon bonds, which can be produced by all sp2 sites in graphitic carbon.29–31 The integrated intensity ratio of D band and G band (ID/IG), acquired from an accurate calculation by integral peak area, is usually employed as a criterion to reflect the graphitization degree of sample.32 In Fig. 3b, the as-prepared sample ACR, CR and FCR all present a high ID/IG value that is greater than 1.5, and the corresponding values are 1.94, 1.76, and 1.83, respectively. In contrast to other published works which focus on chemically synthesized carbonaceous materials in this field,33–37 the carbon rods derived from sisal fiber give rare and noticeable high ID/IG value due to low graphitization degree, in other words, plenty of defects exist in the amorphous/disorder carbon. The trace metal ions in sisal fiber, serving as doped heteroatoms, are much likely to cause the lattice distortions of surrounding carbon and facilitate the generation of various defects such as vacancies and misshapen grain boundaries or any others during calcination.14,16 In addition, different carbon sources (lignin, cellulose and hemicellulose cellulose), as well as different micro organizational structures in biomass (cell wall, vascular bundle, conduit, etc.), could also form different interfaces in carbonaceous matrix during pyrolysis, and many defects would generate on these heterogeneous interfaces. In addition to the defects caused by these inherent factors, KOH etching activation or Fe3O4 particles loading further help to improve the defect level of ACR or FCR, respectively. Normally, the formed defects not only introduce defect polarization relaxation and dipole polarization relaxation, but also promote the transition from contiguous state to Fermi level, all of these are in favor of EMW penetration and absorption.38,39
N2 adsorption–desorption isotherms were measured to study the surface area, pore size of samples. Fig. 3c plots the typical type IV isotherms with large hysteresis loops for ACR and CR, which indicates the characteristic of mesoporous materials according to the IUPAC classification.40 By comparison, FCR protrudes downward throughout the pressure range, and presents type III isotherm. Fig. 3d presents pore size distribution plots of three samples. Three obtained samples have little difference in pore diameter, all show the characteristics of micropores. As mentioned in SEM analysis, the carbon rods cross section shows the macropores, but the macropores have little contribution to the specific surface area (SBET) of material, instead, the micropores actually enlarge the SBET. The two-level porous structure could improve interface polarization, then greatly perfect the behavior of EMW absorption.41 Activated by KOH, the SBET of ACR increased by nearly 170 compared with CR, while the SBET of FCR with loaded Fe3O4 particles is very low. It is due to the large number of Fe3O4 particles which greatly increase the unit mass of FCR.
EMM absorption properties of samples
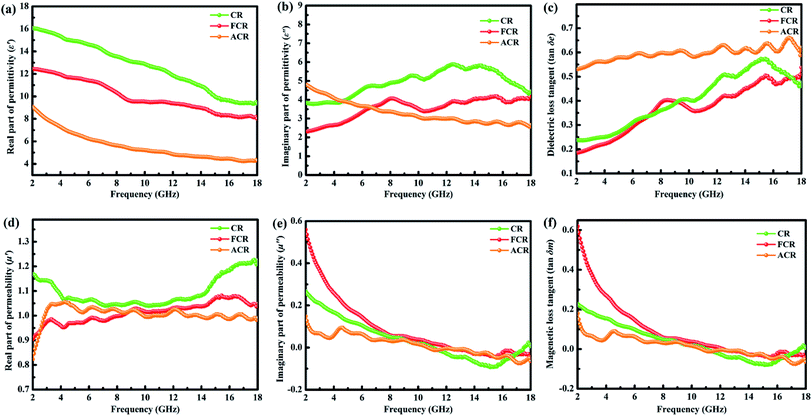
The two decisive parameters, relative complex permittivity (εr = ε′ − jε′′) and relative complex permeability (μr = μ′ − jμ′′) of samples, were measured with the frequency ranging from 2 to 18 GHz to study the EMW absorptivity. Ordinarily, the real parts of the complex permittivity (ε′) and permeability (μ′) represents the storage capability of electric and magnetic energy, while the imaginary parts (ε′′ and μ′′) are on behalf of the dissipation capability of electric and magnetic energy.42,43 The ε′, ε′′, μ′ and μ′′ depending on frequency are depicted in Fig. 4.As can be seen clearly in Fig. 4a and b, intuitive differences exist between three samples, especially the CR, which plots the highest ε′ and ε′′ values over the most tested frequency range. In Fig. 4b of ε′′ versus frequency, all three samples exhibit obvious resonance peaks at high frequencies. The multiple resonance peaks of ε′′ are caused by various polarization relaxations, e.g. interfacial polarization, electronic polarization and atomic polarization (of course, here, interface polarization plays a major role).13,27,32,44 This kind of relaxation is due to the fact that polarization cannot keep up with the rapidly changing of alternate electric field in high frequency region. Usually, the higher the frequency is, the more distinct the relaxation phenomenon is, account for this, resonance relaxation peak occurs in the high frequency region. Those multiple resonances reflected in peaks ascribe to the special microstructure, namely, innate trace metal ions and defects, as well as interfaces between solid–void, air–surface roughness and heterojunctions in carbon rods, all are believed to supply active sites for polarization.34,42 According to Debye theory, polarization relaxation could be considered as one of the key factors to positively contribute to the complex permittivity and then benefit the EMW absorption.4,45 Furthermore, as mentioned in Yin's classical review article, only with appropriate ε′ and ε′′ values can material have EMW absorption, that is, low ε′ and intermediate ε′′ are basic requirements, the author also pointed out the required dielectric properties of EMW absorption materials for application, and the specific values region is also given out: ε′ ranges from 5 to 20, ε′′ ranges from 1 to 10.46 Fortunately, our materials just meet this requirement. The dielectric loss tangents (tan![[thin space (1/6-em)]](https://www.rsc.org/images/entities/char_2009.gif) δe = ε′′/ε′, Fig. 4c) were calculated to evaluate the dielectric loss ability.47 Apparently, ACR gives the highest tangent value upon all frequency. ACR presents higher SBET and ID/IG values, which mean large scale mesopores and defects staying in it. On the one hand, abundant pores could provide enough additional solid–void interfaces, followed by which a considerable amount of interface polarization occurs.48,49 On the other hand, plentiful defects serve as polarization centers to arouse defect dipolar polarization.22,50 These two polarizations would induce dense charges accumulating in the presence of EMW, subsequently, the conductivity improves and the dielectric loss polishes up according to free electron theory.14,51,52
δe = ε′′/ε′, Fig. 4c) were calculated to evaluate the dielectric loss ability.47 Apparently, ACR gives the highest tangent value upon all frequency. ACR presents higher SBET and ID/IG values, which mean large scale mesopores and defects staying in it. On the one hand, abundant pores could provide enough additional solid–void interfaces, followed by which a considerable amount of interface polarization occurs.48,49 On the other hand, plentiful defects serve as polarization centers to arouse defect dipolar polarization.22,50 These two polarizations would induce dense charges accumulating in the presence of EMW, subsequently, the conductivity improves and the dielectric loss polishes up according to free electron theory.14,51,52
For most EMW absorbers, particularly the synthetic composites, ferromagnetic components are often used to modify the materials and improve the magnetic loss.53,54 Here, another modification of our carbon rods is magnetic modification. In Fig. 4d, CR exhibits the highest μ′ value over the whole frequency range, revealing CR has the best electromagnetic energy storage capacity. Whereas in μ′′ plots of Fig. 4e, magnetic FCR is almost the leader of three samples over all tested frequency range, indicating that FCR occupies superior dissipative ability of electromagnetic energy. Besides, all the three samples show negative values at high frequency regio, manifesting that magnetic energy was partially radiated out from the samples.49,55 The magnetic loss tangents (tan![[thin space (1/6-em)]](https://www.rsc.org/images/entities/char_2009.gif) δm = μ′′/μ′, Fig. 4f) display that the magnetic loss of FCR is obviously superior to that of the other two samples by loading magnetic particles.
δm = μ′′/μ′, Fig. 4f) display that the magnetic loss of FCR is obviously superior to that of the other two samples by loading magnetic particles.
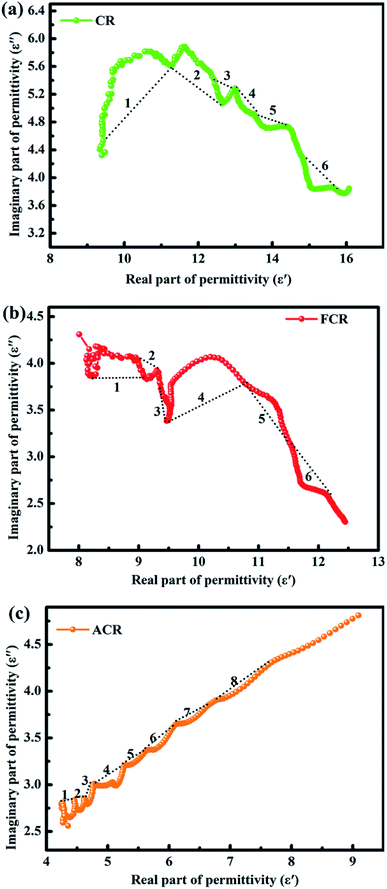
To further understand the significance of dielectric properties in improving material absorbing behaviors, Cole–Cole plots deduced by ε′ vs. ε′′ from Debye polarization relaxation theory were carried out, the equation is shown below:56,57
 | (6) |
The most intuitive date of EMW absorbency is reflection loss (RL), which is calculated from the transmission line theory:60,61
Zin = Z0 (μr/εr)1/2![[thin space (1/6-em)]](https://www.rsc.org/images/entities/char_2009.gif) tanh tanh![[thin space (1/6-em)]](https://www.rsc.org/images/entities/char_2009.gif) [j(2πfd/c)(μrεr)1/2] [j(2πfd/c)(μrεr)1/2]
| (7) |
RL (dB) = 20![[thin space (1/6-em)]](https://www.rsc.org/images/entities/char_2009.gif) log|(Zin − Z0)/(Zin + Z0)| log|(Zin − Z0)/(Zin + Z0)|
| (8) |
 | ||
| Fig. 6 RL curves of CR (a), FCR (b) and ACR (c). The bottom of RL curves is emulation of the peak frequency (fm) vs. absorber thickness (dm) under λ/4 model. | ||
Crucial like frequency, the thickness of absorber play an equally important role to determine the practical application. In addition to the strong absorption from the absorber itself, partial incident EMW can also be attenuated by a “geometric effect”, which is called the quarter wavelength (λ/4) model theory.31,64 From the equation:65
| dm = nλ/4 = nc/[4fm√(|εr||μr|)] (n = 1, 3, 5,…) | (9) |
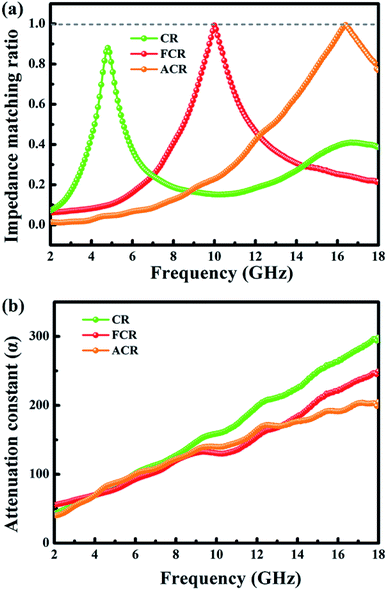
The normalized impendence matching ratio (Z = |Zin/Z0|) and attenuation constant (α) were calculated and provided extra evidences to expound the contrast differences of ultimate EMW absorption ability between three samples. The impendence matching will be better when Z is much closer to 1, under this circumstance, the outside incident EMW enters into absorber as much as possible and then to be further attenuated.67 Fig. 7a renders the optimal impendence matching ratio with frequency variation for three samples. ACR and FCR show expected Z value of 1. However, the Z value of CR is lower than 1, suggesting that a considerable number of incident EMW is reflected back from the surface of absorber, instead of entering into the absorber interior. Therefore, the absorption of EMW by CR is not as good as the other two.
Attenuation constant (α) was introduced to quantificate the ability of absorber attenuating interior EMW, the value of α can be calculated by means of the following equation:30,45
| α = (√2πf/c) × √[(μ′′ε′′ − μ′ε′) + √[(μ′′ε′′ − μ′ε′)2 + (μ′′ε′′ + μ′ ε′)2]] | (10) |
In Fig. 7b, the relying of attenuation constant α on frequency presents that CR exhibits the highest α value in most frequency region, while ACR and FCR are slightly inferior. Nevertheless, because the impedance matching of CR is the lowest, that is, the amount of EMW that can enter its interior is the least, thus the overall absorption effect of CR to EMW is not satisfied. Impedance matching is a prerequisite for EMW absorbing materials, and it determines whether the external EMW can enter the absorber rather than being reflected back.
Related comparative works derived from biomass have been listed out in Table 1. Biomass-derived materials which stem from sisal fiber (this work), chicken feather, spinach stem or any others perform excellent EMW absorbing behaviors, and in a comprehensive way, our carbon rods bear favourable technical comparison by strong RL and broad MAB. Furthermore, the two modification methods for materials here are commonly used and easy to carry out, and help to achieved ideal results. To sum up, all the carbonaceous absorbers listed in Table 1 could be used as a referable paradigmatic for making full use of biomass materials in this fascinating field, and with integrative consideration, it is reasonable for these carbon rods to be talent showing itself between them because of the ubiquitous material and high efficiency.
| Absorber | Raw materials | Content (wt%) | RLmin (dB) | Thickness (mm) | MAB (GHz) | Ref. |
|---|---|---|---|---|---|---|
| Activated carbon rods | Sisal fiber | 30 | −51.1 | 2.0 | 7.88 | Herein |
| Magnetic carbon rods | Sisal fiber | 30 | −48.6 | 2.5 | 4.32 | Herein |
| Porous carbon | Spinach stem | 30 | −41.2 | 1.5 | 4.60 | 14 |
| Heteroatom-doped carbon | Chicken feather | 30 | −20.1 | 2.0 | 2.90 | 16 |
| Porous magnetic carbon | Rice | 15 | −52 | 1.7 | 5.0 | 15 |
| Porous carbon | Walnut shell | — | −42.4 | 2.0 | 2.24 | 50 |
| Ferromagnetic carbon nanofiber | Collagen fiber | 38.1 | −36 | 2.0 | 5.40 | 17 |
| Ni(OH)2/carbon | Jackfruit peel | 50 | −23.6 | 6.0 | — | 68 |
| Carbon–cotton/Co@nanoporous carbon | Cotton | 25 | −60 | 2.55 | 4.40 | 69 |
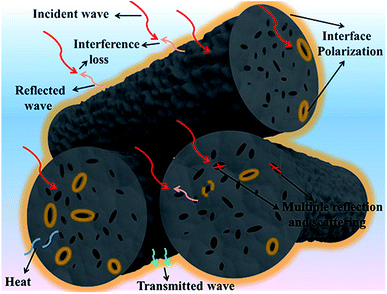
Given the abovementioned investigation and analysis, it can be rationally concluded that the optimal EMW absorbency of these representative porous carbon rods mainly originate from the beneficial structure and proper dielectric loss or magnetic loss. For one thing, numerous co-existing macropores attenuate EMW to a large extent by multiple reflection and scattering, for another, the hetero-interfaces, such as rough surface–air, void–air, carbon matrix–air, carbon matrix–trace metal and so on, greatly promote interfacial polarization and relaxation, followed by which the forceful dielectric loss emerges and consumes EMW. Specially, the magnetic loss aroused by loading magnetic Fe3O4 consumes EMW for FCR in another way. Aside from these, interference loss also makes contribution to the cancellation of incident wave. Probable schematic illustration for EMW absorption of representative ACR appears in Scheme 2.
Conclusion
We have shown for the first time the carbon rods derived from plant sisal fiber with eye-catching performance in electromagnetic wave absorption. The starting material is ubiquitous, environmentally friendly, and low-cost. Based on bio-inspired microstructure, the sisal fiber-derived product modified by KOH etching or magnetic particles loading performed excellent EMW absorbing properties, both the final reflection loss and the absorption bandwidth are satisfactory. Compared with other works which consume costly materials and complex fabrication process, our approach of the EMW absorber shows interesting and unique advantages, and conforms to current green and sustainable research trend. As thereby, it can be firmly believed that these carbon rods could be an admirable candidate in EMW absorbing, and even could also provide a feasible reference for others who want to do similar works.Conflicts of interest
The authors declare that they have no conflicts of interest.Acknowledgements
This project was financially supported by the National Key R&D Program of China (2017YFB0308701), the National Natural Science Foundation of China (21676039), State Key Laboratory of Bio-Fibers and Eco-Textiles (2017kfkt12) and Innovative Talents in Liaoning Universities and Colleges (LR2017045) are highly appreciated.References
- B. Zhao, X. Q. Guo, W. Y. Zhao, J. S. Deng, B. Fan, G. Shao, Z. Y. Bai and R. Zhang, Nano Res., 2016, 10, 331–343 CrossRef.
- C. Luo, T. Jiao, Y. Tang and J. Kong, Adv. Eng. Mater., 2018, 20, 1701168 CrossRef.
- C. Luo, T. Jiao, J. Gu, Y. Tang and J. Kong, ACS Appl. Mater. Interfaces, 2018, 10, 39307–39318 CrossRef CAS PubMed.
- M. Lu, W. Cao, H. Shi, X. Fang, J. Yang, Z. Hou, H. Jin, W. Wang, J. Yuan and M. Cao, J. Mater. Chem. A, 2014, 2, 10540–10547 RSC.
- C. Luo, Y. Tang, T. Jiao and J. Kong, ACS Appl. Mater. Interfaces, 2018, 10, 28051–28061 CrossRef CAS PubMed.
- B. Zhao, X. Zhang, J. Deng, Z. Bai, L. Liang, Y. Li and R. Zhang, Phys. Chem. Chem. Phys., 2018, 20, 28623–28633 RSC.
- B. Zhao, G. Shao, B. Fan, W. Zhao and R. Zhang, Phys. Chem. Chem. Phys., 2015, 17, 2531–2539 RSC.
- Z. Wang, P. Zhao, D. He, Y. Cheng, L. Liao, S. Li, Y. Luo, Z. Peng and P. Li, Phys. Chem. Chem. Phys., 2018, 20, 14155–14165 RSC.
- G. Datt, C. Kotabage, S. Datar and A. C. Abhyankar, Phys. Chem. Chem. Phys., 2018, 20, 26431–26442 RSC.
- Y. Wang, Y. C. Du, R. Qiang, C. H. Tian, P. Xu and X. J. Han, Adv. Mater. Interfaces, 2016, 3, 1500684 CrossRef.
- F. Wu, A. M. Xie, M. X. Sun, Y. Wang and M. Y. Wang, J. Mater. Chem. A, 2015, 3, 14358–14369 RSC.
- R. W. Shu, G. Y. Zhang, X. Wang, X. Gao, M. Wang, Y. Gan, J. J. Shi and J. He, Chem. Eng. J., 2018, 337, 242–255 CrossRef CAS.
- N. Zhou, Q. D. An, Z. Y. Xiao, S. R. Zhai and Z. Shi, RSC Adv., 2017, 7, 45156–45169 RSC.
- Z. C. Wu, K. Tian, T. Huang, W. Hu, F. F. Xie, J. J. Wang, M. X. Su and L. Li, ACS Appl. Mater. Interfaces, 2018, 10, 11108–11115 CrossRef CAS PubMed.
- H. Q. Zhao, Y. Cheng, H. L. Lv, G. B. Ji and Y. W. Du, Carbon, 2019, 142, 245–253 CrossRef CAS.
- S. K. Singh, H. Prakash, M. J. Akhtar and K. K. Kar, ACS Sustainable Chem. Eng., 2018, 6, 5381–5393 CrossRef CAS.
- X. L. Wang, X. Huang, Z. R. Chen, X. P. Liao, C. Liu and B. Shi, J. Mater. Chem. C, 2015, 3, 10146–10153 RSC.
- E. Jayamani, S. Hamdan, M. R. Rahman, M. K. B. Bakri and A. Kakar, J. Appl. Polym. Sci., 2015, 132, 42470 CrossRef.
- H. Q. Zhao, Y. Cheng, W. Liu, L. J. Yang, B. S. Zhang, L. P. Wang, G. B. Ji and Z. J. Xu, Nano-Micro Lett., 2019, 11, 24 CrossRef.
- X. J. Wu, X. T. Fan, S. J. Xie, J. C. Lin, J. Cheng, Q. H. Zhang, L. Y. Chen and Y. Wang, Nat. Catal., 2018, 1, 772–780 CrossRef.
- Y. H. Zou, X. F. Yang, C. Lv, T. C. Liu, Y. Z. Xia, L. Shang, G. I. Waterhouse, D. J. Yang and T. R. Zhang, Adv. Sci., 2017, 4, 1600262 CrossRef PubMed.
- Z. C. Wu, W. Hu, T. Huang, P. Lan, K. Tian, F. F. Xie and L. Li, J. Mater. Chem. C, 2018, 6, 8839–8845 RSC.
- K. Wang, Y. Chen, R. Tian, H. Li, Y. Zhou, H. Duan and H. Liu, ACS Appl. Mater. Interfaces, 2018, 10, 11333–11342 CrossRef CAS PubMed.
- S. Y. Wang, X. Ke, S. T. Zhong, Y. R. Lai, D. L. Qian, Y. P. Wang, Q. H. Wang and W. Jiang, RSC Adv., 2017, 7, 46436–46444 RSC.
- B. Quan, X. H. Liang, G. B. Ji, Y. N. Zhang, G. Y. Xu and Y. W. Du, ACS Appl. Mater. Interfaces, 2017, 9, 38814–38823 CrossRef CAS PubMed.
- J. Feng, Y. Zong, Y. Sun, Y. Zhang, X. Yang, G. Long, Y. Wang, X. H. Li and X. L. Zheng, Chem. Eng. J., 2018, 345, 441–451 CrossRef CAS.
- F. Y. Wang, Y. Q. Sun, D. R. Li, B. Zhong, Z. G. Wu, S. Y. Zuo, D. Yan, R. F. Zhuo, J. J. Feng and P. X. Yan, Carbon, 2018, 134, 264–273 CrossRef CAS.
- Y. Jiang, Y. Chen, Y. J. Liu and G. X. Sui, Chem. Eng. J., 2018, 337, 522–531 CrossRef CAS.
- D. Li, B. Zhang, W. Liu, X. Liang and G. Ji, Dalton Trans., 2017, 46, 14926–14933 RSC.
- P. Wang, L. Cheng, Y. Zhang and L. Zhang, ACS Appl. Mater. Interfaces, 2017, 9, 28844–28858 CrossRef CAS PubMed.
- Y. L. Zhou, J. Muhammad, X. F. Zhang, D. X. Wang, Y. P. Duan, X. L. Dong and Z. D. Zhang, RSC Adv., 2018, 8, 6397–6405 RSC.
- R. Qiang, Y. Du, H. Zhao, Y. Wang, C. Tian, Z. Li, X. Han and P. Xu, J. Mater. Chem. A, 2015, 3, 13426–13434 RSC.
- D. Ding, Y. Wang, X. Li, R. Qiang, P. Xu, W. Chu, X. Han and Y. Du, Carbon, 2017, 111, 722–732 CrossRef CAS.
- S. Dai, Y. Cheng, B. Quan, X. Liang, W. Liu, Z. Yang, G. Ji and Y. Du, Nanoscale, 2018, 10, 6945–6953 RSC.
- W. Chu, Y. Wang, Y. Du, R. Qiang, C. Tian and X. Han, J. Mater. Sci., 2017, 52, 13636–13649 CrossRef CAS.
- J. Li, L. Wang, D. Zhang, Y. Qu, G. M. Wang, G. Tian, A. H. Liu, H. J. Yue and S. H. Feng, Mater. Chem. Front., 2017, 1, 1786–1794 RSC.
- G. Li, L. Wang, W. Li and Y. Xu, Microporous Mesoporous Mater., 2015, 211, 97–104 CrossRef CAS.
- Y. Du, T. Liu, B. Yu, H. Gao, P. Xu, J. Wang, X. Wang and X. Han, Mater. Chem. Phys., 2012, 135, 884–891 CrossRef CAS.
- L. Wang, X. Jia, Y. Li, F. Yang, L. Zhang, L. Liu, X. Ren and H. Yang, J. Mater. Chem. A, 2014, 2, 14940–14946 RSC.
- H. L. Xu, X. W. Yin, M. Zhu, M. K. Han, Z. X. Hou, X. L. Li, L. T. Zhang and L. F. Cheng, ACS Appl. Mater. Interfaces, 2017, 9, 6332–6341 CrossRef CAS PubMed.
- W. Feng, Y. M. Wang, J. C. Chen, B. Q. Li, L. X. Guo, J. H. Ouyang, D. C. Jia and Y. Zhou, J. Mater. Chem. C, 2018, 6, 10–18 RSC.
- H. B. Zhao, Z. B. Fu, H. B. Chen, M. L. Zhong and C. Y. Wang, ACS Appl. Mater. Interfaces, 2016, 8, 1468–1477 CrossRef CAS PubMed.
- B. Zhao, X. Q. Guo, W. Y. Zhao, J. S. Deng, G. Shao, B. B. Fan, Z. Y. Bai and R. Zhang, ACS Appl. Mater. Interfaces, 2016, 8, 28917–28925 CrossRef CAS PubMed.
- B. Quan, X. H. Liang, G. B. Ji, Y. Cheng, W. Liu, J. N. Ma, Y. N. Zhang, D. R. Li and G. Y. Xu, J. Alloys Compd., 2017, 728, 1065–1075 CrossRef CAS.
- N. Zhou, Q. D. An, Z. Y. Xiao, S. R. Zhai and Z. Shi, ACS Sustainable Chem. Eng., 2017, 5, 5394–5407 CrossRef CAS.
- J. L. Lv, S. R. Zhai, C. Gao, N. Zhou, Q. D. An and B. Zhai, Chem. Eng. J., 2016, 289, 261–269 CrossRef CAS.
- C. Luo, W. Duan, X. Yin and J. Kong, J. Phys. Chem. C, 2016, 120, 18721–18732 CrossRef CAS.
- M. M. Lu, M. S. Cao, Y. H. Chen, W. Q. Cao, J. Liu, H. L. Shi, D. Q. Zhang, W. Z. Wang and J. Yuan, ACS Appl. Mater. Interfaces, 2015, 7, 19408–19415 CrossRef CAS PubMed.
- Y. Sun, J. Xu, W. Qiao, X. Xu, W. Zhang, K. Zhang, X. Zhang, X. Chen, W. Zhong and Y. Du, ACS Appl. Mater. Interfaces, 2016, 8, 31878–31886 CrossRef CAS PubMed.
- X. Qiu, L. Wang, H. Zhu, Y. Guan and Q. Zhang, Nanoscale, 2017, 9, 7408–7418 RSC.
- P. Xu, X. J. Han, C. Wang, D. H. Zhou, Z. S. Lv, A. H. Wen, X. H. Wang and B. Zhang, J. Phys. Chem. B, 2008, 112, 10443–10448 CrossRef CAS PubMed.
- Y. Song, L. He, X. Zhang, F. Liu, N. Tian, Y. Tang and J. Kong, J. Phys. Chem. C, 2017, 121, 24774–24785 CrossRef CAS.
- S. S. Gao, Q. D. An, Z. Y. Xiao, S.-R. Zhai and D. J. Yang, ACS Appl. Nano Mater., 2018, 10, 5895–5906 CrossRef.
- N. Zhou, Q. D. An, W. Zheng, Z. Y. Xiao and S. R. Zhai, RSC Adv., 2016, 6, 98128–98140 RSC.
- L. J. Deng and M. G. Han, Appl. Phys. Lett., 2007, 91, 023119 CrossRef.
- F. Yan, J. Y. Kang, S. Zhang, C. Y. Li, C. L. Zhu, X. T. Zhang and Y. J. Chen, Nanoscale, 2018, 10, 18742–18748 RSC.
- S. Y. Wang, S. S. Peng, S. T. Zhong and W. Jiang, J. Mater. Chem. C, 2018, 6, 9465–9474 RSC.
- S. K. Singh, M. J. Akhtar and K. K. Kar, ACS Appl. Mater. Interfaces, 2018, 10, 24816–24828 CrossRef CAS PubMed.
- B. Zhao, G. Shao, B. Fan, W. Zhao, Y. Xie and R. Zhang, J. Mater. Chem. A, 2015, 3, 10345–10352 RSC.
- Q. S. Wu, J. W. Liu, G. S. Wang, S. F. Chen and S. H. Yu, Sci. China Mater., 2016, 59, 609–617 CrossRef CAS.
- S. S. Dai, B. Quan, B. S. Zhang, X. H. Liang and G. B. Ji, Dalton Trans., 2018, 47, 14767–14773 RSC.
- L. Guo, S. S. Gao, Q. D. An, Z. Y. Xiao, S. R. Zhai, D. J. Yang and L. Cui, RSC Adv., 2019, 9, 766–780 RSC.
- A. M. Xie, F. Wu, W. C. Jiang, K. Zhang, M. X. Sun and M. Y. Wang, J. Mater. Chem. C, 2017, 5, 2175–2181 RSC.
- Q. Hu, X. Qi, H. Cai, R. Xie, L. Long, Z. Bai, Y. Jiang, S. Qin, W. Zhong and Y. Du, Sci. Rep., 2017, 7, 1–12 CrossRef PubMed.
- H. M. Zhang, C. L. Zhu, Y. C. Chen and H. Gao, ChemPhysChem, 2014, 15, 2261–2266 CrossRef CAS PubMed.
- L. Liu, Z. D. He, Y. T. Zhao, J. C. Sun and G. X. Tong, J. Alloys Compd., 2018, 765, 1218–1227 CrossRef CAS.
- B. Zhao, W. Zhao, G. Shao, B. Fan and R. Zhang, ACS Appl. Mater. Interfaces, 2015, 7, 12951–12960 CrossRef CAS PubMed.
- H. T. Guan, H. Y. Wang, Y. L. Zhang, C. J. Dong, G. Chen, Y. D. Wang and J. B. Xie, Appl. Surf. Sci., 2018, 447, 261–268 CrossRef CAS.
- H. Q. Zhao, Y. Cheng, J. N. Ma, Y. N. Zhang, G. B. Ji and Y. W. Du, Chem. Eng. J., 2018, 339, 432–441 CrossRef CAS.
Footnote |
| † Electronic supplementary information (ESI) available. See DOI: 10.1039/c9ra02764e |
| This journal is © The Royal Society of Chemistry 2019 |

