 Open Access Article
Few-walled carbon nanotube-enhanced activated carbon supercapacitor performance in organic electrolyte at 4 V
Jie Li and
Zhou Xu *
*
School of Metallurgy and Environment, Central South University, Changsha 410083, China. E-mail: csuxuzhou@163.com
First published on 17th June 2019
Abstract
The effects of few-walled carbon nanotubes (1–2 shell) are studied on an activated carbon-based supercapacitor (soft pack) in organic electrolyte at 4 V. The density of the electrode sheet and the resistance of the device decrease sustainably with the addition of carbon nanotubes of 1–5 wt%. The specific capacitance of the electrode, the energy density and the power density of the device all show typical volcano-type changing trends with the addition of carbon nanotubes, due to the trade-off effect of carbon nanotubes with smaller packing density, excellent electrical conductivity, and smaller surface area. The addition of 1% carbon nanotubes results in the highest values of these three aspects, as well as excellent cycling stability for 10![[thin space (1/6-em)]](https://www.rsc.org/images/entities/char_2009.gif) 000 cycles.
000 cycles.
Carbon material, as the electrode, is the key component of supercapacitors (SCs), providing an interface for the adsorption and desorption of electrolyte ions.1–6 So far, activated carbon (AC) has been predominantly used as the electrode, owing to its high surface area, ease of preparation from various raw materials and low cost.1,3 However, the microporous structure and poor electrical conductivity of AC results in low pore utilization efficiency and poor power density upon charging with high current density.1–5 Therefore, emerging carbon nanomaterials such as carbon nanotubes (CNTs) and graphene have received close attention, owing to their exohedral surface, large surface area, excellent electrical conductivity and high chemical stability.2,4,6 For instance, graphene-based SCs have exhibited the quickest responses so far.7 Ordered arrays of single-walled carbon nanotubes (SWCNTs) exhibited a fast response compared with a randomly packed structure.8 Energy density based on these materials at 2.7–4 V is 90–100 W h kg−1.7–14 As a result, many scientists propose the use of CNTs or graphene to improve the performance of AC-based SCs, and a network of CNTs has indeed been found to increase the conductivity of devices.15–18 On the other hand, these carbon nanomaterials have a far lower packing density compared with AC, which probably causes the serious volume swell for adsorbing liquids.19–22 This drawback influences the processing of electrode sheets of large size, but has been insufficiently studied in coin-type cells.13,14,16–19 In addition, previous work has concentrated on low voltages of 1–2.7 V,13,14,16 relatively lower than the 3–4 V aim for increasing the energy density of SCs. The effect of impurities, for example, release of gases on charging, is insignificant using a coin-type cell, but become very serious in devices of large size. From this point of view, evaluation of a mixed CNT–AC sheet on a soft pack scale at 3–4 V would provide much useful information on understanding the effect of CNTs on the density of the electrode sheet and on the transfer of electrons or diffusion properties of the electrolyte ions with regard to potential commercial use.
In the present work, we report the use of few-walled carbon nanotubes (FWCNTs) to enhance the performance of AC-based SCs (Fig. 1). FWCNTs were chosen because of their excellent electrical conductivity and relatively high surface area contributing to capacitance.
The soft pack contained four sheets of electrode (3 cm × 5 cm, 200 μm thick, mass density of 10–15 mg cm−2) fabricated using a method close to that for industrial requirements. The addition of FWCNTs resulted in a decrease in sheet density and the inner resistance of the SC, which is favourable for an increase in power density. The specific capacitance of the electrode, the power density and the energy density based on the device all exhibited volcano-type curves upon addition of FWCNTs. This revealed a trade-off effect between the excellent conductance and the drawbacks of low surface area and low pack density of FWCNTs in SCs. Addition of 1 wt% FWCNTs was optimal, and effective for achieving overall improved performance in energy density, power density and cycling stability of the device. These results provided significant insight into the effect of FWCNTs and was useful for fabrication of a device with high performance.
Experimental
First, FWCNT powder (OCSiAl, Russia, 890 m2 g−1, 98.7% purity), AC (YP-50, surface area 1464 m2 g−1) and Super P (carbon black) were mixed together in deionized water at 70 °C with stirring at 300 rpm for 4 hours. Then the binders, polymerized styrene butadiene rubber (SBR) and sodium carboxymethyl cellulose (CMC), were mixed together at 50 °C with stirring at 500 rpm for 12 hours. The slurry was transferred and pasted onto Al foil. After rolling and compression, the electrode sheet adhered tightly to the Al foil, and the thickness was controlled to 200 μm after drying at 100 °C for 24 hours. The electrode sheet was cut to a size of 5 cm long and 3 cm wide. Then, the soft pack was set after packing four sheets of electrode and membrane in sequence and sealing into a shell of Al plastic membrane. The soft pack was then dried further at 120 °C in a vacuum of 500 Pa for 24 hours. Then the organic electrolyte (1 M MeEt3NBF4/propene carbonate (PC), with a mass 3.5 times that of the electrode) was fed in under the partial vacuum conditions of a glove box, where the oxygen content was less than 0.5 ppm and water was less than 1 ppm. After adding the electrolyte, the soft pack was sealed and put into a constant-temperature box at 40 °C for 24 hours. Thus, the soft pack was set. The total thickness of the device after compression was effective for minimizing the contact effect and to obtain low resistance for the device.23,24Detection of the soft pack was carried out with an electrochemical work station. Galvanostatic charge and discharge was performed to calculate the capacitance, energy density and power density of the soft pack. Electrochemical impedance spectroscopy (EIS) was also obtained at 20 mV s−1. The cycling stability of the soft pack of pure AC or containing 1 wt% FWCNTs was scanned at 0.5 A g−1 (based on the weight of the electrode materials).
Most of the FWCNTs were very long and formed bundles with a diameter of 10–80 nm (Fig. 2a). Except for some individual tubes with a diameter of 1.2 nm, most tubes in the bundles had a diameter of 2–3.5 nm (Fig. 2c), owing to the strong van der Waals interactions along the axial direction of these small-diameter tubes with a clean surface. To make an electrode sheet containing 1–5 wt% FWCNTs, ultrasonic treatment was used to break the bundles of FWCNTs and to achieve a uniform dispersion of FWCNTs with AC. There are only very few FWCNTs observable in the image for the sample containing 1 wt% FWCNTs (Fig. 3a). Most of these adhere to the surface of the large AC particles. FWCNTs were easily observable when the weight ratio increased to 2 wt% (Fig. 3b) and to 3% (Fig. 3c). These tubes formed a network linking different large particles. On addition of 5 wt% FWCNTs into the AC system, the volume of FWCNTs became very large (Fig. 3d), since FWCNTs with low bulk density had very high volume. No large bundles were found in these images, indicating the uniform mixing of FWCNTs, AC and Super P.
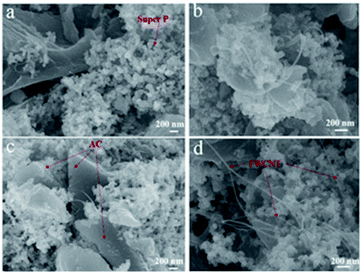 | ||
| Fig. 3 SEM images of mixtures of FWCNTs with AC and Super P. (a) 1 wt% FWCNTs; (b) 2 wt% FWCNTs; (c) 3 wt% FWCNTs; and (d) 5 wt% FWCNTs. | ||
Raman characterization was used to study the dispersion effect (Fig. 4a). Generally, FWCNTs (1–2 shell) had a very intense peak at 100–250 cm−1, assigned to the radial breathing mode (RBM).25–27 A very intense peak at 147.5 nm for pure FWCNTs was detected by the laser of wavelength 633 nm. The intense G band (1591.3 cm−1) and the very weak D band (1320 cm−1) gave a very low intensity ratio (ID/IG) of 0.021. In addition, there is a strong 2D band at 2633 cm−1, confirming the high crystallinity of the FWCNTs. However, on mixing FWCNTs together with AC and Super P, the as-obtained Raman spectra were significantly different. The RBM peak and 2D band disappeared completely in samples with 1–5 wt% FWCNTs, due to strong interaction of the FWCNTs with AC particles. In addition, the intensity of the G band decreased drastically in the presence of AC and Super P in large amounts. Meanwhile, the peak intensity of the D band gradually increased. The ID/IG ratio was 1.13, 0.89, 0.56 and 0.59 for samples containing 1 wt%, 2 wt%, 3 wt% and 5 wt% FWCNTs, respectively. All of these ratios are very large compared with that for pristine FWCNTs (0.024). The data are reasonable since the microporous AC particles and Super P are full of defects and more AC brought more defects into the system.28
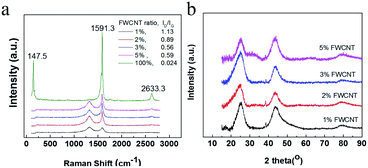 | ||
| Fig. 4 (a) Raman spectra of pure FWCNTs and the mixtures of FWCNTs, AC and Super P. (b) XRD patterns of the mixtures with different ratios of FWCNTs. | ||
XRD characterization indicated a weak peak at a 2Θ value of 23.1–23.3° for samples containing 1–5 wt% FWCNTs (Fig. 4b). The peak position deviated significantly from that at 26.2° for the (002) face of highly oriented pyrolytic graphite. This is due to the polycrystalline AC and Super P. The FWCNT bundle probably had a response at the (002) face, but not the individual tube. This result also validated the effective dispersion of FWCNTs with a mixture of AC and Super P by ultrasonic treatment.
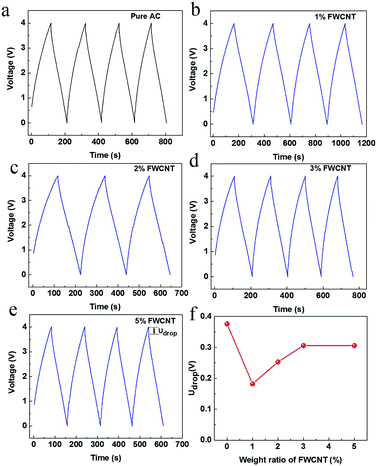
Galvanostatic charge and discharge measurements were made for all soft packs (Fig. 5). The charge and discharge curves are very straight, close to the ideal electrical double layer effect. The discharge time at the third cycle is 93.6, 136.4, 97.7, 87.7 and 71.4 s for soft packs of pure AC, and adding 1 wt%, 2 wt%, 3 wt% and 5 wt% FWCNTs (Fig. 5a–e), respectively. The discharge time directly reflected the releasable energy of the soft pack. Only the soft pack with addition of 1 wt% FWCNTs had obvious advantages over that with pure AC. The addition of more FWCNTs resulted in a low energy based on the device. Since the surface area of FWCNTs is far lower than that of AC, the addition of more FWCNTs decreased the surface area that stored energy. Quantitatively, the addition of 1 wt%, 2 wt%, 3 wt% and 5 wt% FWCNTs to AC gave a mixture with a gross surface area of 1458.3, 1452.5, 1446.8 and 1435.5 m2 g−1, respectively. On the other hand, the thickness of the sheet (200 μm) resulted in the relatively larger Udrop value charged to 4 V for soft pack with pure AC (Fig. 5f). Addition of FWCNTs is effective in reducing the Udrop value. Quantitatively, the value decreased by 54% on adding 1 wt% FWCNTs. Further addition of FWCNTs, however, decreased this value by only 30–35%.
The sheet density of the pure AC electrode can easily be up to 15 mg cm−2 (Fig. 6a), since AC particles are relatively large and compact. In contrast, it is very difficult to control the sheet density higher than 12 mg cm−2 following addition of FWCNTs. With increasing FWCNTs, the sheet density decreased gradually to 4.8 mg cm−2 at 5 wt% FWCNTs. Apparently, long and flexible FWCNTs had a large volume and small packing density, resulting in difficulty in compression when fabricating the electrode sheet.
 | ||
| Fig. 6 (a) Variation of the sheet density of the electrode, (b) specific capacitance of the electrodes and (c) energy density of soft pack with the addition of FWCNTs. | ||
The presence of a large void inside the electrode sheet explained the fact that the Udrop value did not decrease linearly with addition of FWCNTs (Fig. 5f). Probably due to this same processing disadvantage, CNTs are always ground into monodispersed, small sections with lengths less than 1–2 micrometres when they are used as conductive agents in the cathode of Li-ion batteries.29,30 This latter case also calls for a sheet with high packing density to obtain high energy density.
In addition, low density (or high porosity) of the sheet resulted in low loading of the electrode in the soft pack, in agreement with the previous study.31 In this case, if calculated based on the specific capacitance, the value showed a different trend (Fig. 6b).
For a thick sheet of pure AC, the specific capacitance of the electrode is only 40 F g−1, nearly 40% that of a thin sheet of 100 μm. It is suggested that there is a serious ion diffusion limitation in the thick sheet. However, addition of 1 wt% of FWCNTs resulted in the value increasing to 78 F g−1, an increase of nearly 95%. After that, the specific capacitance values remained at 53–57 F g−1 on addition of 2 wt% to 5 wt% FWCNTs, all of which are higher than the value for pure AC. Seemingly, the addition of FWCNTs provided some voids, increasing the contact efficiency of the AC and electrolyte.
The volcano curve suggested clearly the trade-off effect between providing a diffusion channel and decreasing the electrode/electrolyte interface by adding FWCNTs. Such a trade-off effect was also applicable to the energy density of the device (Fig. 6c), which is 1.87 W h kg−1 for the soft pack using pure AC, but which increases to 2.5 W h kg−1 with the addition of 1 wt% FWCNTs. Addition of 1 wt% FWCNTs allowed an increase in the energy density of the soft pack by 30%, a very high measurement. After that, adding too much FWCNTs resulted in a lower energy density of the soft pack. Similarly, addition of 1–2 wt% CNTs gave an optimized performance of a LiFePO4 sheet for a Li-ion battery.30
EIS data also confirmed the addition effect of FWCNTs in decreasing the inner resistance of the soft pack (Fig. 7a). The trace for adding 2–3 wt% FWCNTs is relatively straight, close to the ideal electrostatic double-layer capacitor (EDLC) response. In comparison, the traces for adding 1 wt% or 5 wt% FWCNTs deviated from the vertical type to some degree, validating the mass transfer control in these soft packs. Actually, the presence of a large void in the sheet (as with the addition of 5 wt% FWCNTs) and the too thick and compact sheet (as with addition of 1 wt% FWCNTs) both influenced the smooth diffusion of electrolyte ions to some degree. However, the semicircles are all very small and the inner resistance (RΩ) values are all lower than 0.3 Ω for the four cases of addition of FWCNTs (Fig. 7a). In comparison, the resistance (RΩ) for using pure AC is larger than that for adding 1–3 wt% FWCNTs. In addition, there is an obvious semicircle for pure AC, but not for the additions of FWCNTs, also validating the high resistance in the pure AC system. The results suggest that the addition of FWCNTs is effective in increasing the electrical conductivity of the electrode sheet.
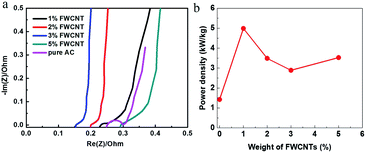 | ||
| Fig. 7 (a) EIS data of different soft packs in the low frequency region. (b) Variation of power density of soft packs with the addition of FWCNTs. | ||
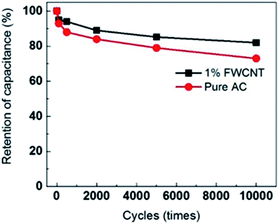
As expected, the power density of the soft pack increased from 1.5 kW kg−1 (pure AC) to 5 kW kg−1 (adding 1 wt% FWCNTs) (Fig. 7b). The power density of the soft pack adding 2–5 wt% FWCNTs remained in the range of 3–3.5 kW kg−1. Such a volcano-type curve also suggested the trade-off effect between the power density and the weight of the soft pack. The cycling stability of different devices was tested by repeating the charge and discharge for 10![[thin space (1/6-em)]](https://www.rsc.org/images/entities/char_2009.gif) 000 cycles at a scanning rate of 0.5 A g−1 (Fig. 8). Retention of capacitance for the device with addition of 1% FWCNTs is approximately 82%, which is higher than that for pure AC (73%). The gap in retention of capacitance increased between 5000 and 10
000 cycles at a scanning rate of 0.5 A g−1 (Fig. 8). Retention of capacitance for the device with addition of 1% FWCNTs is approximately 82%, which is higher than that for pure AC (73%). The gap in retention of capacitance increased between 5000 and 10![[thin space (1/6-em)]](https://www.rsc.org/images/entities/char_2009.gif) 000 cycles. Quantitatively, the deviation value is 6% at 5000 cycles, and 9% at 10
000 cycles. Quantitatively, the deviation value is 6% at 5000 cycles, and 9% at 10![[thin space (1/6-em)]](https://www.rsc.org/images/entities/char_2009.gif) 000 cycles. FWCNTs, with an exohedral surface, exhibited better performance than AC, with an endohedral surface. The pores of AC were easily blocked after the long cycling times. This result also validated the effect of FWCNTs in decreasing the resistance. As to the retention of capacitance, this is a very high value considering the use of pure FWCNTs as the electrode (in coin cell, 4 V, organic electrolyte) is just 84% in organic electrolyte.32 Longer lifetimes can be expected if the thickness of the electrode sheet is decreased to the normal value and further investigations are under way.
000 cycles. FWCNTs, with an exohedral surface, exhibited better performance than AC, with an endohedral surface. The pores of AC were easily blocked after the long cycling times. This result also validated the effect of FWCNTs in decreasing the resistance. As to the retention of capacitance, this is a very high value considering the use of pure FWCNTs as the electrode (in coin cell, 4 V, organic electrolyte) is just 84% in organic electrolyte.32 Longer lifetimes can be expected if the thickness of the electrode sheet is decreased to the normal value and further investigations are under way.
In summary, the addition of FWCNTs to AC-based electrodes resulted in a decrease in sheet density, but an increase in the specific capacitance of the electrode and the electrical conductivity of the device. As a result, there is an apparent trade-off effect balancing the performance based on the electrode and that based on the device. The addition of 1 wt% FWCNTs is effective in giving a significant increase in energy density and power density to the device, as well as in improving the cycling stability. These results provide insight into the effects of new carbon materials (FWCNTs) for improving conventional AC-based devices.
Conflicts of interest
There are no conflicts to declare.Acknowledgements
The authors are grateful to Prof. ZhiAn Zhang for the assistance in logic discussions, manuscript preparation and the guidance in activated carbon based capacitors.Notes and references
- M. Inagaki, H. Konno and O. Tanaike, J. Power Sources, 2010, 195, 7880–7903 CrossRef CAS.
- J. S. Huang, B. G. Sumpter, V. Meunier, G. Yushin, C. Portet and Y. Gogotsi, J. Mater. Res., 2010, 25(8), 1525–1531 CrossRef CAS.
- F. B. Sillars, S. I. Fletcher, M. Mirzaeian and P. J. Hall, Energy Environ. Sci., 2011, 4, 695–706 RSC.
- P. Simon and Y. Gogotsi, Acc. Chem. Res., 2013, 46(5), 1094–1103 CrossRef CAS PubMed.
- J. Chmiola, G. Yushin, Y. Gogotsi, C. Portet, P. Simon and P. L. Taberna, Science, 2006, 313, 1760–1763 CrossRef CAS PubMed.
- A. S. Arico, P. Bruce, B. Scrosatl, J. M. Tarascon and W. V. Schalkwijk, Nat. Mater., 2005, 4(5), 366–377 CrossRef CAS PubMed.
- J. R. Miller, R. A. Outlaw and B. C. Holloway, Science, 2010, 329, 1637–1639 CrossRef CAS PubMed.
- A. Izadi-Najafabadi, D. N. Futaba, S. Iijima and K. Hata, J. Am. Chem. Soc., 2010, 132(51), 18017–18019 CrossRef CAS PubMed.
- A. Izadi-Najafabadi, S. Yasuda, K. Kobashi, T. Yamada, D. N. Futaba and H. Hatori, Adv. Mater., 2010, 22(35), E235–E241 CrossRef CAS PubMed.
- T. Hiraoka, A. Izadi-Najafabadi, T. Yamada, D. N. Futaba, S. Yasuda and O. Tanaike, et al., Adv. Funct. Mater., 2010, 20(3), 422–428 CrossRef CAS.
- D. N. Futaba, K. Hata, T. Yamada, T. Hiraoka, Y. H. Hayamizu and Y. Kakudate, et al., Nat. Mater., 2006, 5(12), 987–994 CrossRef CAS PubMed.
- Z. Q. Niu, W. Y. Zhou, J. Chen, G. X. Feng, H. Li and W. J. Ma, et al., Energy Environ. Sci., 2011, 4(4), 1440–1446 RSC.
- G. Q. Ning, Z. J. Fan, G. Wang, J. S. Gao, W. Z. Qian and F. Wei, Chem. Commun., 2011, 47, 5976–5978 RSC.
- Y. T. Yu, C. J. Cui, W. Z. Qian and F. Wei, J. Mater. Chem. A, 2014, 2, 19897–19902 RSC.
- P. L. Taberna, G. Cheevallier, P. Simon, D. Plee and T. Aubert, Mater. Res. Bull., 2006, 41, 478–484 CrossRef CAS.
- G. H. Xu, C. Zheng, Q. Zhang, J. Q. Huang, M. Q. Zhao and J. Q. Nie, Nano Res., 2011, 4(9), 870–881 CrossRef CAS.
- C. Zheng, W. Z. Qian and F. Wei, Mater. Sci. Eng., B, 2012, 177(13), 1138–1140 CrossRef CAS.
- M. M. Huq, C. T. Hsieh and C. Y. Ho, Diamond Relat. Mater., 2016, 62, 58–64 CrossRef CAS.
- X. Gui, J. Wei, K. Wang, A. Cao, H. Zhu and Y. Jia, et al., Adv. Mater., 2010, 22(5), 617–621 CrossRef CAS PubMed.
- X. Gui, H. Li, K. Wang, J. Wei, Y. Jia and Z. Li, et al., Acta Mater., 2011, 59(12), 4798–4804 CrossRef CAS.
- H. Bi, X. Xie, K. Yin, Y. Zhou, S. Wan and L. He, et al., Adv. Funct. Mater., 2012, 22(21), 4421–4425 CrossRef CAS.
- Y. Si, J. Yu, X. Tang, J. Ge and B. Ding, Nat. Commun., 2014, 5, 5802 CrossRef PubMed.
- H. W. Im, T. W. Kim, H. L. Song, J. H. Choi, J. S. Park, R. Ovalle-Robles, H. D. Yang, K. D. Kihm, R. H. Baughman, H. H. Lee, T. J. Kang and Y. H. Kim, Nat. Commun., 2016, 1–9, DOI:10.1038/ncomms10600.
- I. Dayson and P. Griffin, J. Power Sources, 2003, 116, 263–282 CrossRef.
- H. F. Wang, Z. H. Li, K. Ghosh, T. Maruyama, S. Inoue and Y. Ando, Carbon, 2010, 48, 2882–2889 CrossRef CAS.
- M. Milnera, J. Kurti, M. Hulman and H. Kuzmany, Phys. Rev. Lett., 2000, 84(6), 1324–1327 CrossRef CAS PubMed.
- F. Zhang, P. X. Hou, C. Liu, B. W. Wang, H. Jiang and M. L. Chen, et al., Nat. Commun., 2016, 7(11160), 1–8 Search PubMed.
- W. Z. Qian, T. Liu, F. Wei and H. Y. Yuan, Carbon, 2003, 41, 1851–1854 CrossRef CAS.
- X. M. Liu, Z. D. Huang, S. W. Oh, B. Zhang, P. C. Ma, M. M. F. Yuen and J. K. Kim, Compos. Sci. Technol., 2012, 72, 121–144 CrossRef CAS.
- L. Qian, G. L. Yang, B. B. Yang and H. T. Wang, Batteries, 2016, 46, 217–219 Search PubMed.
- Y. H. Chen, C. W. Wang, G. Liu, X. Y. Song, V. S. Battagli and A. M. Sastry, J. Electrochem. Soc., 2007, 154, A978–A986 CrossRef CAS.
- C. Y. Kong, W. Z. Qian, C. Zheng, Y. T. Yu, C. J. Cui and F. Wei, Chem. Commun., 2013, 49, 10727–10729 RSC.
| This journal is © The Royal Society of Chemistry 2019 |


