
 Open Access Article
 This Open Access Article is licensed under a Creative Commons Attribution-Non Commercial 3.0 Unported Licence
Revealing a new fluorescence peak of the enhanced green fluorescent protein using three-dimensional fluorescence spectroscopy†
Nathalia Vieira dos Santos ab,
Carolina Falaschi Saponiab,
Tamar Louise Greavesb and
Jorge Fernando Brandão Pereira*a
ab,
Carolina Falaschi Saponiab,
Tamar Louise Greavesb and
Jorge Fernando Brandão Pereira*a
aDepartment of Bioprocesses and Biotechnology, School of Pharmaceutical Sciences, São Paulo State University (UNESP), Rodovia Araraquara-Jaú/Km 01, 14800-903, Araraquara, SP, Brazil. E-mail: jfb.pereira@unesp.br; Tel: +55-16-3301-4675
bSchool of Science, College of Science, Engineering and Health, Royal Melbourne Institute of Technology, 124 La Trobe Street, 3000, Melbourne, VIC, Australia
First published on 24th July 2019
Abstract
Fluorescent proteins have many applications as biomarkers and biosensors in the medical and biological fields. Their success was largely supported by modifications of the first isolated fluorescent protein, the wild-type Green Fluorescent Protein (wtGFP), which allowed the development of improved variants such as the Enhanced GFP (EGFP). The first reports on EGFP indicated that the protein presented a single form and fluorescence peak, in contrast to the two conformations observed in wtGFP. However, after experimental determination of the crystalline structure of EGFP, two conformations were found, generating questions regarding the relationship between EGFP structure and its spectral characteristics. To resolve the controversy, this study evaluated EGFP 3D fluorescence spectra at lower wavelengths and under distinct conditions (different concentrations, pH and temperatures), revealing the existence of a second fluorescence peak for this protein. It was possible to confirm that the new peak was not a reflection of the intrinsic fluorescence of proteins or an artefact from the 3D fluorescence spectroscopy. It was also shown that the second peak is pH dependent, sensitive to high temperatures and linearly related to EGFP concentration, confirming a direct relationship between the new fluorescence peak and EGFP protein structure. In addition to the revelation of the new EGFP fluorescence peak, this study demonstrated that 3D fluorescence can be used as powerful technique in the discovery of other elusive fluorophores.
1 Introduction
Fluorescent proteins play a major role in modern biological and medical sciences, with extensive use as biomarkers and biosensors1–3 and giving around 70![[thin space (1/6-em)]](https://www.rsc.org/images/entities/char_2009.gif) 000 results in a PubMed search (January 2019).4 Their success is largely due to the modifications in the first isolated fluorescent protein,2 wild-type Green Fluorescent Protein (wtGFP),5 which created variants with increased fluorescence intensity at longer wavelengths and improved folding above 20 °C, such as the Enhanced GFP (EGFP, mutations F64L/S65T).6 Due to its properties, EGFP was successfully used as a fusion protein in the quantification of cells, reactions and cellular components,7 monitoring intracellular pH,8 whole-body imaging,9 and many other applications.7,10 The first fluorescence studies on EGFP suggested the protein had a single form and fluorescence peak, in contrast to what was seen for wtGFP, which presented protonated and unprotonated states with distinct conformations and fluorescence peaks.11 However, after the experimental determination of the crystalline structure of EGFP, multiple groups reported two different conformations for the protein,12,13 generating questions regarding the relationship between EGFP structure and spectral characteristics.
000 results in a PubMed search (January 2019).4 Their success is largely due to the modifications in the first isolated fluorescent protein,2 wild-type Green Fluorescent Protein (wtGFP),5 which created variants with increased fluorescence intensity at longer wavelengths and improved folding above 20 °C, such as the Enhanced GFP (EGFP, mutations F64L/S65T).6 Due to its properties, EGFP was successfully used as a fusion protein in the quantification of cells, reactions and cellular components,7 monitoring intracellular pH,8 whole-body imaging,9 and many other applications.7,10 The first fluorescence studies on EGFP suggested the protein had a single form and fluorescence peak, in contrast to what was seen for wtGFP, which presented protonated and unprotonated states with distinct conformations and fluorescence peaks.11 However, after the experimental determination of the crystalline structure of EGFP, multiple groups reported two different conformations for the protein,12,13 generating questions regarding the relationship between EGFP structure and spectral characteristics.
Considering fluorescence is usually extremely sensitive to changes in the fluorophore conformation or microenvironment,14 the first report determining EGFP structure stated that the presence of two crystalline forms was an “apparent contradiction with the single fluorescence lifetime of the protein”.12 This phenomenon, also reported by Arpino et al. 2012,13 was explained as a stabilizing effect of the Glu22 residue over the chromophore, which supposedly maintained its structure despite the conformational changes of the protein. However, the multiple fluorescence studies that reported the existence of only a single fluorescence peak for EGFP6,12,13,15 only evaluated longer excitation wavelengths (above 350 nm), using two-dimensional (2D) fluorescence spectra and spectrofluorophotometers with resolutions far inferior to what is currently available. Additionally, modern spectrofluorophotometers allow the evaluation of three-dimensional (3D) fluorescence spectra, which analyses both excitation and emission spectra in a single assay across a larger spectral range. Consequently, 3D fluorescence can unravel the complex nature of fluorescent-based compounds and provide further insights into their spectroscopic properties.16 EGFP homogeneous fluorescence spectrum for the two distinct conformations is still a disputed subject, hence, this study aimed to elucidate this controversy using modern 3D fluorescence analysis at lower wavelengths.
2 Materials and methods
2.1 Materials
Potassium Phosphate Buffer (PB, 10 mM pH 7.4) was prepared with MilliQ water, anhydrous dipotassium hydrogen phosphate (K2HPO4, 98–100.5%) from Qhemis® and anhydrous monopotassium hydrogen phosphate (KH2PO4, 99%) from Synth® (Brazil). The pH of the buffer was adjusted to pH 7.4 using 3 mol L−1 solutions of phosphoric acid (H3PO4, 85% in H2O) and potassium hydroxide (KOH, 45% in H2O), both from Sigma-Aldrich®. Bovine Serum Albumin (BSA, >98%) and other reactants used in this study were acquired from Sigma-Aldrich®. EGFP Quantitation Kit K815-100 from Biovision® (purity ≥ 97%) was used as a standard (standard EGFP).2.2 Production and purification of EGFP
Enhanced Green Fluorescent Protein (EGFP) with ≥97% purity was produced, purified and quantified using methods previously developed by the group and detailed in dos Santos et al. 2018, using Escherichia coli BL21 (DE3) with plasmids pLysS and pET28(a), aqueous biphasic system and ultrafiltration.17 The equivalency of the EGFP standard from the Biovision® quantification kit and the EGFP produced and purified in this study was confirmed by a sodium dodecyl sulfate polyacrylamide gel electrophoresis (SDS-PAGE), detailed in the ESI, Section S.1.†2.3 EGFP absorbance and fluorescence analysis
The 3D fluorescence spectra were acquired at 25 °C using a RF-6000 Shimadzu® spectrofluorophotometer with a variable excitation wavelength (λex) range of 240–550 nm and emission wavelength (λem) range of 470–570 nm, with an interval of 2.0 nm for λex and 1.0 nm for λem, scan speed 6000 nm min−1, λex bandwidth 10.0 nm and λem bandwidth 1.0 nm. Samples were prepared 30 (±5) min before each reading. From the 3D spectra (Fig. 1B), it was possible to extract excitation and emission spectra for EGFP 5.4 μg mL−1 at PB pH 7.4 (Fig. 1C and D, for excitation and emission respectively). Fluorescence intensity (UF) single points and the absorbance spectrum (λ 250–800 nm, EGFP 0.216 mg mL−1, Fig. 1E) were obtained using EnSpire® Multimode Plate Reader, from PerkinElmer®. The 3D spectra are depicted in the figures as a representative of the triplicate, while the excitation, emission and absorbance spectra are the average of the three samples.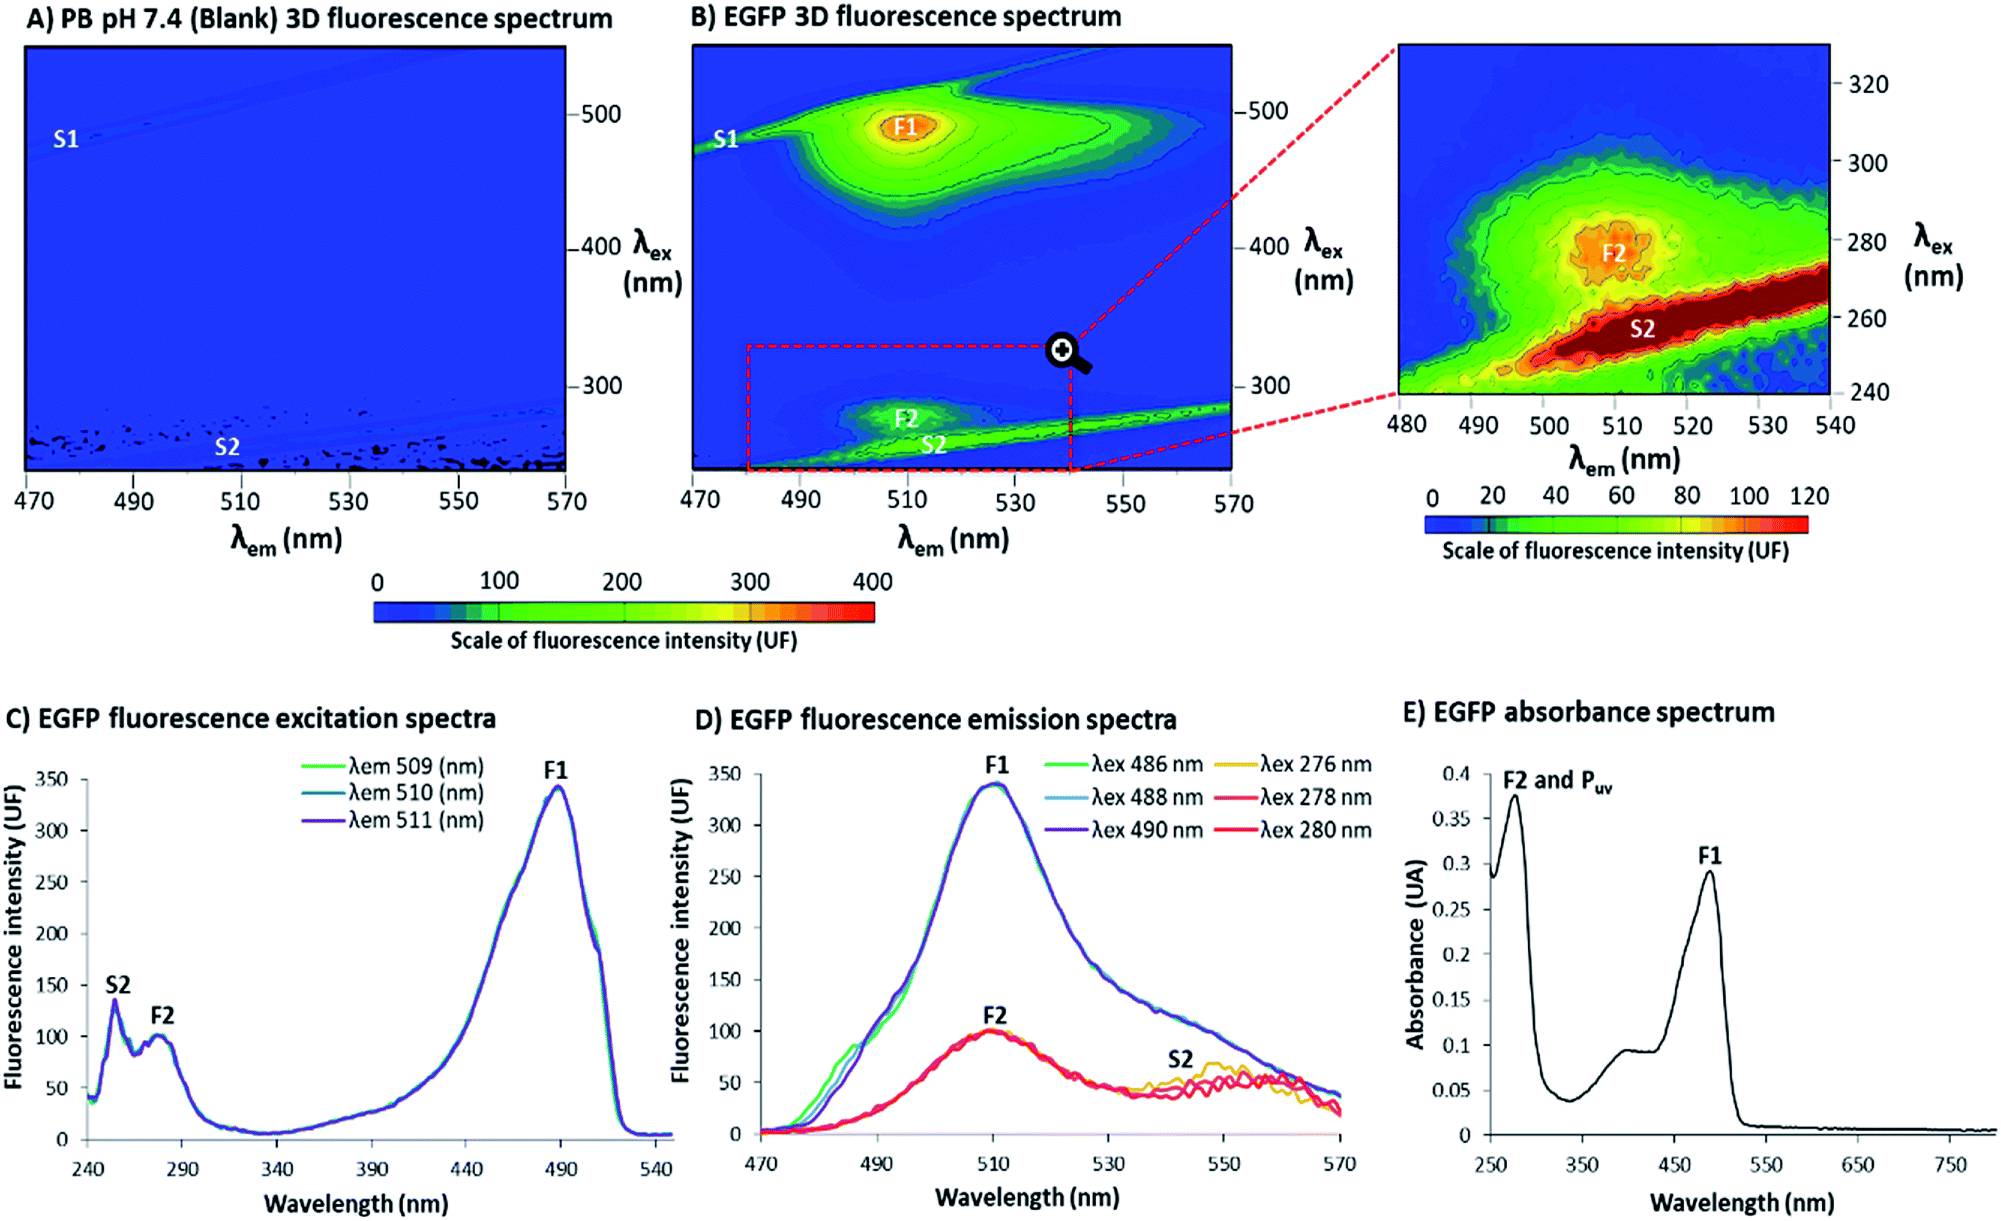 | ||
| Fig. 1 3D fluorescence spectra at 25 °C in phosphate buffer (PB) pH 7.4 of: (A) blank and (B) EGFP 5.4 μg mL−1, range λex 240–550 nm and λem 470–570 nm, scale of fluorescence intensity 0–400 units of fluorescence (UF) and corresponding zoomed region of EGFP in a range of λex 240–330 nm and λem 480–540 nm, scale of fluorescence intensity 0–120 UF. 3D fluorescence spectra with the excitation wavelengths in the Y axis (λex), the emission wavelengths in the X axis (λem) and the scale of fluorescence intensity (UF) according the color scale from blue to red. F1 (around λex 488 nm/λem 510 nm) and F2 (around λex 278 nm/λem 510 nm) are the two fluorescence points with highest intensity; S1 and S2 are first and second order light scattering, respectively. (C) EGFP (5.4 μg mL−1) fluorescence excitation spectra (λex 240–550 nm) for emissions 509 (green), 510 (blue) and 511 nm (purple) and (D) EGFP (5.4 μg mL−1) fluorescence emission spectra (λem 470–570 nm) for excitations 276 (yellow), 278 (pink), 280 (red), 486 (green), 488 (blue) and 490 nm (purple). (E) EGFP (0.216 mg mL−1) absorbance spectrum (λ 250–800 nm) in units of absorbance (UA); F2 and protein intrinsic absorbance in UV (Puv) have an overlapping peak at 276 nm and F1 a peak at 488 nm. Triplicate measurements with corresponding blank assays, where a representative of the triplicate for the 3D spectra are depicted and the average of the results are presented for excitation, emission and absorbance spectra. | ||
2.4 3D spectra of EGFP standard and BSA
To confirm the presence of the second peak of EGFP and discard the possibility of a reflection from other fluorophores, a standard from EGFP Quantitation Kit K815-100 from Biovision® (in assay buffer pH 8.0, formulation not disclosed, property of Biovision®) and BSA were also evaluated using 3D spectra (Fig. 2). Configuration of the spectrofluorophotometer was as described in Section 2.3, but the spectral range were changed to λex 240–530 nm/λem 470–570 nm for standard EGFP and λex 240–530 nm/λem 280–580 nm for BSA.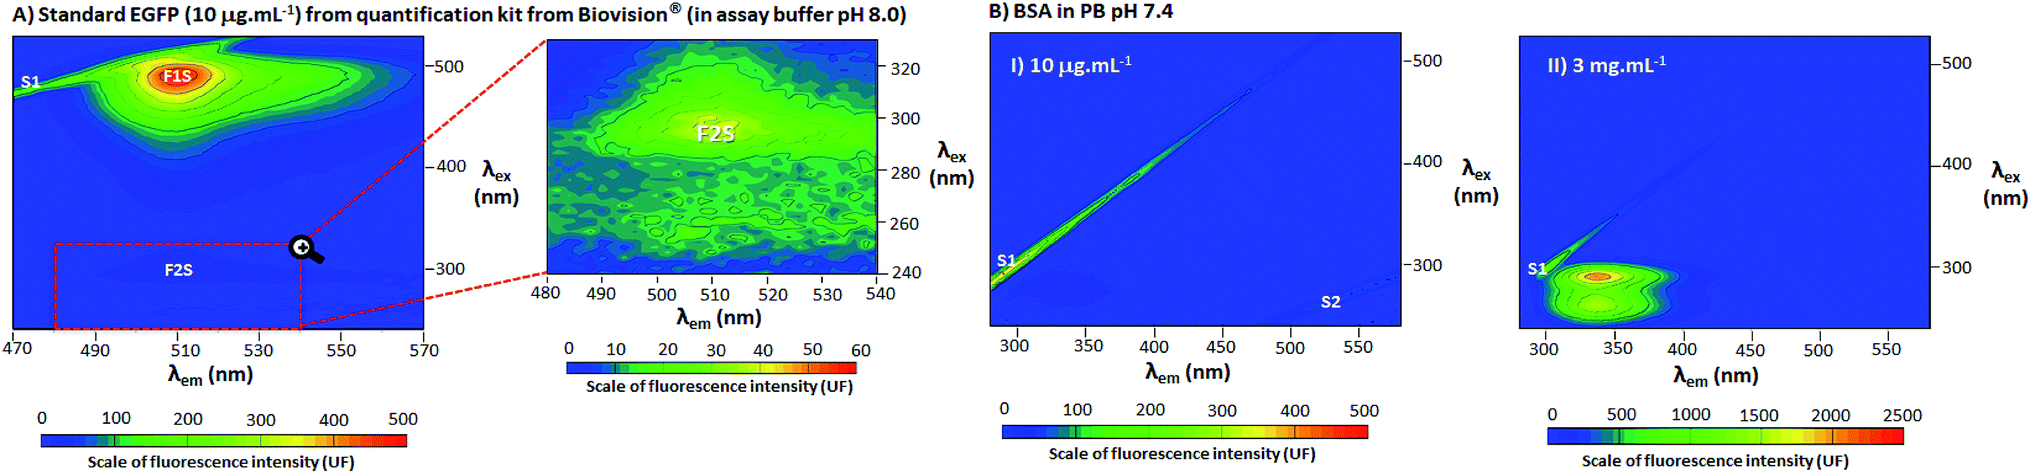 | ||
| Fig. 2 (A) 3D fluorescence spectra at 25 °C of standard EGFP (10 μg mL−1) from quantification kit from Biovision® (in assay buffer pH 8.0), range λex 240–530 nm and λem 470–570 nm, scale of fluorescence intensity 0–500 units of fluorescence (UF) and corresponding zoomed region of EGFP in a range of λex 240–330 nm and λem 480–540 nm, scale of fluorescence intensity 0–60 UF. (B) 3D fluorescence spectra of BSA in PB pH 7.4, range λex 240–530 nm and λem 280–580 nm (EGFP concentration 10 μg mL−1 and scale of florescence intensity 0–500 UF in (B.I) and 3 mg mL−1 in 0–2500 UF in (B.II)). 3D fluorescence spectra with the excitation wavelengths in the Y axis (λex), the emission wavelengths in the X axis (λem) and the scale of fluorescence intensity (UF) according the color scale from blue to red. F1S (around λex 488 nm/λem 510 nm) and F2S (around λex 296 nm/λem 510 nm) are the two fluorescence points with highest intensity and S1 and S2 are the first and second order light scattering, respectively. | ||
2.5 Effect of concentration, pH and high temperature in EGFP peaks
To assess the behavior of EGFP fluorescence peaks, 3D spectra were also acquired at different EGFP concentrations (at 21.6, 10.8, 7.2 and 5.4 μg mL−1, shown in Fig. 3A), pH (6.0 and 7.4, Fig. 3C), and after 3 h at high temperature (90 °C, Fig. 3D). 3D spectra configuration was as described in Section 2.3, with λex 240–330 nm/λem 480–540 nm for Fig. 3A and λex 240–550 nm/λem 470–570 nm for Fig. 3C and D. The calibration curves of EGFP were acquired at F2 (λex 278 nm/λem 510 nm) and F1 (λex 488 nm/λem 510 nm), with point fluorescence analysis using the EnSight™ multimode plate reader from PerkinElmer®. The equations for the calculation of limit of detection (LOD), limit of quantification (LOQ) and relative standard deviation (RSD) are presented in the ESI, Section S.3.† The pH (±0.003) at 25 (±1) °C of the samples were measured using a portable pH meter and conductometer Metrohm®/Model 914, calibrated with standard buffers (pH values of 7.00 and 4.01), and adjusted using 3 mol L−1 solutions of H3PO4 and KOH. The test at high temperature was performed in a thermoblock at 90 °C for 3 h. After the samples were removed from the thermoblock, they were maintained for 30 min at 25 °C and then the fluorescence was measured. All the pH, high temperature and calibration experiments were carried out in triplicate with corresponding blanks; the 3D spectra are presented as a representative of the triplicate and the calibration curve is the average of three independent samples with the respective standard deviations.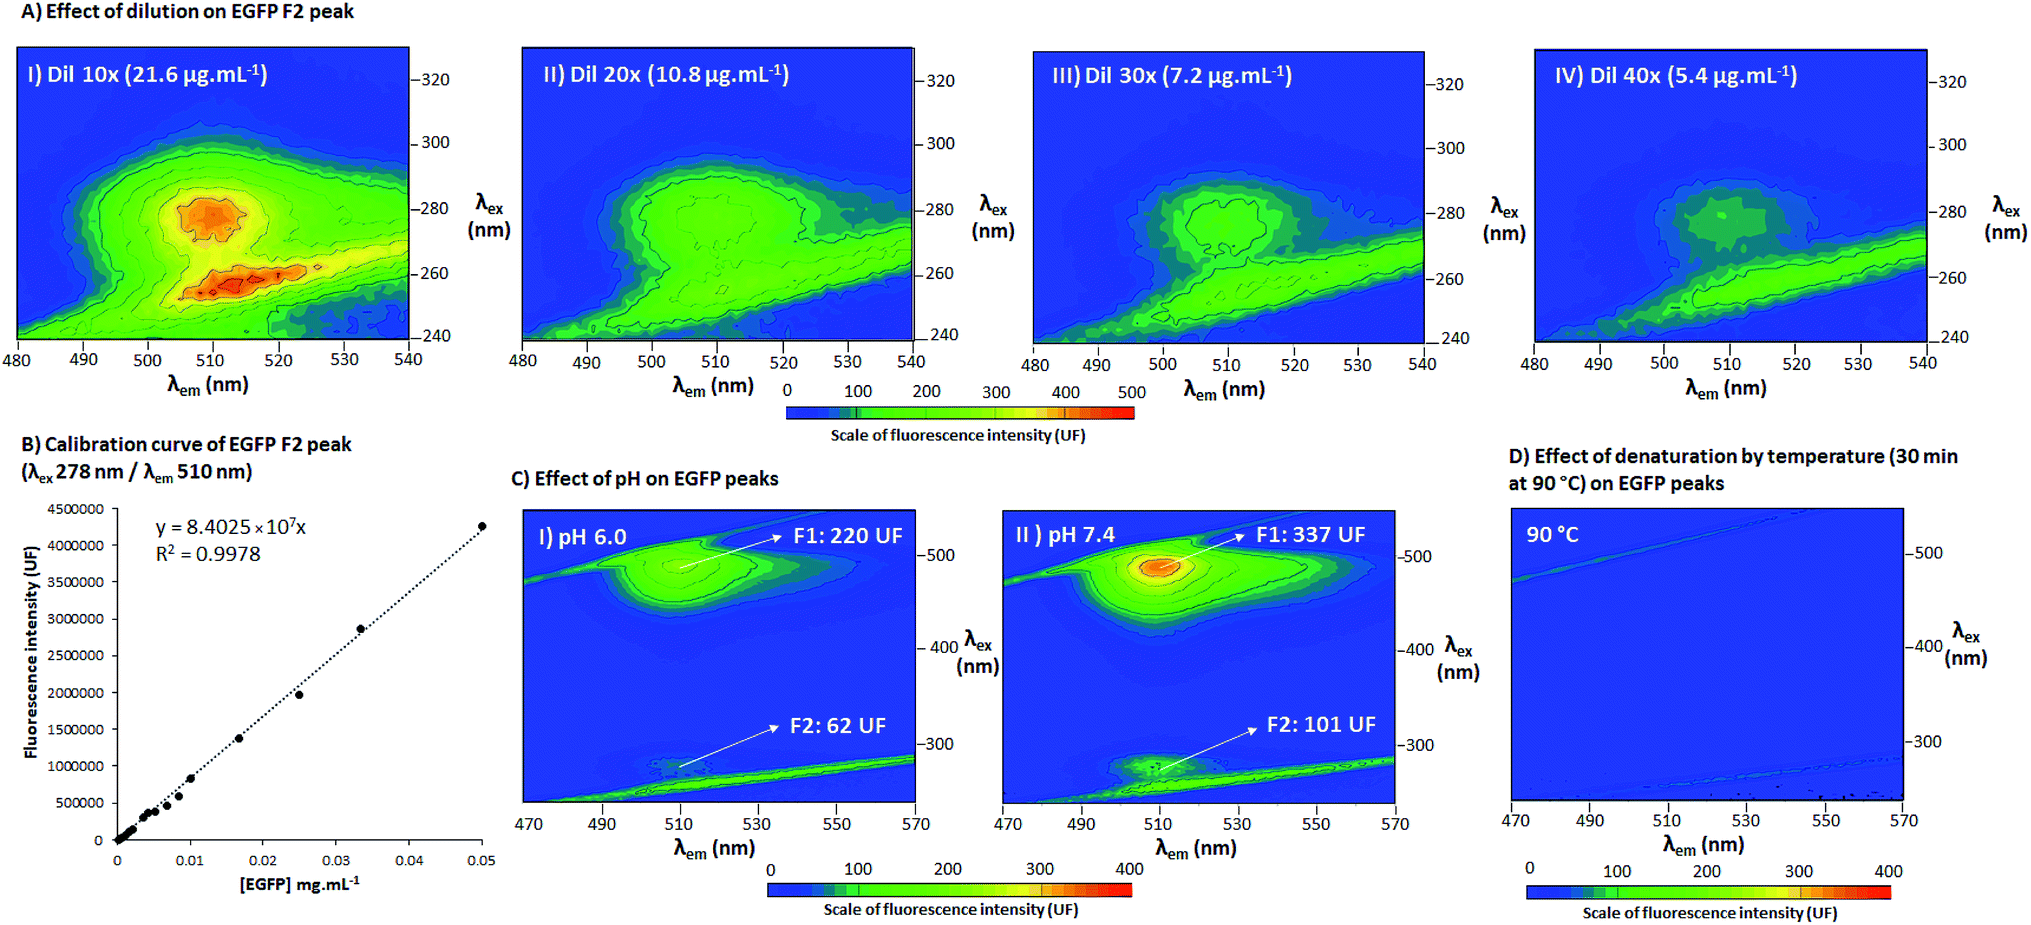 | ||
| Fig. 3 (A) 3D fluorescence spectra at PB pH 7.4 at 25 °C of different concentrations of EGFP ((A.I) – dil 10×, 21.6 μg mL−1; (A.II) – dil 20×, 10.8 μg mL−1; (A.III) – dil 30×, 7.2 μg mL−1; (A.IV) – dil 40×, 5.4 μg mL−1), range λex 240–330 nm and λem 480–540 nm, scale of fluorescence intensity 0–500 UF. (B) Calibration curve for EGFP F2 peak (λex 278 nm/λem 510 nm), concentration of EGFP [EGFP] (mg mL−1) in the X axis and fluorescence intensity (UF) in the Y axis. (C) 3D fluorescence spectra of EGFP in PB of different pH ((C.I) – pH 6.0 and (C.II) – pH 7.4) and (D) after denaturation by temperature in PB pH 7.4 (30 min at 90 °C), range λex 240–550 nm and λem 470–570 nm, scale of florescence intensity (UF) 0–400. 3D fluorescence spectra with the excitation wavelengths in the Y axis (λex), the emission wavelengths in the X axis (λem) and the scale of fluorescence intensity (UF) according the color scale from blue to red. F1 (around λex 488 nm/λem 510 nm) and F2 (around λex 296 nm/λem 510 nm) are the two fluorescence points with highest intensity. Triplicate measurements with corresponding blank assays for the pH, calibration curve and high temperature experiments, where a representative of the triplicate for the 3D spectra are depicted and the average of the results with respective standard deviations are presented for the calibration curve. | ||
3 Results and discussion
In Fig. 1, EGFP in phosphate buffer (PB) pH 7.4 was evaluated by 3D fluorescence spectra at 25 °C. In-depth explanations about 3D fluorescence spectra interpretation and Rayleigh light scattering can be found in the ESI, Section S.2.† In Fig. 1A, the 3D spectrum of PB pH 7.4 (blank) showed no evidence of fluorophores, with detection of only the first and second order Rayleigh light scattering (S1 and S2, respectively). In Fig. 1B, the EGFP 3D spectrum contained two distinct non-overlapping peaks, labelled as F1 and F2. At F1, there was a higher and sharper peak at λex 488 nm and λem 510 nm, while at F2 (highlighted in the zoomed region) there was a smaller and less distinct peak λex 278 nm and λem 510 nm. The 2D fluorescence spectra of excitation (Fig. 1C) and emission (Fig. 1D) for EGFP also depict F1, F2 and S2 (wavelengths (λ) selected to be close to the points of highest fluorescence intensity). Additionally, Fig. 1E shows the absorbance spectrum for EGFP from ultraviolet (UV) to visible light (250–800 nm), with the peaks corresponding to F1 and F2 labelled. Together with F2, Fig. 1E also presents the intrinsic absorbance in UV light of proteins that contain the amino acids tyrosine (Tyr), tryptophan (Trp) and/or phenylalanine (Phe), labelled as Puv. The absorbance and fluorescence of proteins with the aforementioned amino acids around λ 280 nm is a well-stablished phenomenon,16,18 and considering EGFP presents Tyr, Trp and Phe in its structure,12 the highest peak at 276 nm is likely the result of an overlap of F2 and Puv. The other band observed around 350 and 450 nm in the absorbance spectrum corresponds to the protonation state of the chromophore, as previously suggested.19 Although this band appeared in absorbance spectra, it is absent in the fluorescence spectrum, since fluorophores are very sensitive to environmental changes16 and would required more specific conditions to manifest the protonation state of EGFP.A standard from a quantification kit from Biovision® was also measured by 3D fluorescence (EGFP standard in assay buffer pH 8.0) to confirm the presence of a second peak in EGFP, and that this was not a result of modifications of the protein during expression and purification. The 3D fluorescence spectrum of the EGFP standard, depicted in Fig. 2A, shows that, as for the EGFP produced in the laboratory, it is possible to discern two distinct peaks labelled as F1S and F2S (the latter highlighted in the zoomed region). The peak marked as F1S was identical to F1 for the EGFP from the research group, and the emission for F2S was maintained at λem 510 nm. However, there was a considerable red shift for the excitation wavelength of F2S (highest fluorescence intensity at λex 278 nm for EGFP F2 to λex 296 nm for EGFP standard F2S). The red shift in F2S is likely due to a change of the environment around the fluorophore caused by the difference in buffer pH and composition, a well-known effect for fluorophores.20 However, even considering the shift in λex, the presence of two distinct and not overlapping peaks for EGFP is clear in Fig. 2A. Additionally, to confirm peak F2 was related to EGFP fluorophore and not only a reflection or residue of the intrinsic fluorescence of proteins (characteristic of proteins which contain the amino acids Tyr, Trp and/or Phe in their structure, with peaks around λex 280 nm and λem 300–400 nm),16 Bovine Serum Albumin (BSA, rich in Tyr, Trp and Phe)21 was characterized by 3D fluorescence spectra (Fig. 2B). As can be seen in Fig. 2B.I, there was no detectable fluorescence above λem 450 nm for BSA at the same concentration of the EGFP standard (10 μg mL−1). This confirms there is no reflection or residue of the fluorescence of amino acids at the position of F2S. Even at high BSA concentration (3 mg mL−1), shown in Fig. 2B.II, where the fluorescence intensity between λem 300–400 nm surpassed 2000 UF, there was still no fluorescence around the F2 position, fully confirming that the amino acids do not contribute to EGFP fluorescence at F2S.
Finally, to understand the behavior of EGFP fluorescent peaks under different conditions, 3D spectra were also acquired for EGFP in a series of dilutions (Fig. 3A, with a calibration curve for peak F2 in Fig. 3B), at different pH (pH 7.4 in Fig. 3C.I and pH 6.0 in Fig. 3C.II) and after denaturation at high temperature (3 h at 90 °C, Fig. 3D). Fig. 3A and B indicate that the fluorescence of F2 is highly dependent on protein concentration. As can be seen in a comparison of the calibration curves for F1 and F2 (Table S1 of ESI†), F2 presented a coefficient of determination (R2) and RSD very similar to those of F1 (R2 of 0.9981 and 0.9978, RSD of 2.1% and 2.8% for F1 and F2, respectively). These parameters are associated with the precision and repeatability of quantification, indicating F2 can be as precise as F1 for analytical procedures. The curves for F1 and F2 presented the same upper limit (0.05 mg mL−1), but different lower limits of detection and quantification (LOD and LOQ for F1 were 25 and 33 ng mL−1 and 462 and 633 ng mL−1 for F2), showing F1 is indeed one magnitude more sensitive than F2. This increased sensitivity of F1 is likely due to its higher fluorescence intensity when compared to F2. Despite presenting lower quantification limits, F2 still can be used to quantify EGFP with as much precision as F1 for concentrations as low as 0.6 μg mL−1, indicating it can be also applied for analytical purposes like F1. It must be also noted that F2 was detected in three different fluorophotometers, namely EnSpire® and EnSight™ Multimode Plate Readers from PerkinElmer® and RF-6000 SHIMADZU spectrofluorophotometer, confirming F2 was not a fluorescence artefact from specific equipment. Additionally, the effect of pH was explored through decreasing pH from 7.4 to 6, as presented in Fig. 3C.I and C.II, respectively. It is possible to conclude that both peaks are pH-sensitive, and from pH 7.4 to 6, there was a decrease of 46% of fluorescence intensity for F1 and 45% for F2 (average of a triplicate). This pH-dependence is analogous to what is seen for wtGFP, which presents one peak for its protonated form (favored by acidic pH) and another for its unprotonated form (favored by alkaline pH).11 This is also aligned with reports by Arpino et al. 201213 about the relationship between the two EGFP forms and the charged state of the fluorophore. Additionally, when EGFP was denatured after exposure to 90 °C for 3 h (Fig. 3D), the fluorescence disappeared, showing both peaks are sensitive to high temperatures. This suggests F2 fluorescence is intrinsically dependent on the maintenance of the protein structure, and not only a result of the amino acids fluorescence (which can maintain its fluorescence even in their free form and in denatured proteins)16 or other independent fluorophore groups. Hence, the results confirm a direct dependence of the protein structure for the fluorescence manifestation of peak F2.
From this study, it was revealed that EGFP presents two, and not one, fluorescence peaks (around λex 488 nm/λem 510 nm and λex 278 nm/λem 510 nm), which is consistent with the two conformations observed in its crystalline structure by different independent reports.12,13 This is analogous to what is seen for wtGFP, which displays two fluorescence peaks in the visible range (a major peak around λex 400 nm for the protonated form and a minor peak at λex 475 nm for the unprotonated state).11 Although the EGFP mutations (F64L/S65T) favor the unprotonated form (peak at λex 488 nm/λem 510 nm), the protonated conformation is still present in equilibrium, but at significantly lower λex when compared to the wtGFP (λex 278 nm for EGFP and λex 395 nm for wtGFP). This greater difference between the excitation wavelengths of the protonated and unprotonated forms also explains the increase in the fluorescence intensity of EGFP compared to wtGFP. Considering the excitation spectra for the two conformations of EGFP do not overlap like in wtGFP, at λex 488 nm, all energy is directed to excite the fluorophore of the unprotonated form. This lack of overlap also explains why previous studies only found one lifetime for EGFP, considering the excitation wavelength of the experiments was well above F2 (at 365 nm, 22 440 nm12,23 and 488 nm13). Another factor that complicated the detection of the EGFP second peak in previous studies was that both peak F2 of EGFP and the amino acids Tyr, Phe and/or Trp (also present in EGPF structure) present an absorbance peak around 280 nm.19 This could have led previous groups to conclude that the absorbance of EGFP in UV light was only due to the presence of these amino acids. Additionally, as can be seen in Fig. 1C and D, it can be difficult to discern fluorophores from fluorescence artefacts like Rayleigh scatterings using only 2D fluorescence analysis, and this can be even more arduous considering the possibility of other types of scattering like Raman,16 the presence of impurities in the sample, or the evaluation of mixtures with multiple fluorophores. Thus, by using 3D fluorescence spectroscopy, it is possible to evaluate the shape of the fluorophores and distinguish them from the different fluorescence artefacts, while also being able to obtain the 2D spectra. This makes 3D fluorescence spectroscopy a powerful tool in the analysis of fluorescent samples. The discovery of a second EGFP peak can be useful in the analysis of complex biological samples that present endogenous fluorophores with overlapping peaks with F1 (i.e. fluorophores that exhibit fluorescence at the same λ as EGFP F1), such as lipofuscin (range λex 410–470 nm/λem 500–695 nm) – a yellow-brown pigment granule present in many long-lived eukaryotic cells due to aging,24,25 other lipofuscin like-lipopigments/ceroids (range λex 400–500 nm/λem 480–700 nm),24 and many plants-derived biomolecules like lignin (maximum peaks at λex 335 nm/λem 455 nm and λex 488 nm/λem 535 nm) and flavonoids (maximum λex 488 nm/λem 535 nm).26 As both F1 and F2 can be quantified by fluorescence, F2 can be used to either confirm the values from F1 or analyze samples that exhibits interference in the F1 region.
4 Conclusions
In this study, a new peak for EGFP was detected, clarifying a controversy regarding its two distinct conformations in what was previously reported as a homogeneous fluorescence spectrum. Based on the new report regarding the structure of this broadly used protein, we suggest that researchers re-evaluate the fluorescence spectra of other fluorophores using more modern spectrofluorophotometers, which allow assessments at lower wavelengths and with higher resolution. Considering the importance of fluorescent proteins and other fluorophores as biomarkers and biosensors to thousands of studies in the biological, bioengineering and medical fields, the discovery of other peaks of fluorescence can improve and broaden the application of many techniques involving this property.Conflicts of interest
There are no conflicts to declare.Acknowledgements
This work was funded by FAPESP (São Paulo Research Foundation, Brazil) and Australian Technology Network of Universities (ATN), project 2018/50009-8. N. V. Santos (processes 2016/07529-5 and 18/06576-5), C. F. Saponi (process 2018/01858-2 and 2019/20833-0) and J. F. B. Pereira (processes 2014/16424-7 and 2014/19793-3) acknowledges financial support from FAPESP, CNPq and CAPES (finance code 001) and CAPES-PROEX. T. L. Greaves acknowledges the support of the Veski Victorian Fellowship.References
- K. A. Giuliano and D. L. Taylor, Trends Biotechnol., 1998, 16, 135–140 CrossRef CAS PubMed.
- E. A. Rodriguez, R. E. Campbell, J. Y. Lin, M. Z. Lin, A. Miyawaki, A. E. Palmer, X. Shu, J. Zhang and R. Y. Tsien, Trends Biochem. Sci., 2017, 42, 111–129 CrossRef CAS PubMed.
- C. M. Southward and M. G. Surette, Mol. Microbiol., 2002, 45, 1191–1196 CrossRef CAS PubMed.
- PubMed, PubMed Search: “fluorescent protein” or “fluorescent proteins”, https://www.ncbi.nlm.nih.gov/pubmed/?term=%22fluorescent+protein%22+or+%22fluorescent+proteins%22, accessed 25 January 2019.
- O. Shimomura, FEBS Lett., 1979, 104, 220–222 CrossRef CAS.
- B. P. Cormack, R. H. Valdivia and S. Falkow, Gene, 1996, 173, 33–38 CrossRef CAS PubMed.
- J. March, G. Rao and W. Bentley, Appl. Microbiol. Biotechnol., 2003, 62, 303–315 CrossRef CAS PubMed.
- T. Nakabayashi, H.-P. Wang, M. Kinjo and N. Ohta, Photochem. Photobiol. Sci., 2008, 7, 668–670 RSC.
- M. Yang, E. Baranov, P. Jiang, F.-X. Sun, X.-M. Li, L. Li, S. Hasegawa, M. Bouvet, M. Al-Tuwaijri and T. Chishima, Proc. Natl. Acad. Sci. U. S. A., 2000, 97, 1206–1211 CrossRef CAS PubMed.
- M. Zimmer, Chem. Rev., 2002, 102, 759–782 CrossRef CAS PubMed.
- R. Y. Tsien, Annu. Rev. Biochem., 1998, 67, 509–544 CrossRef CAS PubMed.
- A. Royant and M. Noirclerc-Savoye, J. Struct. Biol., 2011, 174, 385–390 CrossRef CAS PubMed.
- J. A. Arpino, P. J. Rizkallah and D. D. Jones, PLoS One, 2012, 7, e47132 CrossRef CAS PubMed.
- A. S. Ladokhin, in Encyclopedia of Analytical Chemistry: Applications, Theory and Instrumentation, ed. R. A. Meyers and C. Schöneich, John Wiley & Sons, Ltd, Online, 2006, DOI:10.1002/9780470027318.a1611.
- G. H. Patterson, S. M. Knobel, W. D. Sharif, S. R. Kain and D. W. Piston, Biophys. J., 1997, 73, 2782–2790 CrossRef CAS PubMed.
- A. Bortolotti, Y. H. Wong, S. S. Korsholm, N. H. B. Bahring, S. Bobone, S. Tayyab, M. Van De Weert and L. Stella, RSC Adv., 2016, 6, 112870–112876 RSC.
- N. V. dos Santos, M. Martins, V. C. Santos-Ebinuma, S. P. M. Ventura, J. A. P. Coutinho, S. R. Valentini and J. F. B. Pereira, ACS Sustainable Chem. Eng., 2018, 6, 9383–9393 CrossRef CAS.
- J. R. Whitaker and P. E. Granum, Anal. Biochem., 1980, 109, 156–159 CrossRef CAS PubMed.
- H. E. Seward and C. R. Bagshaw, Chem. Soc. Rev., 2009, 38(10), 2842–2851 RSC.
- N. Mataga, Y. Kaifu and M. Koizumi, Bull. Chem. Soc. Jpn., 1956, 29, 465–470 CrossRef CAS.
- A. Bujacz, Acta Crystallogr., Sect. D: Biol. Crystallogr., 2012, 68, 1278–1289 CrossRef CAS PubMed.
- O. V. Stepanenko, V. V. Verkhusha, V. I. Kazakov, M. M. Shavlovsky, I. M. Kuznetsova, V. N. Uversky and K. K. Turoverov, Biochemistry, 2004, 43, 14913–14923 CrossRef CAS PubMed.
- A. Royant, P. Carpentier, J. Ohana, J. McGeehan, B. Paetzold, M. Noirclerc-Savoye, X. Vernede, V. Adam and D. Bourgeois, J. Appl. Crystallogr., 2007, 40, 1105–1112 CrossRef CAS.
- A. C. Croce and G. Bottiroli, Eur. J. Histochem., 2014, 58(4), 2461 CAS.
- H. Schonenbrucher, R. Adhikary, P. Mukherjee, T. A. Casey, M. A. Rasmussen, F. D. Maistrovich, A. N. Hamir, M. E. Kehrli, J. A. Richt and J. W. Petrich, J. Agric. Food Chem., 2008, 56(15), 6220–6226 CrossRef CAS PubMed.
- L. Donaldson and N. Williams, Plants, 2018, 7(1), 10 CrossRef PubMed.
Footnote |
| † Electronic supplementary information (ESI) available: SDS-PAGE electrophoresis of EGFP and details about 3D fluorescence spectra. See DOI: 10.1039/c9ra02567g |
| This journal is © The Royal Society of Chemistry 2019 |