 Open Access Article
Rational design of a polypyrrole-based competent bifunctional magnetic nanocatalyst†
Wael A. Amer a,
Basel Al-saida
 ab and
Mohamad M. Ayad
 *ac
*ac
aChemistry Department, Faculty of Science, Tanta University, Tanta 31527, Egypt
bChemistry Department, Faculty of Science, Al-Balqa Applied University, Al-Salt 19117, Jordan
cInstitute of Basic and Applied Sciences, Egypt-Japan University of Science and Technology, New Borg El-Arab City, Alexandria 21934, Egypt. E-mail: mohamad.ayad@ejust.edu.eg; Fax: +20 3 459 9520; Tel: +20 3 459 9520
First published on 11th June 2019
Abstract
The combination of conducting polymers with semiconductors for the fabrication of organic/inorganic hybrid nanocatalysts is one of the most promising research areas for many applications. In this work, the synthesized nanocomposite combines several advantages such as the photoresponse shift from the UV region toward visible light by narrowing the band gap of the semiconductor, magnetic separation ability and dual applications including the catalytic reduction of p-nitrophenol (PNP) and the photocatalytic degradation of methylene blue (MB) dye. In addition to the core magnetite nanoparticles (NPs), the synthesized nanocomposite contains polypyrrole (PPY) and TiO2 shells that are decorated with silver metal NPs to prevent electron–hole recombination and to enhance the catalytic performance. Indeed, the catalytic PNP reduction experiments reveal that the synthesized nanocomposite exhibits significantly high catalytic activity with a rate constant of 0.1169 min−1. Moreover, the photocatalytic experiments show that the synthesized nanophotocatalyst has a boosting effect toward MB dye degradation under normal daytime visible light irradiation with a rate constant of 6.38 × 10⁻² min−1. The synergetic effect between silver NPs, PPY and TiO2 is thought to play a fundamental role in enhancing the photocatalytic activity.
1. Introduction
Nowadays, catalysis is described as a central field of nanoscience beside its essential role in “Green Chemistry”. Catalysis is divided into two divisions, homogeneous and heterogeneous. Homogeneous catalysts have several advantages such as high selectivity and good yield, but the difficulty of catalyst separation and recovery from the final product are critical challenges and thus heterogeneous catalysts are considered to be more practical for their stability at high temperatures, inexpensive recycling, and their easy removal from the reaction medium.1 A wide range of heterogeneous nanocatalysts were used in environmental applications specifically to reduce/degrade organic compounds.2,3 For example, Au–Pd nanocatalyst was prepared and used for the catalytic reduction of o-nitrophenol. Naked Ni nanocatalyst was synthesized for p-nitrophenol (PNP) reduction, but the problem with this nanocatalyst lies in its aggregation and partial sintering that could result in its deactivation.4Due to such kind of problems, composites of nanomaterials with conducting polymers attracted much attention in the recent decades, and the study of this kind of nanocomposites has becoming one of the most active and promising research areas. Polypyrrole (PPY)-based nanocomposites have a great deal of attention, due to their easy synthesis, high electrical conductivity, high absorption coefficient in the visible light, charge carriers with high mobility, and the good environmental stability.5 On other hand, PPY is infusible, insoluble and exhibits pauper processability. To overcome these problems, PPY composites with metal nanoparticles (NPs) were synthesized with significant strategies. For example, PPY@Ag composite was synthesized via the direct redox reaction between AgNO3 and pyrrole for the reduction of PNP by NaBH4, but 44 minutes were required for the reduction process, and the kinetic reaction rate constant was estimated to be very small (0.011 min−1).6 PPY-coated cotton fabric decorated with silver NPs was synthesized for the catalytic reduction of PNP in which 32 minutes were necessary to complete the reduction process using 1 mg of catalyst and a relatively small kinetic rate constant (0.0371 min−1) was obtained.7 Nowadays, the polymer-based three-component research became an important issue, such as α-Fe2O3/PPY/Ag which was synthesized for the reduction of sodium m-nitrobenzene sulfonate with which 4 mg of the nanocatalyst required a relatively long time to complete the reduction process.8
In addition, PPY composites with different inorganic materials such as TiO2, ZnO, CdS, SnO2, CuO and CeO9–12 were widely synthesized. Among these materials, titanium dioxide is an excellent photocatalyst due to its effectiveness, photostability, availability, reusability and non-toxicity.13 TiO2 shows high photocatalytic activity due to its low band gap ≈ 3.2 eV.14 Furthermore, the coating of TiO2 with PPY could attenuate the agglomeration and show firmer absorbance than bare TiO2.15 PPY-modified TiO2 nanocomposites respond easily toward the visible light as PPY narrows the band gap of TiO2 and thus the band gap energy value for PPY–TiO2 nanocomposites becomes smaller than that of TiO2.16 Wang et al. improved TiO2 properties with PPY via the in situ polymerization of pyrrole hydrochloride employing ferric chloride as an oxidizing agent in the presence of TiO2. The TiO2 aggregations were reduced by PPY modifications, but 450 mg of this nanocatalyst were used for methyl orange degradation under the sun light with a low degradation rate constant (0.0086 min−1).17
The updated research trends involve the incorporation of additional components, such as noble and/or transition metals, in the TiO2/PPY structures. The doping TiO2/PPY structures with silver, palladium and gold attracted much attention due to their high conductivity, excellent catalytic behavior, and the surface plasmon resonance in visible light region in addition to the synergistic effect for narrowing of TiO2 band gap and enhancing the photocatalytic activity.18 Moreover, the interaction between metal NPs and PPY chains is expected to prevent or reduce the leaching of the metal NPs into the solution.19 PPY/TiO2 nanocomposites were used as nanoreactors for loading Pd nanocatalysts towards PNP reduction.20 Silver NPs were extensively used with different substrates due to their significantly optical properties, unique electrical and antibacterial properties.21 Kuo et al. prepared Ag/TiO2 films on glass substrates by radiofrequency sputtering and a good performance was obtained for dye degradation but the problem lies in the complicated synthetic procedures.22
Out of our knowledge, few research deals with four components-based nanocatalysts. Additionally, most of the current research focuses on the design of nanocatalysts with multifunctional behavior. In the present study, we described procedures for the synthesis of a low cost and efficient magnetic nanocatalyst composed of four-components of Ag-PPY/TiO2@Fe3O4 (MTPS). The synthesized magnetic nanocomposite acts as a highly efficient magnetic nanocatalyst with a synergetic effect between all its components: PPY, TiO2, magnetite (Fe3O4) and Ag NPs. Magnetite seeds act as a core to facilitate the separation process of the catalyst from the solution by applying an external magnetic field.23 The magnetite incorporation in other matrices can prevent the air oxidation and the agglomeration of magnetite particles.24 Due to their excellent surface energy and magnetic properties, Fe3O4 NPs are thermodynamically unstable and prone to agglomeration. Hence, the modification or the formation of a coating on the magnetic NPs could serve as a protective layer against oxidation and some extreme chemical environments.25 In our work, the silane agents APTES was used for the direct surface modification of Fe3O4 NPs to obtain high density surface of –NH2 functional groups that facilitate the next step of TiO2 functionalization, which was performed in alkaline conditions using titanium n-butoxide (TBOT) as a precursor. Afterward, Fe3O4@TiO2/PPY nanocomposite was decorated with Ag NPs, which are relatively the most suitable noble metal for industrial applications due to its easy preparation and low cost. Subsequently, the MTPS nanocomposite was fully characterized by X-ray diffraction (XRD), Fourier transform infrared (FTIR) spectroscopy, scanning electron microscopy (SEM), energy dispersive X-ray (EDX), and transmission electron microscopy (TEM). The catalytic efficiency of MTPS nanocomposite was evaluated toward the reduction of PNP as a model of the most hazardous and toxic nitroaromatic compounds. Furthermore, the photocatalytic activity of the synthesized MTPS nanocomposite toward the degradation of methylene blue (MB) dye was studied as well. All reactions were carried out under the day visible light and at room temperature.
2. Experimental
2.1. Chemicals
Pyrrole (Aldrich) was kept below 5 °C in the absence of light. Anhydrous FeCl3 98% (Aldrich), 3-triethoxysilylpropylamine (APTES, 99%, Aldrich), FeCl2·4H2O (Aldrich), titanium n-butoxide (Sigma Aldrich, TBOT), NaOH pellets (LobaChemie, India) were used as received. NH4OH solution (25 wt%), silver nitrate (BDH, UK), sodium boron hydride (NaBH4) (Johnson Matthey, UK), 4-nitrophenol (PNP) (Sigma Aldrich), and methylene blue (MB) were used without further purification.2.2. Synthesis of magnetite (Fe3O4)
Firstly, FeCl3·6H2O (4 mL, 2 M) and FeCl2·4H2O (2 mL, 2 M) were mixed and stirred for 45 min at 30 °C. The molar ratio of Fe(III)/Fe(II) was kept 2. Under N2 gas atmosphere, ammonia solution (100 mL, 1 M) was added dropwise to the previous solution and pH of the mixture was adjusted to 10. The solution was stirred for about 1 h until black Fe3O4 particles appeared. The product was filtrated and rinsed with distilled water and methanol until neutral filtrate was obtained. The produced Fe3O4 NPs were eventually dried at 60 °C for 24 h.26 The following reaction describes the formation of Fe3O4 NPs.27| Fe(aq)+2 + 2Fe(aq)+3 + 8OH(aq)− → Fe3O4(S) + 4H2O(l) |
2.3. Preparation of functionalized magnetite (Fe3O4–NH2) NPs
To a magnetite ethanolic suspension (5 mg mL−1), (3-aminopropyl)triethoxysilane (APTES) (0.8 mL) was added and the mixture was stirred under N2 atmosphere for 4 h. Fe3O4–NH2 NPs were collected magnetically and rinsed with ethanol and deionized water three times.252.4. Synthesis of Fe3O4@TiO2 nanospheres
Fe3O4–NH2 NPs were dispersed in a mixed solvent of 250 mL ethanol and 90 mL acetonitrile. The dispersion was sonicated for 15 min and 1.5 mL of NH4OH solution (25 wt%) was added. Next, the reaction mixture was kept under mechanical stirring for 30 min and 3 mL of TBOT (previously dissolved in 20 mL of ethanol) was added under mechanical stirring at 30 °C for 1.5 h to get Fe3O4@TiO2 core/shell nanospheres. The product was magnetically collected, separated and washed with absolute ethanol three times.282.5. Synthesis of Fe3O4@TiO2/PPY nanocomposite
0.03 g of Fe3O4@TiO2 was dispersed in 200 mL of 1 M HCl and sonicated for 30 min. Pyrrole (0.756 mL) was added dropwise with vigorous stirring to the previous suspension for 30 min. Subsequently, FeCl3 (4.33 g in 27 mL deionized water) was quickly added to polymerize the adsorbed pyrrole on Fe3O4@TiO2. The reaction was kept for 24 h at 5 °C and the product was collected with a magnet and rinsed with water and ethanol three times then the composite was dried for 15 h at 60 °C.292.6. Synthesis of MTPS nanocomposite
0.2 g of Fe3O4@TiO2/PPY nanocomposite was dispersed in 200 mL NH4OH (0.1 M) and stirred for 4 h. After filtration, the nanocomposite was added in another 200 mL of NH4OH (0.1 M) for 4 h and filtered. The product was collected, rinsed with ethanol and distilled water three times, and dried at 60 °C for 24 h. The final product was dispersed in AgNO3 solution (0.005 M) and stirred for 8 h and then the resulting nanocomposite was collected magnetically.30 Scheme 1 shows the synthesis procedures of MTPS nanocomposite.2.7. Catalytic activity of MTPS nanocomposite
To evaluate the catalytic efficiency of MTPS nanocomposite, the reduction of PNP to p-aminophenol (PAP) using NaBH4 as a reductant was selected as a model reaction. The catalytic reduction reaction was executed in a standard quartz cuvette, 2.5 mL of 7 × 10⁻⁵ M of alkaline PNP solution was mixed with 1 mg of the nanocatalyst, and the absorption spectra were recorded. Afterward, 0.5 mL of freshly prepared NaBH4 solution (10 mg mL−1) was added to the previous solution, then the reduction progress was monitored via the measurement of the absorption spectra over time.312.8. Photocatalytic activity of MTPS nanocomposite
The photocatalytic activity of MTPS nanocomposite was evaluated by studying the degradation of MB dye solution as a model reaction under the normal day visible light at room temperature. 40 mg of the nanocatalyst was dispersed into 100 mL aqueous MB solution (4 mg L−1). Before visible light irradiation, the suspension of MB dye and the nanocatalyst was stirred for 15 min in the dark for establishing equilibrium between adsorption and desorption of MB dye on the nanocatalyst's surface. The absorption peak of MB at 664 nm was used for following the photocatalytic degradation process.322.9. Characterization
X-ray powder diffraction patterns (XRD) of the products were obtained on a Japan Rigaku D Max-γA rotation anode X-ray diffractometer equipped with graphite monochromatized Cu Kα radiation (λ = 1.54178 Å). The bulk (as well as the elemental mapping) and the surface morphology of the MTPS nanocomposite were examined using a transmission electron microscope (TEM) (JEM-2100F) at 200 kV and a scanning electron microscope (SEM) (Hitachi S4800) with 5 kV accelerating voltage, respectively. The magnetic properties were investigated using a vibrating sample magnetometer (VSM). A Bruker, Tensor 27 FT-IR spectrophotometer was used to measure the Fourier transform infrared spectra (FT-IR) in a frequency range of 4000–400 cm−1. A UV spectrometer, UVD-2960 (Labomed Inc.) was exploited for recording the UV-vis absorption spectra. The UV-vis diffuse reflectance spectra (DRS) were recorded using Shimadzu UV-2450 spectrophotometer.3. Results and discussion
X-ray diffraction (XRD) enables the identification of the phase and crystallinity of the synthesized MTPS nanocomposite. Fig. 1A represents the diffraction patterns of Fe3O4 at 2θ equivalent to 30.2°, 35.74°, 43.12°, 53.51°, 57.19° and 62.78° that can be indexed to (hkl) reflection peaks of [220], [311], [400], [422], [511] and [440], respectively for face centered cubic (FCC) phase of magnetite.33 After the coating with a TiO2 layer, characteristic diffraction peaks appeared at 25.3° and 37.9° that matched the standard anatase TiO2 crystal planes of [101] and [004], respectively (JCPDS 21-1272). The other diffraction peaks that are characteristic to the crystal planes of the standard anatase TiO2 were fused with the peaks of magnetite. In Fig. 1C, a broad peak around 25° is associated with the presence of amorphous PPY34 indicating that amorphous PPY exists on the surface of TiO2,35 while the peaks ascribed to the [111], [200], [220] and [311] planes of FCC of Ag phase appeared at 2θ of 38°, 44°, 65° and 77° (JCPDS card no. 040783).36 The peak of Fe3O4 located at 2θ ∼ 35.7° was found to be merged with the [111] anatase phase of Ag during the formation of MTPS nanocomposite. Moreover, the presence of a new peak at 2θ ∼ 77° corresponds to (311) anatase phase of Ag, which confirms the presence of Ag NPs and hence the formation of MTPS nanocomposite is confirmed.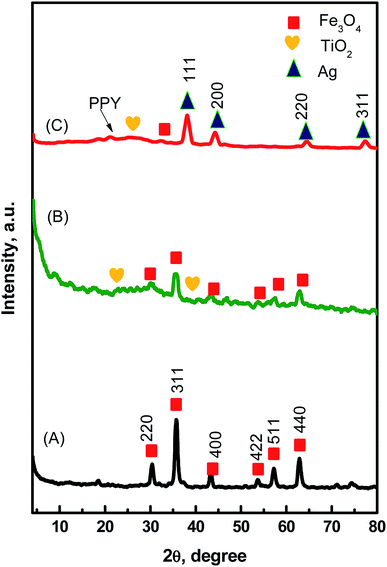 | ||
| Fig. 1 XRD patterns of the prepared Fe3O4 NPs (A), Fe3O4@TiO2 nanospheres (B), and MTPS nanocomposite (C). | ||
The structural information and chemical components of MTPS nanocomposite were identified by the FTIR spectra (Fig. 2). As shown in (Fig. 2A), the characteristic peak of Fe3O4 at 589 cm−1 arose from the stretching vibration of Fe–O bond.37 The peaks at 3409 and 1618 cm−1 are attributed to the –NH2 group bending and primary amine vibration.38 In Fig. 2B, the peak at 1364 cm−1 is attributed to the stretching vibration of Ti–O, while the broad band in the range 500–700 cm−1 resulted from the overlapping of Ti–O and Fe–O peaks.39 For Fe3O4@TiO2/PPY nanocomposite (Fig. 2C), the peak at 3429 cm−1 is due to the vibration of N–H, and the peaks at 1349 and 1614 cm−1 are induced by C–N and C![[double bond, length as m-dash]](https://www.rsc.org/images/entities/char_e001.gif) C on the pyrrole ring, respectively.40 In Fig. 2C, it was observed that the intensity of the peak at 400–700 cm−1 is lower than that in the spectrum of Fe3O4@TiO2, which may be ascribed to the wrapping of TiO2 with PPY.29 Upon anchoring Ag NPs, the peak at 1614 cm−1 of C
C on the pyrrole ring, respectively.40 In Fig. 2C, it was observed that the intensity of the peak at 400–700 cm−1 is lower than that in the spectrum of Fe3O4@TiO2, which may be ascribed to the wrapping of TiO2 with PPY.29 Upon anchoring Ag NPs, the peak at 1614 cm−1 of C![[double bond, length as m-dash]](https://www.rsc.org/images/entities/char_e001.gif) C shown little shift, with decreasing intensity, to 1545 cm−1 due to silver coordination with the nitrogen atoms of PPY (Fig. 2D).41,42 Furthermore, a strong peak at 1383 cm−1 was clearly observed due to the counter nitrate anion (NO3−) stretching,43 and the interactions between Ag NPs and PPY interface.44 This peak was much stronger than in Fe3O4@TiO2/PPY nanocomposite, which can be attributed to the amplified contribution of the charge-transfer effect between the PPY chains and silver NPs.45
C shown little shift, with decreasing intensity, to 1545 cm−1 due to silver coordination with the nitrogen atoms of PPY (Fig. 2D).41,42 Furthermore, a strong peak at 1383 cm−1 was clearly observed due to the counter nitrate anion (NO3−) stretching,43 and the interactions between Ag NPs and PPY interface.44 This peak was much stronger than in Fe3O4@TiO2/PPY nanocomposite, which can be attributed to the amplified contribution of the charge-transfer effect between the PPY chains and silver NPs.45
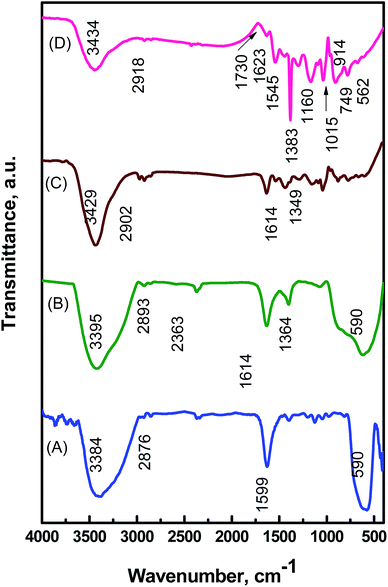 | ||
| Fig. 2 FTIR spectra of the Fe3O4 NPs (A), and Fe3O4@TiO2 nanospheres (B), Fe3O4@TiO2/PPY nanocomposite (C), and MTPS nanocomposite (D). | ||
The bulk morphology of the synthesized nanocomposites was examined by measuring their TEM images. Spherical Fe3O4 NPs in a diameter of ∼10 nm were observed in Fig. 3A with uniform distribution without any serious aggregation. After coating with TiO2 (Fig. 3B), a layer of TiO2 (∼30 nm thickness) was formed, and the TiO2 layer was dispersed uniformly. In addition, the dense array of Fe3O4@TiO2/PPY is shown in Fig. 3C. The size of Fe3O4@TiO2/PPY nanocomposite appears to be greater than that of the Fe3O4@TiO2 nanospheres that is an evidence for the successful deposition of PPY onto Fe3O4@TiO2 nanospheres as a matrix. For Fe3O4@TiO2/PPY nanocomposite, the TiO2/PPY shells are about 60 nm in thickness and the average size of Fe3O4@TiO2/PPY nanostructures is about 80 nm. Hence, the presence of PPY in the composite is able to reduce the TiO2 NPs agglomeration. However, the TEM image of MTPS nanocomposite is presented in Fig. 3D that shows uniform distribution of Ag NPs without serious aggregations, and some black dots clearly observed that Ag NPs deposited on the polymer matrix. This confirms the successful synthesis of MTPS hybrid material.
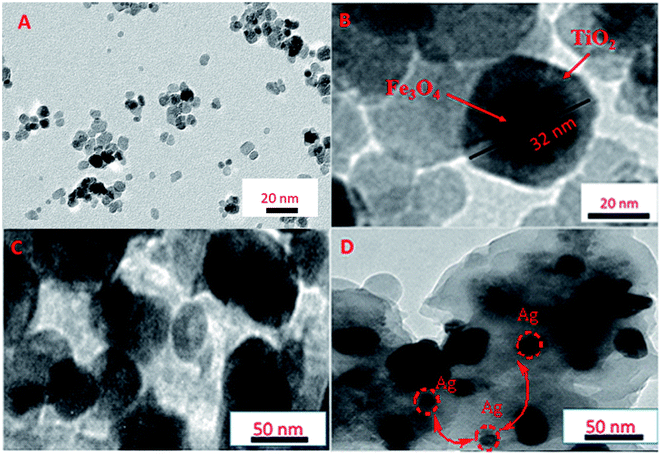 | ||
| Fig. 3 TEM images of (A) Fe3O4 NPs, (B) Fe3O4@TiO2 nanospheres, (C) Fe3O4@TiO2/PPY nanocomposite, and (D) MTPS nanocomposite. | ||
The SEM image of MTPS nanocomposite is presented in Fig. 4A and it exhibits nanospheres with a mean diameter of 300 nm as a stacked structure, and the denser array of MTPS nanocomposite can be observed clearly. To identify the chemical composition, the EDX spectra of MTPS nanocomposite was measured (Fig. 4 B) that showed the existence of titanium, oxygen, iron, carbon, silver and nitrogen. A low percentage of iron is observed in the surface of MTPS nanocomposite, which indicates that the largest percentage of iron is found in the core. The inclusion of all elements in MTPS nanocomposite was further investigated by measuring the elemental mapping (Fig. S1, ESI†). The results confirm the existence of C, O, N, Fe, Ti and Ag with a good distribution through the synthesized MTPS nanocomposite.
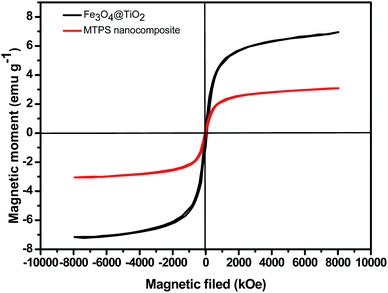
The interior of magnetic Fe3O4 particles could satisfy the easy separation and achieve the regeneration of the catalyst after being used.46 The VSM was carried out and the magnetization curves of the synthesized nanocomposites are shown in Fig. 5. The saturation magnetization of magnetite decreased obviously after coating with TiO2 and PPY. However, the magnetism of catalyst is still enough to be used for the magnetic separation by an external magnetic field. Saturation mass magnetization (Ms) of the Fe3O4@TiO2 and MTPS nanocomposite observed from Fig. 5 are 6.9 and 3.85 emu g−1, respectively. The magnetization of MTPS nanocomposite is enough for the easy recovery from the solution.
The optical properties of Fe3O4, Fe3O4@TiO2 and MTPS nanocomposite were investigated by the UV-vis diffuse reflectance spectroscopy in the wavelength range of 200–800 nm. As revealed from Fig. S2(A),† MTPS nanocomposite displays higher light absorption in the visible spectrum region. This high absorption can be assigned to the photosensitization of PPY for trapping a huge number of visible light photons and to the surface plasmon resonance of electrons present in the Ag NPs induced by visible light.18 This result indicates that incorporation of TiO2, PPY and Ag with magnetite can extend the TiO2 spectral response range to the visible light region. This provides the ability for applying MTPS nanocomposite to the solar energy catalytic photodegradation of organic pollutants with a high photocatalytic activity. Fig. S2(A)† shows the UV-vis DRS of the as-synthesized nanomaterials which was then used to calculate the band gaps via using the following Kubelka–Munk equation.
| F(R) = K/S | (1) |
PNP reduction reaction to PAP is a model reaction for testing the catalytic activity of MTPS nanocomposite using NaBH4 as a reducing agent and a hydrogen source for the reduction reaction.
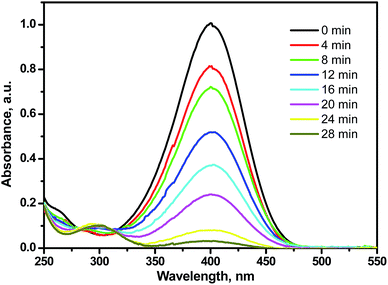
No change in the PNP color was observed in its uncatalyzed reduction reaction. A catalyst, such as MTPS nanocomposite, is required for enhancing the electrons' transfer from the electron donor (BH4−) to the electron acceptor (PNP) that led to end the reduction reaction in 28 min. The UV-vis spectroscopy technique was used for monitoring the catalyzed reduction reaction of PNP. Under alkaline conditions, PNP is characterized with an absorption peak at 400 nm and the reduction to PAP occurs with changing the PNP intense yellow color into colorless PAP solution with growing of another peak at 310 nm that is characteristic to PAP as shown in Fig. 6. After 48 min, the reduction reaction finished using 1 mg of the MTPS nanocatalyst. Pseudo first order assumption was applied to calculate the kinetic rate of this reduction reaction because of the high concentration of NaBH4 relative to PNP. The linear relation between −ln![[thin space (1/6-em)]](https://www.rsc.org/images/entities/char_2009.gif) At/Ao vs. time is shown in Fig. S3A† and the rate constant (k) of the reduction reaction was calculated to be 0.1168 min−1. This rate constant is high as compared to previous articles, as shown in Table 1. Fig. S3B† shows clearly the decrease of the characteristic absorbance of PNP with time.
At/Ao vs. time is shown in Fig. S3A† and the rate constant (k) of the reduction reaction was calculated to be 0.1168 min−1. This rate constant is high as compared to previous articles, as shown in Table 1. Fig. S3B† shows clearly the decrease of the characteristic absorbance of PNP with time.
| Substrate | Dose | k (×10−3 s−1) | Ref. |
|---|---|---|---|
| a Bulk poly(2-acrylamido-2-methyl-1-propansulfonic acid).b p(2-Acrylamido-2-methyl-1-propansulfonic acid)-Cu composites.c Ag NPs/carbon spheres.d Human-hair-supported noble metal (Ag).e Ag NPs within the uniform pore channels of mesoporous silica.f Conjugated microporous polymer (CMP).g Gold NPs supported on nano active™ MgO plus. | |||
| p(AMPS)–Co compositea | 50 mg | 2.0 | 48 |
| Ag–PPY–graphene oxide | 1.2 mg | 0.288 | 49 |
| Fe3O4@NH2-mesoporous silica@PPY/Pd | 10 mg | 0.06 | 50 |
| (Ag NPs) on natural egg shell membrane (ESM) | 15 mg | 2.90 | 51 |
| Fe3O4@SiO2–Ag | 1 g | 7.67 | 52 |
| p(AMPS)–Cub | 10 | 1.72 | 53 |
| Ag/TiO2@PPY | 20 mg | 0.005 | 54 |
| Ag-NPs/Cc | 1 mg | 1.69 | 55 |
| Ag/HHPd | 1 mg | 0.50 | 56 |
| Ag10@SBA-15e | 0.9 mg | 0.127 | 57 |
| Fe3O4@C/Pd | 2 mg | 3.25 | 58 |
| Ag0@CMPf | 7.4 mg | 1.36 | 59 |
| Ni NPs | 90 mg | 2.7 | 60 |
| NAP-Mg–Au(0)g | 15 mg | 7.60 | 61 |
| Ag NPs (Cu precursor = 0 mg) | 2 mg | 0.47 | 58 |
| Cu/Ag NPs (Cu precursor = 9 mg) | 2 mg | 2.10 | 58 |
| MTPS nanocomposite | 1 mg | 2.00 | This work |
To further investigate the influence of catalyst amount, 2 mg and 3 mg of the synthesized MTPS nanocatalyst was used. Only 12 min and 6 min are needed to complete PNP reduction reaction using 2 mg and 3 mg of MTPS nanocatalyst as shown in Fig. S4A and B,† respectively.
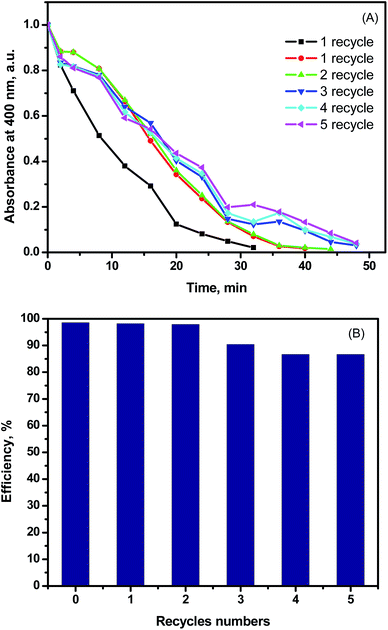
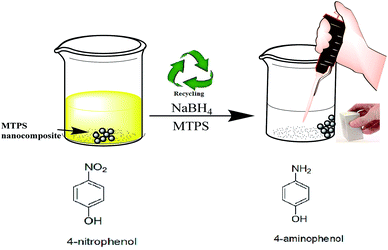
Another important property for catalyst is its stability over many catalytic cycles. Upon repeating the catalysis test after the magnetic separation of the nanocatalyst as shown in Fig. 7(A and B), 85% of catalysis efficiency was achieved after five times of magnetic separation and catalyst reuse was obtained. The recovery and the separation strategy of the synthesized MTPS nanocatalyst is expressed by Fig. 8.
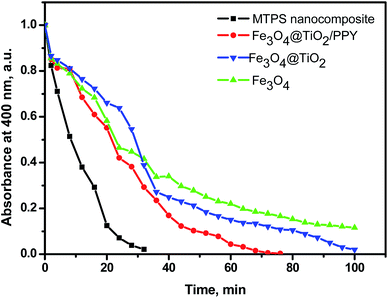
Separately for comparing purpose, the catalytic activities of Fe3O4 NPs, Fe3O4@TiO2 nanospheres, Fe3O4@TiO2/PPY, and MTPS nanocomposites were examined using the same conditions of MTPS nanocatalyst (Fig. 9). The obtained results show that the PNP reduction by Fe3O4@TiO2 a relatively long time, due to the low response to the visible light. After the incorporation of PPY, the Fe3O4@TiO2/PPY nanocomposite responds easily toward the visible light and the percentage of PNP removal is about 92% PNP in a relatively short time. However, in the existence of noble metal (silver) NPs, the catalytic properties of the MTPS nanocomposite was enhanced, and 100% PNP removed in approximately 28 minutes, which confirmed that MTPS nanocomposite has higher absorption in the visible light region than the other nanocatalyst. These results can be attributed to the surface plasmon resonance of silver in the visible light region, and to the synergistic effect among all components that enhanced the photocatalytic activity.
The photocatalytic activity of as-synthesized MTPS nanocomposite was studied toward MB degradation as a model reaction. The adsorption of MB on the surface of the synthesized MTPS photocatalyst was first investigated by following the degradation of MB after in dark to prevent the photodegradation process. Under the dark condition and after the addition of MTPS nanocomposite to MB dye solution, the absorbance of the MB solution was followed at different intervals of time. As shown as Fig. S5,† poor MB degradation in the dark condition was found as only 30% of MB was removed during 1.5 h, which can be attributed to the adsorption of MB on the surface of MTPS nanocomposite.
Bare TiO2 can absorb only UV light while PPY can absorb both UV and visible lights and hence the absorption is expected to be shifted to the visible region upon the modification of TiO2 with PPY.18 Therefore, the conjunction between TiO2 and PPY, in the MPTS nanocomposite should exposes the advantages of both of them and thus, PPY can extend the TiO2 photoresponse to the visible region (400–800 nm). Under the normal day light, 40 mg of MPTS nanophotocatalyst was added to 100 mL MB solution (4 mg L−1) for evaluation of the photocatalytic performance. As shown in Fig. 10, the MB dye degraded at significant rate in the presence of MTPS nanocomposite as a photocatalyst, temporal absorbance changes in the MB spectra was observed in the first 10 minutes with more than 60% of MB removal, which indicates a rapid degradation rate of MB dye. Furthermore, around 90% of MB was degraded in approximately less than one hour.
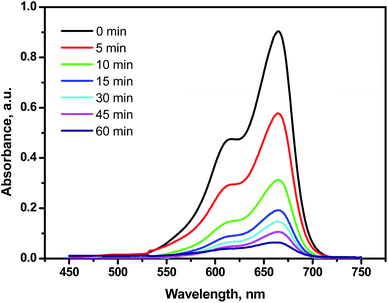 | ||
| Fig. 10 Time-resolved photocatalytic spectra of MB dye (4 mg L−1) upon the treatment with 0.04 g of MTPS nanophotocatalyst under the normal day light. | ||
The robust photocatalytic activity exhibited by the MPTS nanophotocatalyst could be attributed to the MB photosensitization and the punchy synergistic effect of TiO2 and PPY. The coupling of PPY with TiO2 was found to induce an interesting charge transfer by which the attached PPY particles on TiO2 surface lead to driving the photogenerated electrons to depart away from the TiO2 and transferring the charge between the coupled semiconductors.62 In addition, the photocatalytic reaction was enhanced by increasing the reactive sites in the presence of PPY NPs.63 In addition to its role as an electron donor after the visible light irradiation, PPY worked as a hole acceptor.64 These interesting characteristics of PPY with TiO2 make them an ideal material to reach enhanced charge separation efficiency in the field of photocatalysis. In addition to the above inimitability characteristics, silver NPs possessed enhanced photocatalytic activity due to its surface plasmon resonance and hence, it can strongly absorb visible light, which lead to maximizing its ability to activate the reactive sites by working as electron traps.65
The photodegradation of MB was followed by tracking the concentration changes (C/C0) as a function of the visible light illumination time. The dye photodegradation efficiencies can be calculated from the equation:
| Efficiency (%) = (C0 − C)/C0 × 100% | (2) |
As shown in Fig. S6,† the photodegradation process was found to follow the pseudo first-order kinetics by linear transform66 of the equation, ln(qo/qt) = kt, where qo is the adsorption equilibrium concentration of MB, qt is the concentration of MB at time t, and k is the rate constant, which was estimated to be 6.38 × 10⁻² min−1 with a high correlation coefficient (R2 = 0.98) using only 40 mg the synthesized MTPS nanophotocatalyst after irradiation for 1 h.
The photocatalytic process includes a primary reaction step in which MB dye was firstly adsorbed onto the surface of MTPS nanophotocatalyst at PPY layer, while a secondary step is initiated by illumination the MTPS nanophotocatalyst with visible light producing electrons and holes, which generate reactive oxygen molecules. TiO2 consist of valence band (VB) and conduction band (CB) with band gap energy of 3.2 eV. PPY is an optimal conjugated polymer without reached π-conjugated electron systems and its band gap is 1.30–2.32 eV67 so it is considered as a good hole transporter and an efficient electron donor under visible-light excitation. On the other hand, Ag acts as an electron trapper and can prevent the electron–hole pairs from recombination process and subsequently permitting a grander proportion of hydroxyl radicals. When the MTPS nanophotocatalyst is illuminated with the visible light, PPY absorbs light to induce π → π* transition, the excited electrons are transported to the π* orbital, which easily injected into the CB of TiO2. Afterward, the electrons are transferred to the surface, then react with the adsorbed H2O and O2 to yield hydroxyl and superoxide radicals.66 In the meantime, the electron–hole pairs direct recombination would be potently inhibited, because excited electrons are injected into CB of TiO2, which provide holes on PPY.17 These electrons react with O2 generating ·O2 and holes that can react with OH− or H2O to produce ·OH that in turn reacts with MB dye in a degradation procedures as shown in Scheme 2.68 A suggested photodegradation mechanism of MB dye by using MTPS nanocomposite as a nanophotocatalyst is shown in Scheme 3.5
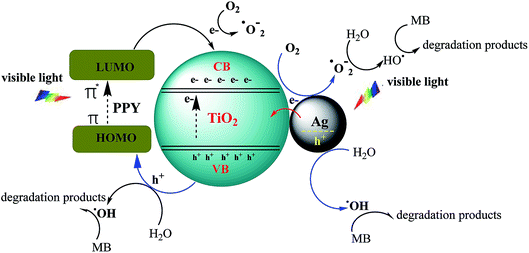 | ||
| Scheme 2 Mechanism of MTPS nanocomposite to enhance the photocatalytic activity under visible light. | ||
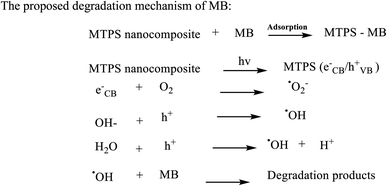 | ||
| Scheme 3 A proposed mechanism for MB dye degradation using MTPS nanocomposite as a nanophotocatalyst under the normal day visible light. | ||
MTPS nanocomposite was found to exhibit an excellent photocatalytic degradation behavior toward MB dye, and the apparent first-order rate constant was higher than many other reported substrates, with an optimal dose and irradiation time as shown in Table 2. After comparing the catalyst dose, irradiation time, the used light, and the rate constant in Table 2, it can be found clearly that our synthesized performs the best.
| Photocatalyst | Dose | Irradiation time (min) | k (×10−3 min−1) | Irradiation type | Ref. |
|---|---|---|---|---|---|
| a Molecular imprinting technique.b Reduced graphene oxide/anatase TiO2 composite. | |||||
| TiO2/SiO2/Ni–Cu–Zn | 400 mg | 360 | 3.18 | Visible light | 69 |
| Fe2O3/PPY | 8 mg | 120 | 5 | UV light | 70 |
| Fe2O3/PPY/Ag | 8 mg | 120 | 8 | UV light | 70 |
| Fe3O4@Ag@PPY | 2 mg | 120 | 1 | UV light | 71 |
| Fe3O4@PANI/TiO2 | 30 mg | 140 | 19.7 | Visible light | 72 |
| Flower-like TiO2/PANI | 50 mg | 140 | 0.01 | UV light | 73 |
| PPY/TiO2 | 150 mg | 120 | 4 | Visible light | 74 |
| PPY–PANI/TiO2 | 150 mg | 120 | 8 | Visible light | 74 |
| aMIP-PPY/TiO2 | 20 mg | 120 | 15.04 | Visible light | 5 |
| Ag/Ag2O/TiO2@PPY | 100 mg | 100 | 3 | UV light | 54 |
| TiO2–WO3 | 30 mg | 240 | 27 | Visible light | 75 |
| Double-shelled TiO2@WO3/Au | 30 mg | 240 | 52 | Visible light | 75 |
| TiO2–Al | 2 g L−1 | 180 | 14.2 | Visible light | 76 |
| RGO/TiO2b | 0.5 g L−1 | 60 | 55 | UVC | 77 |
| Bi-doped TiO2 nano-composites | 1 g L−1 | 300 | 5.31 | Visible light | 78 |
| BP-Ag/TiO2 | 45 mg | 85 | 29.3 | Visible light | 79 |
| TiO2–0.5% Hf–1% N | 20 mg | 120 | 13 | Visible light | 80 |
| MTPS nanocomposite | 40 mg | 60 | 63.8 | Visible light | This work |
4. Conclusion
In summary, a simple, low coast, and efficient method was presented to synthesize bifunctional MTPS nanocomposite with an enhanced catalytic and photocatalytic activity accompanied with good recyclability and magnetic performance. The structure was fabricated by depositing a shell of TiO2 onto the surface of Fe3O4 magnetic core followed by coating with a layer of PPY and its decoration with silver NPs. The morphology investigation showed the inclusion of the main elements in the synthesized MTPS nanocomposite. A good catalytic conversion of PNP to PAP employing MTPS as a nanocatalyst were achieved with a rate constant of 11.682 × 10⁻² min−1. The catalytic activities of Fe3O4 NPs, Fe3O4@TiO2, Fe3O4@TiO2/PPY, and MTPS nanocomposites catalytic activities were compared where, Fe3O4 and Fe3O4@TiO2 nanocatalysts possessed the lowest rate toward PNP reduction while the coexistence of PPY and Ag NPs led to the maximum PNP reduction rate and 100% PNP removed in approximately 28 minutes using MTPS nanocatalyst due to the surface plasmon resonance in visible light region of silver and the synergetic effect of PPY and silver for narrowing of TiO2 band gap. Moreover, the as-synthesized MTPS nanocomposite was found to possess a high photocatalytic activity toward MB degradation with a rate constant of 63.8 × 10⁻³ min−1. The dual activity of the synthesized nanocatalyst is the novel point in this work due to its unique structure and properties that paves the way toward a superior catalytic and photocatalytic behavior under visible light. A small loss of MTPS nanocomposite was found by the recycling test, so that the efficiency was more than 85% after five cycles.Conflicts of interest
The authors declare that they have no conflict of interest.Acknowledgements
The authors thank Faculty of Science, Tanta University and the Egyptian Academy of Scientific Research and Technology for their financial support.References
- D. Astruc, F. Lu and J. R. Aranzaes, Angew. Chem., Int. Ed., 2005, 44, 7852–7872 CrossRef CAS PubMed.
- J. Li, X. a. Dong, G. Zhang, W. Cui, W. Cen, Z. Wu, S. Lee and F. Dong, J. Mater. Chem. A, 2019, 7, 3366–3374 RSC.
- X. Li, W. Zhang, W. Cui, J. Li, Y. Sun, G. Jiang, H. Huang, Y. Zhang and F. Dong, Chem. Eng. J., 2019, 370, 1366–1375 CrossRef CAS.
- Y. Du, H. Chen, R. Chen and N. Xu, Appl. Catal., A, 2004, 277, 259–264 CrossRef CAS.
- F. Deng, Y. Li, X. Luo, L. Yang and X. Tu, Colloids Surf., A, 2012, 395, 183–189 CrossRef CAS.
- L. Zhang, X. Liu, Y. Wang and S. Xing, J. Alloys Compd., 2017, 709, 431–437 CrossRef CAS.
- M. M. Ayad, W. A. Amer, S. Zaghlol, N. Maráková and J. Stejskal, Cellulose, 2018, 25, 7393–7407 CrossRef CAS.
- X. Zhang, W.-x. Zhi, B. Yan and X.-x. Xu, Powder Technol., 2012, 221, 177–182 CrossRef CAS.
- S. Bagheri, A. TermehYousefi and T.-O. Do, Catal. Sci. Technol., 2017, 7, 4548–4569 RSC.
- S. Sakthivel, S.-U. Geissen, D. Bahnemann, V. Murugesan and A. Vogelpohl, J. Photochem. Photobiol., A, 2002, 148, 283–293 CrossRef CAS.
- F. S. Sangsefidi, M. Salavati-Niasari, H. Khojasteh and M. Shabani-Nooshabadi, Int. J. Hydrogen Energy, 2017, 42, 14608–14620 CrossRef CAS.
- D. Toloman, O. Pana, M. Stefan, A. Popa, C. Leostean, S. Macavei, D. Silipas, I. Perhaita, M. D. Lazar and L. Barbu-Tudoran, J. Colloid Interface Sci., 2019, 542, 296–307 CrossRef CAS PubMed.
- I. Ali, M. Suhail, Z. A. Alothman and A. Alwarthan, RSC Adv., 2018, 8, 30125–30147 RSC.
- L. Han, B. Su, G. Liu, Z. Ma and X. An, Mol. Catal., 2018, 456, 96–101 CrossRef CAS.
- Q. Luo, X. Li, D. Wang, Y. Wang and J. An, J. Mater. Sci., 2011, 46, 1646–1654 CrossRef CAS.
- R. J Ramirez, C. AP Arellano, J. C Varia and S. S Martinez, Curr. Org. Chem., 2015, 19, 540–555 CrossRef.
- D. Wang, Y. Wang, X. Li, Q. Luo, J. An and J. Yue, Catal. Commun., 2008, 9, 1162–1166 CrossRef CAS.
- Y. Yang, J. Wen, J. Wei, R. Xiong, J. Shi and C. Pan, ACS Appl. Mater. Interfaces, 2013, 5, 6201–6207 CrossRef CAS PubMed.
- B. Naik, V. Prasad and N. N. Ghosh, Powder Technol., 2010, 199, 197–201 CrossRef CAS.
- X. Lu, X. Bian, G. Nie, C. Zhang, C. Wang and Y. Wei, J. Mater. Chem., 2012, 22, 12723–12730 RSC.
- E. Chen, H. Su, W. Zhang and T. Tan, Powder Technol., 2011, 212, 166–172 CrossRef CAS.
- D.-H. Kuo, W.-T. Hsu and Y.-Y. Yang, Appl. Catal., B, 2016, 184, 191–200 CrossRef CAS.
- P. Zhang, Y. Wang, Y. Zhou, H. Zhang, X. Wei, W. Sun, S. Meng and L. Han, Mol. Catal., 2019, 465, 24–32 CrossRef CAS.
- D. Maity and D. Agrawal, J. Magn. Magn. Mater., 2007, 308, 46–55 CrossRef CAS.
- H. Quanguo, Z. Lei, W. Wei, H. Rong and H. Jingke, Sens. Mater., 2010, 22, 285–295 Search PubMed.
- Y. Deng, Y. Cai, Z. Sun, J. Liu, C. Liu, J. Wei, W. Li, C. Liu, Y. Wang and D. Zhao, J. Am. Chem. Soc., 2010, 132, 8466–8473 CrossRef CAS.
- P. S. S. A. Kulkarni, K. P. Prakash and K. K. Kiran, Ceram. Int., 2014, 40, 1945–1949 CrossRef.
- W. Hu, B. Liu, Q. Wang, Y. Liu, Y. Liu, P. Jing, S. Yu, L. Liu and J. Zhang, Chem. Commun., 2013, 49, 7596–7598 RSC.
- J. Feng, N. Sun, D. Wu, H. Yang, H. Xu and W. Yan, J. Polym. Environ., 2017, 25, 781–791 CrossRef CAS.
- M. M. Ayad and E. Zaki, Appl. Surf. Sci., 2009, 256, 787–791 CrossRef CAS.
- M. M. Ayad, W. A. Amer, M. G. Kotp, I. M. Minisy, A. F. Rehab, D. Kopecký and P. Fitl, RSC Adv., 2017, 7, 18553–18560 RSC.
- Z. Zhu, X. Tang, C. Ma, M. Song, N. Gao, Y. Wang, P. Huo, Z. Lu and Y. Yan, Appl. Surf. Sci., 2016, 387, 366–374 CrossRef CAS.
- M. M. Ayad, W. A. Amer and M. G. Kotp, Mol. Catal., 2017, 439, 72–80 CrossRef CAS.
- A. Ehsani, M. Mahjani, M. Jafarian and A. Naeemy, Electrochim. Acta, 2012, 71, 128–133 CrossRef CAS.
- J.-G. Wang, B. Wei and F. Kang, RSC Adv., 2014, 4, 199–202 RSC.
- Y. Zhao, C. Tao, G. Xiao, G. Wei, L. Li, C. Liu and H. Su, Nanoscale, 2016, 8, 5313–5326 RSC.
- Y. Wang, B. Zou, T. Gao, X. Wu, S. Lou and S. Zhou, J. Mater. Chem., 2012, 22, 9034–9040 RSC.
- L. Chen, L. Wu, F. Liu, X. Qi, Y. Ge and S. Shen, J. Mater. Chem. B, 2016, 4, 3660–3669 RSC.
- S. Khashan, S. Dagher, N. Tit, A. Alazzam and I. Obaidat, Surf. Coat. Technol., 2017, 322, 92–98 CrossRef CAS.
- M. M. Ayad, J. Mater. Sci., 2009, 44, 6392–6397 CrossRef CAS.
- K. H. Kate, S. R. Damkale, P. Khanna and G. Jain, J. Nanosci. Nanotechnol., 2011, 11, 7863–7869 CrossRef CAS.
- P. Dallas, D. Niarchos, D. Vrbanic, N. Boukos, S. Pejovnik, C. Trapalis and D. Petridis, Polymer, 2007, 48, 2007–2013 CrossRef CAS.
- B. S. Singu and K. R. Yoon, Electrochim. Acta, 2018, 268, 304–315 CrossRef CAS.
- X. Yang and Y. Lu, Mater. Lett., 2005, 59, 2484–2487 CrossRef CAS.
- S. Ye, L. Fang and Y. Lu, Phys. Chem. Chem. Phys., 2009, 11, 2480–2484 RSC.
- W. Wu, C. Jiang and V. A. Roy, Nanoscale, 2015, 7, 38–58 RSC.
- J. O. Marques Neto, C. R. Bellato, C. H. de Souza, R. C. d. Silva and P. A. Rocha, J. Braz. Chem. Soc., 2017, 28, 2301–2312 CAS.
- N. Sahiner, H. Ozay, O. Ozay and N. Aktas, Appl. Catal., B, 2010, 101, 137–143 CrossRef CAS.
- V. Balakumar and P. Prakash, J. Catal., 2016, 344, 795–805 CrossRef CAS.
- Y. Snoussi, S. Bastide, M. Abderrabba and M. M. Chehimi, Ultrason. Sonochem., 2018, 41, 551–561 CrossRef CAS PubMed.
- M. Liang, R. Su, R. Huang, W. Qi, Y. Yu, L. Wang and Z. He, ACS Appl. Mater. Interfaces, 2014, 6, 4638–4649 CrossRef CAS PubMed.
- Y. Chi, Q. Yuan, Y. Li, J. Tu, L. Zhao, N. Li and X. Li, J. Colloid Interface Sci., 2012, 383, 96–102 CrossRef CAS PubMed.
- N. Sahiner and O. Ozay, Curr. Nanosci., 2012, 8, 367–374 CrossRef CAS.
- R. Kumar, R. M. El-Shishtawy and M. A. Barakat, Catalysts, 2016, 6, 76 CrossRef.
- S. Tang, S. Vongehr and X. Meng, J. Phys. Chem. C, 2010, 114, 977–982 CrossRef CAS.
- M. Gopiraman, S. Saravanamoorthy and I.-M. Chung, Res. Chem. Intermed., 2017, 43, 5601–5614 CrossRef CAS.
- S. BhanudasNaik, V. S. Prasad and N. N. Ghosh, Catal. Commun., 2011, 12, 1104–1108 CrossRef.
- T. Yao, Q. Zuo, H. Wang, J. Wu, B. Xin, F. Cui and T. Cui, J. Colloid Interface Sci., 2015, 450, 366–373 CrossRef CAS PubMed.
- H.-L. Cao, H.-B. Huang, Z. Chen, B. Karadeniz, J. Lü and R. Cao, ACS Appl. Mater. Interfaces, 2017, 9, 5231–5236 CrossRef CAS PubMed.
- A. Wang, H. Yin, H. Lu, J. Xue, M. Ren and T. Jiang, Catal. Commun., 2009, 10, 2060–2064 CrossRef CAS.
- K. Layek, M. L. Kantam, M. Shirai, D. Nishio-Hamane, T. Sasaki and H. Maheswaran, Green Chem., 2012, 14, 3164–3174 RSC.
- S. Sarmah and A. Kumar, Indian J. Phys., 2011, 85, 713 CrossRef CAS.
- X. Huang, G. Wang, M. Yang, W. Guo and H. Gao, Mater. Lett., 2011, 65, 2887–2890 CrossRef CAS.
- Y. Shirota and H. Kageyama, Chem. Rev., 2007, 107, 953–1010 CrossRef CAS PubMed.
- P. Wang, B. Huang, Y. Dai and M.-H. Whangbo, Phys. Chem. Chem. Phys., 2012, 14, 9813–9825 RSC.
- H. Zhang, R. Zong, J. Zhao and Y. Zhu, Environ. Sci. Technol., 2008, 42, 3803–3807 CrossRef CAS.
- M. M. Abdi, H. E. Mahmud, L. C. Abdullah, A. Kassim, M. Z. A. Rahman and J. L. Y. Chyi, Chin. J. Polym. Sci., 2012, 30, 93–100 CrossRef CAS.
- S. A. Ansari, M. M. Khan, M. O. Ansari, J. Lee and M. H. Cho, New J. Chem., 2014, 38, 2462–2469 RSC.
- C. C. Chen, Y. P. Fu and S. H. Hu, J. Am. Ceram. Soc., 2015, 98, 2803–2811 CrossRef CAS.
- Y. Cheng, F. Gao, L. An, J. Lan, X. Li and G. Wang, Res. Chem. Intermed., 2015, 41, 1741–1755 CrossRef CAS.
- Y. Cheng, F. Gao, L. An, X. Li and G. Wang, Adv. Powder Technol., 2014, 25, 1600–1607 CrossRef CAS.
- W. Li, Y. Tian, C. Zhao, Q. Zhang and W. Geng, Chem. Eng. J., 2016, 303, 282–291 CrossRef CAS.
- N. Guo, Y. Liang, S. Lan, L. Liu, J. Zhang, G. Ji and S. Gan, J. Phys. Chem. C, 2014, 118, 18343–18355 CrossRef CAS.
- F. Deng, L. Min, X. Luo, S. Wu and S. Luo, Nanoscale, 2013, 5, 8703–8710 RSC.
- J. Cai, X. Wu, S. Li and F. Zheng, ACS Sustainable Chem. Eng., 2016, 4, 1581–1590 CrossRef CAS.
- N. Areerachakul, S. Sakulkhaemaruethai, M. Johir, J. Kandasamy and S. Vigneswaran, J. Water Process Eng., 2019, 27, 177–184 CrossRef.
- J.-A. Park, B. Yang, J. Lee, I. G. Kim, J.-H. Kim, J.-W. Choi, H.-D. Park, I. W. Nah and S.-H. Lee, Chemosphere, 2018, 191, 738–746 CrossRef CAS PubMed.
- N. Wang, X. Li, Y. Yang, T. Guo, X. Zhuang, S. Ji, T. Zhang, Y. Shang and Z. Zhou, Sep. Sci. Technol., 2019, 211, 673–683 CAS.
- X. Wang, Y. Xiang, B. Zhou, Y. Zhang, J. Wu, R. Hu, L. Liu, J. Song and J. Qu, J. Colloid Interface Sci., 2019, 534, 1–11 CrossRef CAS PubMed.
- R. Fiorenza, M. Bellardita, S. Scirè and L. Palmisano, Mol. Catal., 2018, 455, 108–120 CrossRef CAS.
Footnote |
| † Electronic supplementary information (ESI) available. See DOI: 10.1039/c9ra02544h |
| This journal is © The Royal Society of Chemistry 2019 |


