DOI:
10.1039/C9RA02488C
(Paper)
RSC Adv., 2019,
9, 18565-18577
Zwitterionic superabsorbent polymer hydrogels for efficient and selective removal of organic dyes†
Received
2nd April 2019
, Accepted 23rd May 2019
First published on 12th June 2019
Abstract
A novel zwitterionic superabsorbent polymer hydrogel [ZI-SAH] was synthesized by free radical polymerization and used for the removal of crystal violet (CV) and congo red (CR) from an aqueous medium. ZI-SAH was composed of pH-sensitive monomers poly(3-acrylamidopropyl) trimethylammoniumchloride (APTMACl) and 2-acrylamido-2-methylpropanesulphonic acid (AAMPSA). The hydrogel was characterized by SEM and FT-IR spectroscopy, while the visco-elastic behavior was studied using rheological tests. The hydrogel showed a point of zero charge (PZC) at pH 7.2 and high swelling abilities of 3715% at pH 9 and 3112% at pH 5. The cationic crystal violet (CV) and anionic congo red (CR) dyes were employed to investigate the removal ability of ZI-SAH using the batch adsorption method. The materials became more selective towards oppositely charged dyes at pH 5 and 9. The effects of parameters such as contact time, initial concentration of dyes, pH, ZI-SAH dosage and ionic strength on the removal performance were investigated. A kinetic study was carried out via Lagergren pseudo first order and pseudo second order kinetics. The adsorption efficiencies of ZI-SAH were 13.6 mg g−1 for CV and 9.07 mg g−1 for CR with % removal values of 97 and 89, respectively. The thermodynamic parameters, namely, ΔG°, ΔH° and ΔS° were determined, and the negative value of free energy showed that the process of adsorption was spontaneous. ZI-SAH was recycled and reused in five consecutive cycles with removal efficiency > 75%.
1. Introduction
To overcome the issues caused by water pollution is a prominent research area within the scientific community nowadays. After the industrial revolution, the industrial and manufacturing processes increased and the waste water from these industries directly affected the flora and fauna of water ecosystems. Many major and minor causes of water pollution were studied by researchers, and one of the most significant causes is the release of organic dyes (macromolecules) from textile industries.1 In addition, the industries of food processing,2 pharmaceuticals,3 and leather4 are the major contributors of organic dye effluents, which are directly released into water and cause water pollution. The toxicity of organic dyes and heavy metals as pollutants in water has been reported in many studies.5
The treatment of industrial waste water having organic pollutants is a challenging process and phenomenon for researchers. Several traditional approaches such as Fenton reactions have been used for organic pollutant degradation.6 Naturally, it is not possible to directly degrade and remove the waste water organic pollutants, especially the organic dyes.7
Although the use of dyes for various industrial purposes cannot be denied due to their applications. Their harmful effects, especially on the environment, are more severe as they are more detrimental in general, in particular to the aquatic system. Water toxicity can directly impact living organisms, particularly human beings. It causes many biological and physiological problems in human beings such as cancer as well as lung, kidney and skin problems.
Many techniques have been used by various laboratories, industries and researchers for waste water treatment and these include physical treatments, chemical processes and biological activities. These techniques include both classical as well as modern techniques such as degradation,8,9 ion exchange,10 coagulation,11 oxidation, photo catalysis12–14 and adsorption.15,16 Thus, for the present work, the adsorption technique was selected due to its reasonably greater effectivity and easy access.17
Mostly, in the application of novel absorbents, researchers take more interest in the synthesis of superabsorbent hydrogels (SAH) and their applications for protecting water bodies from toxic dyes and heavy metals.18,19 Hydrogels can be used due to their easy synthesis and handling, low cost20 and excellent absorbance capacity.21 Systematically speaking, hydrogels comprise 3-dimensional networks22 with excellent elasticity and better affinity towards water absorption.23,24 The absorption and swelling property of a hydrogel is due to the hydrophilic part in the backbone, which shows greater affinity towards water.25 This hydrophilic (functional group) part consists of hydroxyl (–OH), amine (–NH2), sulphonic (–SO3H), carboxyl (–COOH), and amide (–CONH2) groups, which make the gels attractive to charged organic pollutants and heavy metals via encapsulation phenomena.26
In the present work, a novel zwitterionic superabsorbent hydrogel (ZI-SAH) copolymer was synthesized by the free radical co-polymerization of pH-sensitive cationic 3-acrylamidopropyl trimethylammoniumchloride (APTMACl) and anionic 2-acrylamido-2-methylpropanesulphonic acid (AAMPSA) monomers. The rheological property and swelling ability were studied in detail. ZI-SAH was applied successfully for the removal of cationic (crystal violet, CV) and anionic (congo red, CR) dyes in an aqueous medium. ZI-SAH was found to be more selective and efficient at pH 5 and 9 for CR and CV, respectively. The materials were recycled and reused for five consecutive cycles during the removal process, and the efficiency was still above 75%.
2. Experimental
2.1. Materials
3-Acrylamidopropyltrimethyl ammonium chloride (APTMACl, Sigma Aldrich, 75 wt%) and 2-acrylamido-2-methylpropanesulphonic acid (AAMPSA, 98%, Alfa Aesar) were used as cationic monomer and anionic monomer, respectively. N,N′-Methylenebisacrylamide (MBA, 99%, Sigma Aldrich) was used as a cross-linker, and ammonium persulfate (APS 98%, Sigma Aldrich) was used as an initiator. These chemicals were directly used for synthesizing hydrogels. Congo red (CR, Sigma Aldrich) and crystal violet (CV, Sigma Aldrich) as sources of organic dyes were used as-received. Milli-Q distilled water was used throughout the experimental work. NaNO3 (Merck), NaOH (BDH), HCl (Sigma), and KCl (BDH) were used as reagents during the research work.
2.2. Synthesis of zwitterionic superabsorbent hydrogels (ZI-SAH)
ZI-SAH was synthesized using the free radical copolymerization process at 60 °C for 30 minutes in an oven. AAMPSA (0.98 g) and APTMACl (120 μl) were taken and placed in a vial, which contained 5 ml of Milli-Q water and 0.05 g of MBA as a cross-linker. The mixture was sonicated and vortexed till a homogeneous mixture was obtained. Finally, the mixture was charged with APS (0.05 g/2 ml of H2O) and kept in an oven at 60 °C for 30 minutes. The synthesized product was washed with water to remove the unreacted monomers and other substances, dried in a vacuum oven at 40 °C and 0.75 kPa and stored for further use.
2.3. Dye removal study using ZI-SAH
The hydrogel was employed to remove CV and CR dyes in batch absorption experiments. For each test, a small piece (0.01 g) of ZI-SAH was added to 20 ml solution of CV and CR. The pH was adjusted and recorded using a pH meter (pH-2601) and it was shaken at 150 rpm for 14 h (equilibrium time) in a SH-30 Lab Shaker. For the maximum removal of CV and CR, the pH values of the solutions were maintained at 9 and 5 for CV and CR, respectively. UV/Vis spectroscopy (UV-2100) was used to monitor the absorbance of the CV and CR dyes in the solution during their removal process from water by the adsorbent. The λmax values of CV and CR were obtained and matched with the previously reported values of 497 nm for CR and 588 nm for CV. The capacity for the absorption of the hydrogels for dye equilibrium concentration (Ce) was calculated and analyzed. The gels were separated from the solution by centrifugation at 5000 rpm for 15 minutes and then filtered via Whatman-42 filter papers. All the specific conditions of the experiment are given in the caption of each figure.
3. Results and discussion
3.1. Characterization of ZI-SAH
Poly(3-acrylamidopropyl)-trimethylammoniumchloride-co-2-acrylamido-2-methylpropanesulphonic acid, i.e., ZI-SAH copolymer gels were prepared using free-radical polymerization in the presence of BIS as a cross-linker and APS as an initiator. All the FTIR spectra were recorded on PerkinElmer spectrum version 10.5.1. The FTIR spectra for ZI-SAH and individual cationic (C-SAH) and anionic (A-SAH) hydrogels are given in Fig. 1a. All the associated transmittance peaks corresponding to the functional groups present in copolymer hydrogels were observed. The peak at 1645 cm−1 is due to the carbonyl group (amide), and the peak at 1555 cm−1 is assigned to the bending vibration of the –NH group; the sharp peaks at 1145 and 1045 cm−1 are because of the bending and stretching vibrations of the S![[double bond, length as m-dash]](https://www.rsc.org/images/entities/char_e001.gif) O (sulphonic) group, respectively. The peak at 3296 cm−1 is attributed to the stretching vibration of amide (–CONH) groups present in the synthesized hydrogel, and the peak at 2936 cm−1 corresponds to the asymmetric stretching vibration of C–H. Similarly, the peaks at 600 cm−1 and 500 cm−1 are attributed to the –OH group's out-of-plane bending. The formation of ZI-SAH was confirmed by the disappearance of the peaks at 2477 and 2714 cm−1 in the case of pure anionic hydrogels and the disappearance of the peaks at 3393, 1099, and 959 cm−1 in the case of cationic hydrogels. Similarly, the appearance of new peaks at 3070 cm−1 for the ZI-SAH copolymer indicated the interaction between anionic and cationic monomers and the formation of the ZI-SAH copolymer. The surface morphology of ZI-SAH was further elaborated by scanning electron microscopy, as shown in Fig. 1b, which indicates that the surface is rough and most suitable for the adsorption process.
O (sulphonic) group, respectively. The peak at 3296 cm−1 is attributed to the stretching vibration of amide (–CONH) groups present in the synthesized hydrogel, and the peak at 2936 cm−1 corresponds to the asymmetric stretching vibration of C–H. Similarly, the peaks at 600 cm−1 and 500 cm−1 are attributed to the –OH group's out-of-plane bending. The formation of ZI-SAH was confirmed by the disappearance of the peaks at 2477 and 2714 cm−1 in the case of pure anionic hydrogels and the disappearance of the peaks at 3393, 1099, and 959 cm−1 in the case of cationic hydrogels. Similarly, the appearance of new peaks at 3070 cm−1 for the ZI-SAH copolymer indicated the interaction between anionic and cationic monomers and the formation of the ZI-SAH copolymer. The surface morphology of ZI-SAH was further elaborated by scanning electron microscopy, as shown in Fig. 1b, which indicates that the surface is rough and most suitable for the adsorption process.
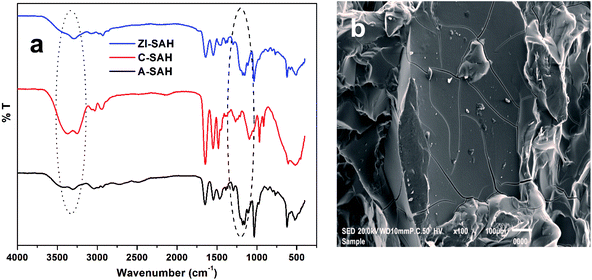 |
| | Fig. 1 (a) FTIR spectra of the superabsorbent hydrogel and (b) SEM image of ZI-SAH. | |
3.2. Characterization of ZI-SAH after dye entrapment
The removal capacity of ZI-SAH towards anionic (congo red, CR) and cationic (crystal violet, CV) dyes was examined in an aqueous medium. The sorption of dyes was visually confirmed by changing the solution color, as shown in Fig. 2a. As APTMACl is cationic and AAMPSA is anionic, both undergo structural changes with the change in the pH of the medium. The trapping and removal of the dyes by ZI-SAH are due to the diffusion and electrostatic forces of attraction. The existence of positive charge on the polymer network favors the attraction of anionic dyes, while the negative charge attracts cationic dyes. Above and below the point of zero charge (PZC), ZI-SAH became more selective and removed the oppositely charged dye more efficiently. After absorption, the hydrogels were characterized by FTIR spectra, as shown in Fig. 2b. The peaks at 1203 and 1391 cm−1 are the characteristic peaks for CV, and the peak at 1441 cm−1 is assigned to the C![[double bond, length as m-dash]](https://www.rsc.org/images/entities/char_e001.gif) C aromatic group; the peak at 1540 cm−1 is probably due to the N
C aromatic group; the peak at 1540 cm−1 is probably due to the N![[double bond, length as m-dash]](https://www.rsc.org/images/entities/char_e001.gif) N stretching band of the azo group in CR. The change in surface morphology was also studied by SEM, as shown in Fig. 2(c and d), which indicated and confirmed the attachment of dyes in aggregates on the surface of ZI-SAH successfully.
N stretching band of the azo group in CR. The change in surface morphology was also studied by SEM, as shown in Fig. 2(c and d), which indicated and confirmed the attachment of dyes in aggregates on the surface of ZI-SAH successfully.
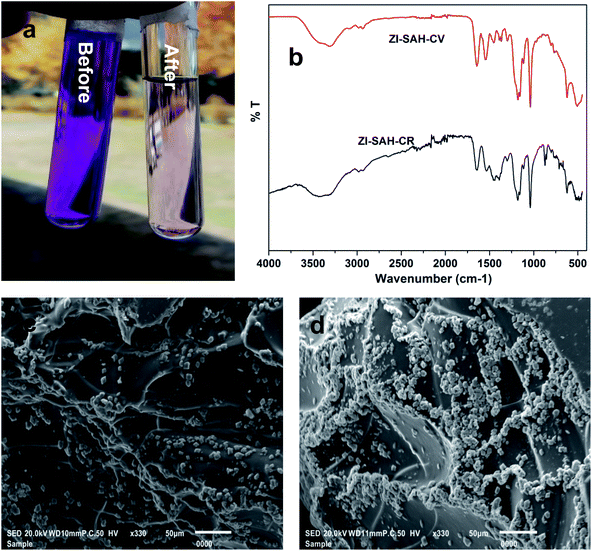 |
| | Fig. 2 (a) Discoloration of CV solution before and after adsorption; (b) FTIR spectra; (c) SEM image of ZI-SAH-CV and (d) SEM image of ZI-SAH-CR. | |
3.3. Rheological study of ZI-SAH
Rheology is the study of the flow behavior of a liquid and soft solid having a non-Newtonian property under the application of force. Currently, rheology is a characterizing tool used to verify the deformation and mechanical properties of polymers, emulsions, hydrogels, etc. Various characterization techniques have been used to determine the internal properties such as physical and chemical cross-linking and visco-elastic behavior as well as the internal structure using rheology. The rheological study of hydrogels helps understand the mechanical strength of a copolymer hydrogel while using rheological parameters such as the relationship between viscosity (η) and shear rate (τ), shear stress vs. shear rate, and moduli (storage modulus (G′), the property of elastic materials and loss modulus (G′′), and the property of viscous materials) via frequency and oscillatory dynamic mechanical analysis.27 Thus, rheological modeling enables researchers to differentiate between the viscous and elastic responses28 of the materials to be studied.
3.3.1. Flow curve study. Viscosity measurements as a function of shear rate were obtained at 35 °C and 40 °C, as shown in Fig. 3a. A slight increase in viscosity was observed initially, followed by a decreasing trend with the increase in the shear rate probably due to the deformation of intermolecular forces in the gels. These results showed that physical interactions, such as hydrogen bonds, existing in the polymer network are in the direction of the shear rate or flow, thus confirming a pseudo-plastic behavior.29 It was further studied that the decrease in viscosity was less at a high temperature because the gels changed from a swollen to a collapsed semi-solid state while expelling water molecules from the three-dimensional network of the ZI-SAH system.30
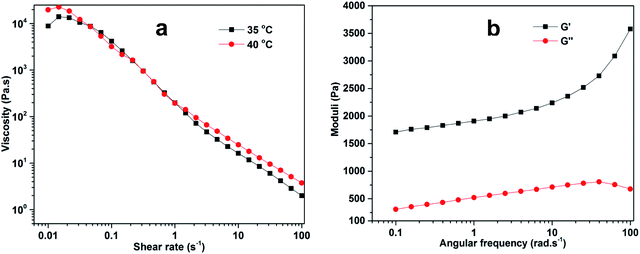 |
| | Fig. 3 Rheological investigation of (a) viscosity as a function of shear rate and (b) moduli as a function of angular frequency for ZI-SAH at 40 °C. | |
3.3.2. Frequency sweep study. During frequency sweep, the loss modulus (G′′) and storage modulus (G′) as a function of angular frequency were measured, as shown in Fig. 3b. This study was carried out to justify the mechanical characteristics, which were more supportive during the elucidation of the three-dimensional network of the gel, and this was necessary for studying the future application of these materials. The results indicate that the values of G′ were greater than those of G′′ for the entire range of angular frequency, illustrating that the elastic property is superior to the viscous property of the synthesized ZI-SAH. This phenomenon of the elastic property elaborated the concept of solid-like materials of the synthetic product, which is better for mechanical stability and applicable for the adsorption process. These results confirm that ZI-SAH can be used for the removal of dyes from solutions.
3.4. Swelling property and point of zero charge (PZC) measurement
The swelling property is one of the characteristics of gel materials. A dried gel swells due to the presence of ionic groups as well as due to the hydrophilicity and diffusion of water molecules inside the network of the gel, which change it into a swollen state. Thus, the swelling of a gel in water justifies the concept of swelling ratio, which is actually the absorption of water by a dry gel. The swelling property of ZI-SAH was investigated at pH 3, 5, 7, 9 and 11. Initially, it was found that at any pH, the gel swelled at a considerable rate and then, the process slowed down; however, ZI-SAH was kept for 24 h until equilibrium was established between water and hydrogels. The maximum amount of swelling was found at pH 9 (3715%) as well as at pH 5 (3112%) compared to the dry weight, as shown in Fig. 4a. This was due to the presence of ionizing groups (–N+(CH3)3 and –SO3H), which caused electrostatic repulsions in the 3D network of ZI-SAH and enhanced the hydrophilic nature of polymer chains. Thus, the water molecules easily penetrated the polymer gel network to swell it. Thus, at pH 5, the cationic part became more active and exhibited a greater number of positively charged repulsive sites. Moreover, at pH 9, the anionic sites became more negatively charged, which extended the gel network to become larger in size. The high % swelling at pH 9 compared to that at pH 5 is because of the compositional difference (85%![[thin space (1/6-em)]](https://www.rsc.org/images/entities/char_2009.gif) :
:![[thin space (1/6-em)]](https://www.rsc.org/images/entities/char_2009.gif) 10%, % mole composition) between the anionic and cationic monomers in ZI-SAH. The compositional difference was calculated through the number of moles of the individual monomer in the total composition of the ZI-SAH copolymer before the synthesis of ZI-SAH. The percent (%) swelling was calculated by applying eqn (1):
10%, % mole composition) between the anionic and cationic monomers in ZI-SAH. The compositional difference was calculated through the number of moles of the individual monomer in the total composition of the ZI-SAH copolymer before the synthesis of ZI-SAH. The percent (%) swelling was calculated by applying eqn (1):| |
 | (1) |
Here, Ws and Wd are the swollen and dry weights of the ZI-SAH samples, respectively.
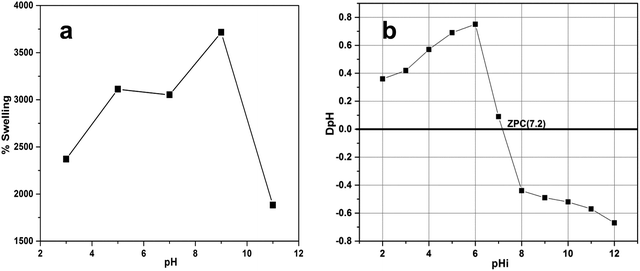 |
| | Fig. 4 (a) % swelling as a function of pH for ZI-SAH; temperature is 25 °C, dose is 0.90 g ± 0.05, equilibrium time is 24 h. (b) Illustration of PZC of ZI-SAH; dose is 0.02 g, pH range is 2–11 using 0.1 N NaNO3 solution, equilibrium time is 24 h, and the volume taken is 20 ml. | |
The swelling of ZI-SAH depends on the pH of the medium; therefore, the swelling was studied at different pH values in correlation with PZC (Fig. 4b). It was found that ZI-SAH swelled at all pH values due to the diffusion and synergistic effects of the cationic and anionic segments (electrostatic interactions). However, the swelling at PZC was only due to the diffusion process of water from the surrounding to the polymer network, while there was no contribution of the electrostatic repulsion of the –N+(CH3)3 and –SO3H groups for swelling as the network exhibited net zero charge.
Point of zero charge (PZC) is the pH at which the surface of the adsorbent or material becomes neutral. PZC is very useful and helpful to know the behavior of adsorbents during the adsorption study. PZC of the ZI-SAH copolymer was examined and determined by adding 0.02 g of dried ZI-SAH into a number of sample bottles having 20 ml of 0.01 M NaNO3 solution. Initially, the pH of each bottle was adjusted to 2, 3, 4, 5, 6, 7, 8, 9, 10 and 11 using 0.1 M NaOH and HNO3 solutions and was noted by a pH meter. The bottles were kept in a shaker and shaken for up to 4 h at 125 rpm at 25 °C under a controlled temperature. After shaking, the bottles were placed for 2 h and the final pH of each bottle was noted carefully. The value obtained for PZC of ZI-SAH was determined from eqn (2) and was found to be 7.2, as shown in Fig. 4b.
Here, pH
i and pH
f are the initial and final pH values of the solution, respectively.
3.5. Effect of pH on % removal of dyes
The removal ability of ZI-SAH was evaluated for both CR and CV in the entire pH range (3–11) under the same condition. The effect is illustrated in Fig. 5. From the data calculation and observation, it was found that the anionic dye (CR) was removed at pH 5 (acidic medium), while the cationic dye (CV) was removed at pH 9 although the anionic part of the ZI-SAH system worked at all pH values.31 From the calculated data, it was found that the adsorption capacity of ZI-SAH increased from 50 mg g−1 to 57.5 mg g−1 (% removal: 86.3) and then decreased to 54 mg g−1 at pH 6. CV was removed at pH 9 with a maximum adsorption capacity of 9.49 mg g−1 (% removal: 97). The removal process was due to the diffusion and electrostatic attractions between the polymer network and dye molecules. As the ZI-SAH system possessed both charges at all pH values, high positive charge density was observed at pH < pH PZC and high negative charge density was observed at pH > pH PZC. Therefore, the removal capability also varied and depended on the removal species. The removal efficiency of CR was high at low pH values because CR is a negatively charged macromolecule and the electrostatic interaction between CR and ZI-SAH (with high positive charge) was dominant. Similarly, ZI-SAH (with high negative charge) showed enhanced removal capability towards CV at high pH (optimum pH of 9) of the medium due to the positive charge on its structure. This property is very important and makes ZI-SAH more selective below and above the PZC value in any direction of the pH scale. The percent removal was calculated using eqn (3):| |
 | (3) |
Here, Co is the initial concentration of dyes and Ce is the concentration of dyes at equilibrium.
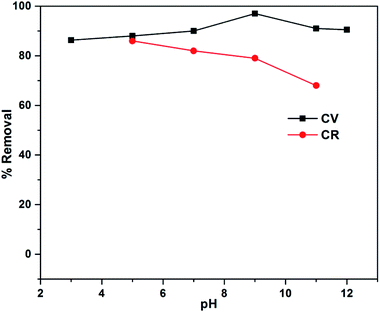 |
| | Fig. 5 % Removal as a function of pH for ZI-SAH. | |
3.6. Contact time effect
The effect of contact time was analyzed. We treated ZI-SAH (dose, 0.07 g) for the removal of CV (at pH 9) and CR (at pH 5) by taking different initial concentrations (5 ppm, 15 ppm, 30 ppm, 40 ppm and 50 ppm) of dyes at 25 °C in a temperature control shaker machine, while the contact time range was from 0.33 h (the first reading was taken at 20 minutes) to 14 h (equilibrium time). Initially, the rate of adsorption of both dyes was greater due to the availability of a large number of adsorption active sites in the hydrogel network. Gradually, the adsorption rate decreased due to the reduction in the number of active sites for adsorption till equilibrium was established. The data are plotted for Qt (the amount in mg g−1 adsorbed at time t) vs. t in Fig. 6, which indicates that the absorption rate is greater initially and gradually decreases with time.32 However, the equilibrium for CV was established earlier (Fig. 6a) compared to that for CR (Fig. 6b) although the equilibrium time for both was the same. The early establishment of equilibrium for CV as compared to that for CR was because of the availability of a large number of active sites for CV, which was based on the composition of the anionic monomers.
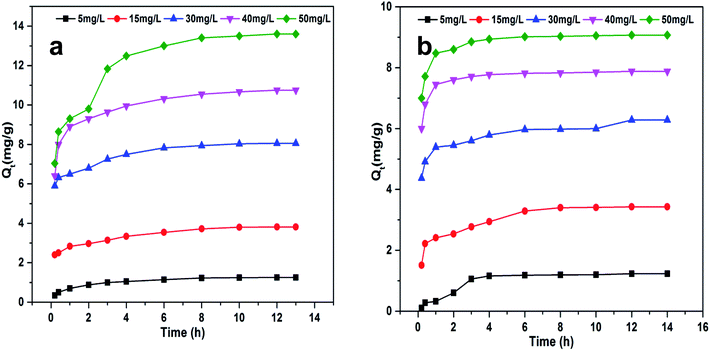 |
| | Fig. 6 Qt as a function of contact time at different initial concentrations of dyes: (a) CV at pH 9 and (b) CR at pH 5. ZI-SAH dose: 0.07 g, temperature: 25 °C. | |
3.7. Batch study of CV and CR
The absorption of CV and CR by ZI-SAH as an adsorbent was studied via batch experiments, maintaining the optimized pH for each pollutant for 14 h. The maximum amount of dyes adsorbed (qe mg g−1) was calculated using eqn (4):| |
 | (4) |
Here, qe (mg g−1) is the maximum amount of absorbed dyes in mg g−1 on the ZI-SAH system, Co is the initial equilibrium concentration in mg L−1 of the dyes in liquid solution, Ce is the equilibrium concentration in mg L−1 of the dyes in liquid solution, m (g) is the amount of ZI-SAH used as an adsorbent and V is the volume (in ml) of solution. The amounts of dyes removed with different initial concentrations are calculated and tabulated in Table 1. The data showed that the maximum adsorbed amount qe (mg g−1) of CV removed by the ZI-SAH system was greater than that of CR; however, the qe (mg g−1) values of both dyes increased with an increase in the initial concentration from 1.25 mg g−1 to 13.6 mg g−1 for CV and 1.23 mg g−1 to 9.07 mg g−1 for CR, as shown in Fig. 7b. Second, the % removal decreased with an increase in the initial concentration for both dyes, as shown in Fig. 7a. This was due to the availability of space in the polymer network. At low concentrations, the available space was large, while the same space became less for reactants used in high concentrations. Therefore, we reduced the % removal capability of ZI-SAH, and the same results were reported previously by our group.9 A higher % removal of CV at a higher initial concentration as compared to that for CR was due to the presence of high negative charge density on ZI-SAH as the amount of AAMPSA was higher in the ZI-SAH copolymer as compared to that of APTMACl.
Table 1 Absorption capacity and % removal of ZI-SAH towards CV and CR at different initial concentrations
| Initial concentration (ppm) |
qe (mg g−1) |
% Removal |
| CV |
CR |
CV |
CR |
| 5 |
1.25 |
1.23 |
98 |
86 |
| 15 |
3.80 |
3.43 |
96 |
80 |
| 30 |
8.06 |
6.28 |
95 |
73 |
| 40 |
10.75 |
7.88 |
94 |
71 |
| 50 |
13.6 |
9.07 |
92 |
70 |
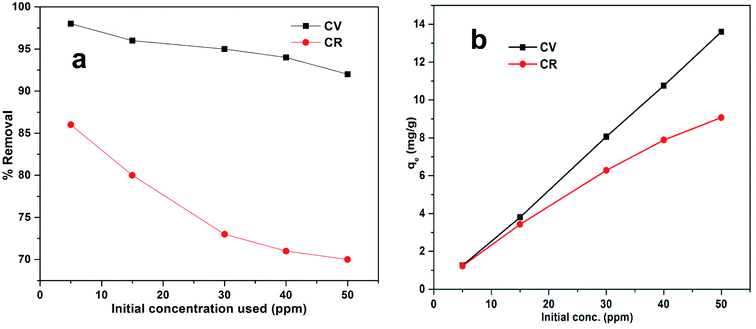 |
| | Fig. 7 (a) % removal and (b) qe (mg g−1) as a function of initial concentration of dyes used for absorption process. pH for CR was 5 and that for CV was 9; equilibrium time was 14 h. | |
3.8. Effect of ZI-SAH dose
The effect of the change in dosage for the removal of CV and CR was studied by considering different initial amounts of ZI-SAH ranging from 0.01 to 0.05 g at pH 9 for CV and pH 5 for CR at 25 °C for 14 h (equilibrium time). It was observed that the % removal of CV increased from 87 to 97.4% and for CR, it increased from 64 to 89% with an increase in the initial dose ranging from 0.01 to 0.05 g, as shown in Fig. 8. This clearly indicated that with the increase in the amount of ZI-SAH, the availability of absorption space for dyes increased (in terms of functional groups), which ultimately favored more dye molecules to be entrapped inside the polymer network and increased their removal from the aqueous medium.
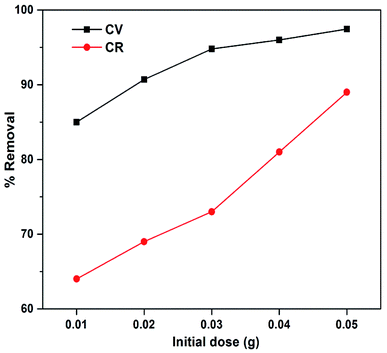 |
| | Fig. 8 % Removal as a function of ZI-SAH dose at 25 °C with 14 h contact time; for CV: concentration 10 mg L−1, pH 9 and for CR: concentration 15 mg L−1, pH 5. | |
3.9. Effect of ionic strength
The effect of ionic strength was determined to investigate the absorption capability of ZI-SAH towards CV and CR using different concentrations of KCl and NaNO3 (0.1 M, 0.2 M, 0.3 M, 0.4 M and 0.5 M). The results obtained are plotted in Fig. 9, which shows that the concentration of CV decreases with the increase in the concentrations of KCl and NaNO3. This was due to the increase in the number of K+ ions and Na+ ions in the solution, which blocked the active sites more in competition with the dye molecules, thus decreasing the CV absorption.33 However, it is clear from Fig. 9 (right) that the effect of NaNO3 compared to that of KCl on CV is more, which indicates that Na+ ions are strong competitors for CV molecules as compared to K+ ions. An opposite trend was observed for CR and its absorption capacity towards ZI-SAH increased with the incremental addition of KCl and NaNO3 (Fig. 9 (right)). The results show that the effect of NaNO3 remains greater in comparison to that of KCl, which may be due to the common ion effect. When the pH of the solution is 9, a greater number of Na+ ions can be obtained from NaOH in the solution during pH adjustment. Furthermore, this phenomenon may be due to the presence of similar ions or co-ions in the solution, which can enhance the ionic strength of the entire medium due to the strong intermolecular forces, facilitating the entrapment of dye molecules in the ZI-SAH network.34,35
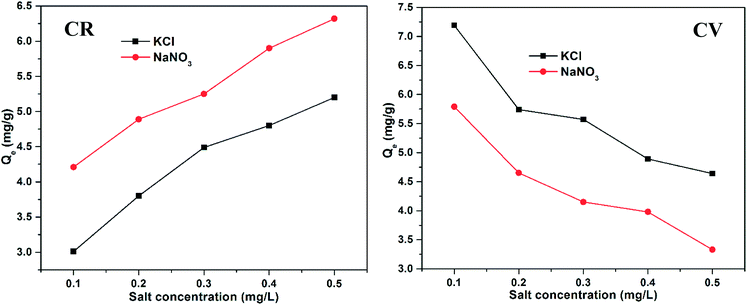 |
| | Fig. 9 Qe as a function of different salt concentrations. ZI-SAH dose 0.02 g; solution concentration of CV 20 mg L−1 and that of CR 50 mg L; temperature 25 °C. | |
3.10. Absorption isotherm models
To study the mechanism of dye removal by ZI-SAH, different isotherms, i.e., Langmuir, Freundlich and Temkin were used. The study was performed at different temperatures, but the optimum temperature was selected where maximum absorption occurred.
3.10.1. Langmuir isotherm. The Langmuir model describes the mechanism of the adsorption of substances on the surface in a uniform manner, as presented in eqn (5). It is basically set on the concept of the homogenous monolayer formation of dyes on the surface of polymer gels.| |
 | (5) |
Here, Ce (mg L−1) is the equilibrium concentration of dyes in solution, qe (mg g−1) is the maximum amount absorbed, Kl (L g−1) represents the free energy known as the Langmuir constant and qm (mg g−1) is the maximum amount required for monolayer adsorption. The data were plotted as Ce/qe vs. Ce, as shown in Fig. 10; from the slope and intercept, Kl and qm were calculated. The Kl and qm values for both CV and CR showed abnormality as the theoretical and experimental qe (mg g−1) values were not in a close correlation with the regression factor of 0.98, as shown in Table 2. Thus, the adsorption is not chemical for both CV and CR. The feasibility of the adsorption process was further elaborated by measuring the equilibrium parameter or separation factor (RL) using eqn (6) and the values are shown in Table 2.| |
 | (6) |
Here, Co is an initial concentration of dyes and Kl is the Langmuir constant. The RL values for CR and CV in the present study were 0.218 and 0.122, respectively, which indicated that the process of adsorption was favorable; however, the experimental and theoretical qm (mg g−1) values were not in a close relation to CV and CR but were not very far away from each other. Furthermore, the regression value (0.98) and the value of ΔH° (>40 kJ mol−1) for both CV and CR dyes in our case were 63.93 kJ mol−1 and 66.09 kJ mol−1, respectively, which suggested the possibility of the Langmuir isotherms. Thus, the adsorption may be monolayer with an establishment of chemical bonds between the adsorbent and the adsorbate.36–38
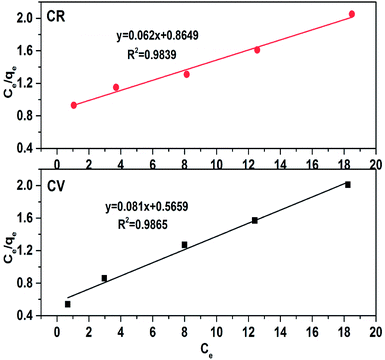 |
| | Fig. 10 Langmuir adsorption isotherm for dye removal in an aqueous medium using ZI-SAH. | |
Table 2 Various parameters obtained with different applied adsorption isotherms
| Dyes |
Langmuir |
Freundlich |
Temkin |
| Kl (L g−1) |
qm (mg g−1), theoretical |
qm(mg g−1), exp. |
R2 |
RL |
Kf (L g−1) |
N |
1/n |
R2 |
At (L g−1) |
B (J mol−1) |
R2 |
| CV |
0.143 |
12.37 |
13.6 |
0.9865 |
0.122 |
1.59 |
1.60 |
0.622 |
0.9930 |
34.34 |
157.10 |
0.8355 |
| CR |
0.016 |
16.12 |
9.07 |
0.9839 |
0.218 |
1.147 |
1.32 |
0.753 |
0.9837 |
5.002 |
1106.05 |
0.9493 |
3.10.2. Freundlich isotherm. The Freundlich model for adsorption mechanism is not restricted to monolayer homogeneity; thus, the Freundlich isotherm is an interpretation of the adsorption mechanism via the multilayer formation of heterogeneous surfaces.39 The logarithmic form of the Freundlich isotherm is represented in eqn (7):| |
 | (7) |
Here, qe (mg g−1) is the maximum amount of dye absorbed, Ce (mg L−1) is the equilibrium concentration of dye in solution, Kf (mg g−1) is the adsorption capacity (known as the Freundlich adsorption constant), and n is the Freundlich parameter, which is used to indicate the adsorption intensity. The graph is plotted for log![[thin space (1/6-em)]](https://www.rsc.org/images/entities/char_2009.gif) qe vs. log
qe vs. log![[thin space (1/6-em)]](https://www.rsc.org/images/entities/char_2009.gif) Ce (Fig. 11); the parameters Kf and n were determined from intercept and slope, respectively. The higher regression factor (R2) values, i.e., 0.9930 and 0.9837 for CV and CR, respectively, compared with that for the Langmuir isotherm (Table 2) confirmed that the absorption of dyes by ZI-SAH follows both Langmuir and Freundlich isotherm models. However, the other parameter of the Freundlich model, namely, n further highlighted the interface concentration within the solution, which can be justified by the n values. In this study, the values of n obtained for CV and CR were 1.60 and 1.32, respectively, which confirmed that the absorption of dyes by ZI-SAH is efficient. As the value of n > 1, therefore the sorption process for CV and CR is corporative in this study.40
Ce (Fig. 11); the parameters Kf and n were determined from intercept and slope, respectively. The higher regression factor (R2) values, i.e., 0.9930 and 0.9837 for CV and CR, respectively, compared with that for the Langmuir isotherm (Table 2) confirmed that the absorption of dyes by ZI-SAH follows both Langmuir and Freundlich isotherm models. However, the other parameter of the Freundlich model, namely, n further highlighted the interface concentration within the solution, which can be justified by the n values. In this study, the values of n obtained for CV and CR were 1.60 and 1.32, respectively, which confirmed that the absorption of dyes by ZI-SAH is efficient. As the value of n > 1, therefore the sorption process for CV and CR is corporative in this study.40
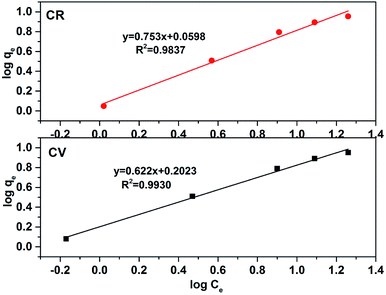 |
| | Fig. 11 Freundlich adsorption isotherm for dye removal in an aqueous medium using ZI-SAH. | |
3.10.3. Temkin isotherm. The Temkin isotherm model, as mentioned in eqn (8), gives information about the interaction of the adsorbate and absorbent. This model assumes that the heat of adsorption of all molecules in the layer can decrease linearly rather than logarithmically with coverage.| |
 | (8) |
Here, bT is the Temkin constant related to the heat of adsorption, T is the absolute temperature, R is the universal gas constant (8.314 J K−1 mol−1) and AT is the isotherm equilibrium binding constant. Another constant B = RT/bT can also be used, as shown in eqn (8). The data were plotted as qe and ln![[thin space (1/6-em)]](https://www.rsc.org/images/entities/char_2009.gif) Ce, as shown in Fig. 12. The bT and AT values were calculated from the slope and the intercept of the linear trend. The lower regression factor (R2) values of 0.83 and 0.94 for CV and CR, respectively, showed that the absorption of dyes by ZI-SAH does not follow the Temkin model (Table 2). Similarly, in the current study, the values of AT (34.34 and 5.002 L g−1 for CV and CR, respectively) and B (157.10 and 1106.50 J mol−1 for CV and CR, respectively) indicated a physical absorption process.
Ce, as shown in Fig. 12. The bT and AT values were calculated from the slope and the intercept of the linear trend. The lower regression factor (R2) values of 0.83 and 0.94 for CV and CR, respectively, showed that the absorption of dyes by ZI-SAH does not follow the Temkin model (Table 2). Similarly, in the current study, the values of AT (34.34 and 5.002 L g−1 for CV and CR, respectively) and B (157.10 and 1106.50 J mol−1 for CV and CR, respectively) indicated a physical absorption process.
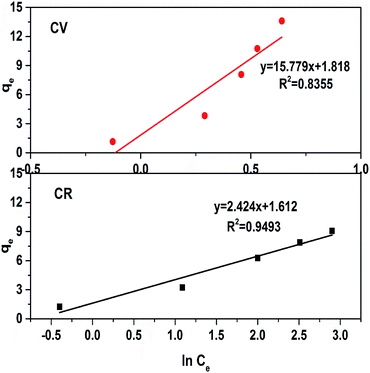 |
| | Fig. 12 Temkin adsorption isotherm for dye removal in an aqueous medium using ZI-SAH. | |
3.11. Absorption kinetic study
Two adsorption kinetic models, i.e., Lagergren pseudo first order and pseudo second order models were applied to investigate the kinetics and kinetic statistical parameters. The linear form of Lagergren pseudo first order kinetics is given in eqn (9):| |
ln(qe − qt) = ln![[thin space (1/6-em)]](https://www.rsc.org/images/entities/char_2009.gif) Qe − KL1t Qe − KL1t
| (9) |
Here, qe(mg g−1) is the maximum amount adsorbed at equilibrium, qt (mg g−1) is the amount adsorbed at various times (t) before the establishment of equilibrium, and KL1 (min−1) is the constant called the rate constant of the pseudo first order kinetic equation.
The plot of ln(qe − qt) vs. t is given in Fig. 13, where the kinetic parameters Qe and KL1 can be determined from the intercept and the slope of the plot, respectively, as tabulated in Table 3. The abnormal trend in KL1 (min−1) and low R2 values indicated that the adsorption of CV and CR by ZI-SAH from an aqueous medium deviates from the pseudo first order kinetics. Furthermore, the qe (mg g−1) (calculated and experimental shown in Table 3) values for different initial concentrations did not have a close correlation with each other, which showed that the removal of CV and CR is not via pseudo first order kinetics.
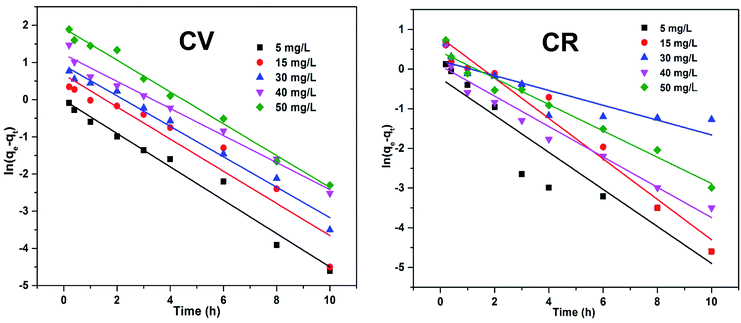 |
| | Fig. 13 Lagergren pseudo first-order kinetics of the adsorption of dyes (CV and CR) by ZI-SAH from aqueous media with different initial concentrations. | |
Table 3 Kinetic parameters measured for dye removal by ZI-SAH in an aqueous medium
| |
Initial conc. mg L−1 |
Pseudo first order kinetics |
Pseudo second order kinetics |
| qe (exp) |
qe (cal) |
KL1 (min−1) |
R2 |
qe (exp) |
qe (cal) |
KL2 (min−1) |
R2 |
| CV |
5 |
1.25 |
0.988 |
0.4488 |
0.975 |
1.25 |
1.24 |
1.052 |
0.995 |
| 15 |
3.811 |
1.958 |
0.432 |
0.908 |
3.811 |
3.831 |
0.663 |
0.995 |
| 30 |
8.06 |
2.511 |
0.409 |
0.981 |
8.06 |
8.16 |
0.555 |
0.998 |
| 40 |
10.75 |
3.353 |
0.363 |
0.981 |
10.75 |
11.18 |
0.402 |
0.999 |
| 50 |
13.6 |
6.82 |
0.428 |
0.989 |
13.6 |
14.06 |
0.167 |
0.996 |
| CR |
5 |
1.23 |
0.7933 |
0.46 |
0.87 |
1.23 |
1.22 |
0.67 |
0.995 |
| 15 |
3.43 |
2.216 |
0.51 |
0.96 |
3.43 |
3.42 |
0.52 |
0.995 |
| 30 |
6.28 |
1.233 |
0.18 |
0.75 |
6.28 |
7.07 |
1.24 |
0.998 |
| 40 |
7.88 |
1.088 |
0.38 |
0.94 |
7.88 |
7.90 |
3.22 |
0.999 |
| 50 |
9.07 |
1.54 |
0.33 |
0.96 |
9.07 |
9.12 |
1.35 |
0.996 |
Thus, the pseudo second order kinetic model was applied, the integrated form of which is given in eqn (10):
| |
 | (10) |
Here,
KL2 (min
−1) is the rate constant of second order kinetics. In
Fig. 14,
t/
qe is plotted against
t; from the slope of the linear trend, the constant parameters can be measured, as given in
Table 3. The regression factor (
R2) values for various concentrations of both CV and CR were greater than 0.98 or near to 1, as shown in
Table 3. This indicated that the absorption of dyes occurs through the mechanism of pseudo second order kinetics, which was further confirmed by the closeness of the calculated and experimental values of
qe (mg g
−1).
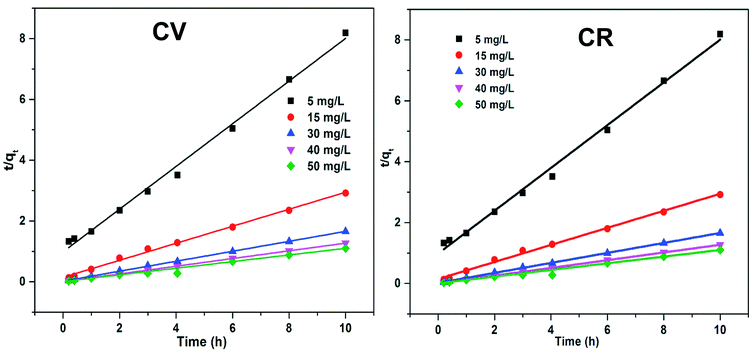 |
| | Fig. 14 Pseudo second order kinetics of the adsorption of dyes by ZI-SAH from an aqueous medium at different initial concentrations. | |
3.12. Thermodynamic investigation
Thermodynamic studies of the effects of various parameters on the absorption of CV and CR by ZI-SAH were performed by measuring Ea using the Arrhenius equation (eqn (11)), while ΔH°, ΔS° and ΔG° were calculated from eqn (12), (13) and (14), respectively:| |
 | (11) |
| |
ΔG° = −RT![[thin space (1/6-em)]](https://www.rsc.org/images/entities/char_2009.gif) ln ln![[thin space (1/6-em)]](https://www.rsc.org/images/entities/char_2009.gif) Kz Kz
| (13) |
| |
 | (14) |
Here, T is temperature in Kelvin, R is the universal gas constant (8.314 kJ mol−1 K−1) and Kz is the thermodynamic equilibrium constant; ΔS° (J mol−1 K−1), ΔH° (kJ mol−1) and ΔG° are the changes in entropy, enthalpy and Gibbs free energy, respectively. The data were plotted as ln![[thin space (1/6-em)]](https://www.rsc.org/images/entities/char_2009.gif) Kz vs. 1/T, while the values of ΔS° and ΔH° were calculated from the intercept and slope of the plot, as shown in Fig. 15 and mentioned in Table 4. The obtained values of entropy and enthalpy were used in eqn (12) to obtain the value of Gibbs free energy to check the spontaneity of the process. The value of Kz was determined from the ratio of Cads (solid) (concentration of adsorption on solid) to Ce (liquid) (concentration in liquid at equilibrium).
Kz vs. 1/T, while the values of ΔS° and ΔH° were calculated from the intercept and slope of the plot, as shown in Fig. 15 and mentioned in Table 4. The obtained values of entropy and enthalpy were used in eqn (12) to obtain the value of Gibbs free energy to check the spontaneity of the process. The value of Kz was determined from the ratio of Cads (solid) (concentration of adsorption on solid) to Ce (liquid) (concentration in liquid at equilibrium).
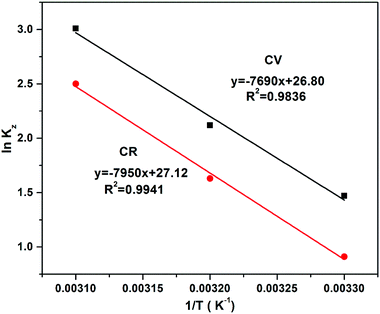 |
| | Fig. 15 Effects of temperature on absorption of CV and CR by ZI-SAH; dose 0.03 g, pH 9 for CV and pH 5 for CR at temperatures of 303 K, 308 K and 313 K. | |
Table 4 Various thermodynamic parameters for the adsorption of CV and CR at different temperatures
| Dye |
Initial conc. (mg L−1) |
ΔS° (J mol−1 K−1) |
ΔH° (kJ mol−1) |
R2 |
ΔG° (kJ mol−1) |
| 303 K |
308 K |
313 K |
| CV |
10 |
0.23 |
63.93 |
0.983 |
−3.639 |
−4.754 |
−5.869 |
| CR |
15 |
0.22 |
66.09 |
0.9998 |
−2.77 |
−1.67 |
−0.54 |
The positive value of enthalpy showed that the absorption of CV and CR by ZI-SAH was endothermic in nature. The absorption was found to increase in value on increasing the temperature because the enthalpy value was positive, which showed the endothermic nature of the process. Thus, the increase in temperature favored the adsorption process and showed the affinity of CV and CR towards ZI-SAH. Similarly, the positive value of ΔS° showed the increase in the disorder of dye molecules on the ZI-SAH system (randomness), while the negative value of free energy confirmed the spontaneity of the process.41
The spontaneity was studied at three different temperatures and the data were tabulated, as shown in Table 4. It was found that ΔG° showed a negative value at all temperatures (303, 308 and 313 K), which confirmed the spontaneity and thermodynamic feasibility of removal at different temperatures. Furthermore, it was observed that the ΔG° value shifted from −3.639 to −5.869 kJ mol−1 in the case of CV, which indicated that the CV removal by the increase in temperature (303 to 313 K) is more spontaneous. However, the ΔG° value for CR changed from −2.77 to −0.5 kJ mol−1, which showed that the adsorption of CR with the increase in temperature is less spontaneous.
3.13. Regeneration and recycling of ZI-SAH
ZI-SAH with entrapped dyes from the solution was regenerated by using 0.1 M NaOH solution. The entrapped dyes within ZI-SAH were kept in 20 ml of 0.1 M NaOH solution for 1 h. It was found that the color (due to the presence of dye molecules) of ZI-SAH changed to colorless. The solution was also tested with 10 ml acetone via the solvent extraction method, which washed away the dye molecules. For the regeneration and recycling of ZI-SAH, the second method was preferred. It was found that the regeneration of ZI-SAH was better and appropriate by acetone compared to that by NaOH because the addition of NaOH degraded the dyes within the hydrogels, while acetone extracted the dyes from the hydrogel network. Basically, NaOH reduced the chromophore of dyes and denatured it, as shown in the chemical reaction in Fig. S1.† The color of crystal violet is because of the presence of the conjugated system of the three rings and C![[double bond, length as m-dash]](https://www.rsc.org/images/entities/char_e001.gif) C bonds. However, when it reacts with the OH group, the C
C bonds. However, when it reacts with the OH group, the C![[double bond, length as m-dash]](https://www.rsc.org/images/entities/char_e001.gif) C bond is destroyed, due to which the conjugation becomes decentralized from C
C bond is destroyed, due to which the conjugation becomes decentralized from C![[double bond, length as m-dash]](https://www.rsc.org/images/entities/char_e001.gif) C; hence, the chromophore and auxochrome become deactivated and thus, the substance (dye) becomes colorless. Congo red showed a similar behavior toward NaOH solution.42 The regenerated gels were further reused for the removal of dyes in 5 consecutive cycles and the % removal was found to be greater than 75%, which showed the good efficiency of ZI-SAH as compared to that of classical adsorbents. The classical adsorbents such as saw dust, peels of various fruits and vegetables, and nut shells require modification and functionalization before use and their recycling involves multiple steps, which overall limits the impact on these species (Fig. 16).
C; hence, the chromophore and auxochrome become deactivated and thus, the substance (dye) becomes colorless. Congo red showed a similar behavior toward NaOH solution.42 The regenerated gels were further reused for the removal of dyes in 5 consecutive cycles and the % removal was found to be greater than 75%, which showed the good efficiency of ZI-SAH as compared to that of classical adsorbents. The classical adsorbents such as saw dust, peels of various fruits and vegetables, and nut shells require modification and functionalization before use and their recycling involves multiple steps, which overall limits the impact on these species (Fig. 16).
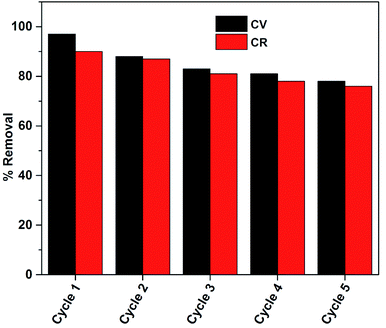 |
| | Fig. 16 Recycling and regeneration of CV and CR. | |
4. Conclusion
The zwitterionic superabsorbent hydrogel (ZI-SAH) system was synthesized through free radical polymerization at 60 °C for 30 minutes in an oven. The rheological study revealed that the behavior of the gels was non-Newtonian, pseudo-plastic and semi-solid in nature, which was a good indication for the use the gel in adsorption applications. ZI-SAH was successfully applied for the removal of crystal violet and congo red. The effects of various parameters such as contact time, pH and ionic strength were examined. The Langmuir, Freundlich and Temkin isotherm models were studied to elucidate the mechanism of the adsorption process of the dyes on ZI-SAH. It was found that both CV and CR followed the Freundlich adsorption model. The kinetic investigation showed that the removal of dyes followed pseudo second order kinetics. The stability of the ZI-SAH system was checked through regeneration and reuse for five consecutive cycles. The results indicated that ZI-SAH could be used after multiple cycles with >75% removal efficiency. Easy synthesis (single-step one-pot synthesis), regeneration, and quick recycling with better efficiency in multiple cycles make ZI-SAH cost-effective and more suitable for dye removal from an aqueous medium compared to other classical adsorbents.
Conflicts of interest
There are no conflicts to declare.
Acknowledgements
The authors are very thankful to Higher Education Commission of Pakistan for financial support under Startup research grant program No. 21-718/SRGP/R&D/HEC/2016 and National Research Program for Universities (NRPU) No. 7309.
References
- C. R. Holkar, A. J. Jadhav, D. V. Pinjari, N. M. Mahamuni and A. B. Pandit, J. Environ. Manage., 2016, 182, 351–366 CrossRef CAS PubMed.
- K. Yamjala, M. S. Nainar and N. R. Ramisetti, Food Chem., 2016, 192, 813–824 CrossRef CAS PubMed.
- A. A. Prasada, G. Kumara and D. M. Thomas, Bulletin of Chemical and Pharma Research, 2017, 1, 30–39 Search PubMed.
- C. Gomes, J. Piccin and M. Gutterres, Process Saf. Environ. Prot., 2016, 99, 98–106 CrossRef CAS.
- M. Premkumar, K. Thiruvengadaravi, P. S. Kumar, J. Nandagopal and S. Sivanesan, in Environmental Contaminants, Springer, 2018, pp. 317–360 Search PubMed.
- C. Dong, J. Lu, B. Qiu, B. Shen, M. Xing and J. Zhang, Appl. Catal., B, 2018, 222, 146–156 CrossRef CAS.
- Y. Zhang, N. Klamerth, P. Chelme-Ayala and M. Gamal El-Din, Environ. Sci. Technol., 2016, 50, 10535–10544 CrossRef CAS PubMed.
- C. Wang, Y. Zhan and Z. Wang, ChemistrySelect, 2018, 3, 1713–1718 CrossRef CAS.
- R. Javed, L. A. Shah, M. Sayed and M. S. Khan, RSC Adv., 2018, 8, 14787–14797 RSC.
- R. Dubey, J. Bajpai and A. Bajpai, Journal of Water Process Engineering, 2015, 5, 83–94 CrossRef.
- B. Shi, G. Li, D. Wang, C. Feng and H. Tang, J. Hazard. Mater., 2007, 143, 567–574 CrossRef CAS PubMed.
- X. Chen, G. Chen and P. L. Yue, Chem. Eng. Sci., 2003, 58, 995–1001 CrossRef CAS.
- J. Willkomm, K. L. Orchard, A. Reynal, E. Pastor, J. R. Durrant and E. Reisner, Chem. Soc. Rev., 2016, 45, 9–23 RSC.
- J. Gu, H. Chen, F. Jiang and X. Wang, J. Colloid Interface Sci., 2019, 540, 97–106 CrossRef CAS PubMed.
- A. Mehdinia, H. Mehrabi and A. Jabbari, New J. Chem., 2019, 43, 5581–5591 RSC.
- S. Ekici and G. Guntekin, Sep. Sci. Technol., 2018, 53, 1777–1790 CrossRef CAS.
- N. Wei, X. Zheng, H. Ou, P. Yu, Q. Li and S. Feng, New J. Chem., 2019, 43, 5603–5610 RSC.
- L. Gan, S. Shang, E. Hu, C. W. M. Yuen and S.-x. Jiang, Appl. Surf. Sci., 2015, 357, 866–872 CrossRef CAS.
- L. A. Shah, M. Khan, R. Javed, M. Sayed, M. S. Khan, A. Khan and M. Ullah, J. Cleaner Prod., 2018, 201, 78–87 CrossRef CAS.
- N. Sahiner, S. Demirci, M. Sahiner, S. Yilmaz and H. Al-Lohedan, J. Environ. Manage., 2015, 152, 66–74 CrossRef CAS PubMed.
- Z. Tang, O. J. Luo, X. Li, M. Zheng, J. J. Zhu, P. Szalaj, P. Trzaskoma, A. Magalska, J. Wlodarczyk and B. Ruszczycki, Cell, 2015, 163, 1611–1627 CrossRef CAS PubMed.
- Y. Zheng and A. Wang, Eur. Polym. J., 2015, 72, 661–686 CrossRef CAS.
- U. P. Shinde, B. Yeon and B. Jeong, Prog. Polym. Sci., 2013, 38, 672–701 CrossRef.
- L. A. Shah, J. Mol. Liq., 2019, 288, 111045 CrossRef CAS.
- M. M. Siddiqui, S. Rais-Bahrami, B. Turkbey, A. K. George, J. Rothwax, N. Shakir, C. Okoro, D. Raskolnikov, H. L. Parnes and W. M. Linehan, JAMA, 2015, 313, 390–397 CrossRef CAS PubMed.
- O. Ozay, S. Ekici, Y. Baran, N. Aktas and N. Sahiner, Water Res., 2009, 43, 4403–4411 CrossRef CAS PubMed.
- D. Caccavo, S. Cascone, G. Lamberti and A. Barba, Chem. Soc. Rev., 2018, 47, 2357–2373 RSC.
- M. Johnson Jr and D. Segalman, J. Non-Newtonian Fluid Mech., 1977, 2, 255–270 CrossRef.
- M. A. Malana, R. Zohra and M. S. Khan, Korea-Aust. Rheol. J., 2012, 24, 155–162 CrossRef.
- L. A. Shah, R. Javed, A. Khan, I. Bibi, N. S. Khattak and S. Alam, Z. Phys. Chem., 2018 DOI:10.1515/zpch-2018-1310.
- E. Su and O. Okay, React. Funct. Polym., 2018, 123, 70–79 CrossRef CAS.
- F. Zhang, B. Ma, X. Jiang and Y. Ji, Powder Technol., 2016, 302, 207–214 CrossRef CAS.
- L. Fayoumi, M. Ezzedine, H. Akel and M. El Jamal, Port. Electrochim. Acta, 2012, 30, 121–133 CrossRef CAS.
- M. M. Ibrahim, J. Environ. Chem. Eng., 2018, 102848 Search PubMed.
- X. Peng, D. Huang, T. Odoom-Wubah, D. Fu, J. Huang and Q. Qin, J. Colloid Interface Sci., 2014, 430, 272–282 CrossRef CAS PubMed.
- M. Alkan, Ö. Demirbaş, S. Celikcapa and M. Doğan, J. Hazard. Mater., 2004, 116, 135–145 CrossRef CAS PubMed.
- K. Selim, F. El Hosiny, M. A. Khalek and I. Osama, Colloid Surf. Sci., 2017, 2, 47 Search PubMed.
- F. I. El-Hosiny, M. A. Abdel-Khalek, K. A. Selim and I. Osama, Physicochem. Probl. Miner. Process., 2018, 54, 321–333 Search PubMed.
- W. Ni, H. Chen, J. Su, Z. Sun, J. Wang and H. Wu, J. Am. Chem. Soc., 2010, 132, 4806–4814 CrossRef CAS PubMed.
- K. Fytianos, E. Voudrias and E. Kokkalis, Chemosphere, 2000, 40, 3–6 CrossRef CAS PubMed.
- H. J. Kumari, P. Krishnamoorthy, T. Arumugam, S. Radhakrishnan and D. Vasudevan, Int. J. Biol. Macromol., 2017, 96, 324–333 CrossRef PubMed.
- L. Yang, Y. Xiang, L. Chen, D. Zhang, C. Wu, S. Zhang, J. Wang and D. Tian, J. Mol. Liq., 2017, 231, 655–662 CrossRef CAS.
Footnote |
| † Electronic supplementary information (ESI) available. See DOI: 10.1039/c9ra02488c |
|
| This journal is © The Royal Society of Chemistry 2019 |
Click here to see how this site uses Cookies. View our privacy policy here.  Open Access Article
 *,
Mansoor Khan,
Muhammad Irfan and
Noor Saeed Khattak
![[double bond, length as m-dash]](https://www.rsc.org/images/entities/char_e001.gif) O (sulphonic) group, respectively. The peak at 3296 cm−1 is attributed to the stretching vibration of amide (–CONH) groups present in the synthesized hydrogel, and the peak at 2936 cm−1 corresponds to the asymmetric stretching vibration of C–H. Similarly, the peaks at 600 cm−1 and 500 cm−1 are attributed to the –OH group's out-of-plane bending. The formation of ZI-SAH was confirmed by the disappearance of the peaks at 2477 and 2714 cm−1 in the case of pure anionic hydrogels and the disappearance of the peaks at 3393, 1099, and 959 cm−1 in the case of cationic hydrogels. Similarly, the appearance of new peaks at 3070 cm−1 for the ZI-SAH copolymer indicated the interaction between anionic and cationic monomers and the formation of the ZI-SAH copolymer. The surface morphology of ZI-SAH was further elaborated by scanning electron microscopy, as shown in Fig. 1b, which indicates that the surface is rough and most suitable for the adsorption process.
O (sulphonic) group, respectively. The peak at 3296 cm−1 is attributed to the stretching vibration of amide (–CONH) groups present in the synthesized hydrogel, and the peak at 2936 cm−1 corresponds to the asymmetric stretching vibration of C–H. Similarly, the peaks at 600 cm−1 and 500 cm−1 are attributed to the –OH group's out-of-plane bending. The formation of ZI-SAH was confirmed by the disappearance of the peaks at 2477 and 2714 cm−1 in the case of pure anionic hydrogels and the disappearance of the peaks at 3393, 1099, and 959 cm−1 in the case of cationic hydrogels. Similarly, the appearance of new peaks at 3070 cm−1 for the ZI-SAH copolymer indicated the interaction between anionic and cationic monomers and the formation of the ZI-SAH copolymer. The surface morphology of ZI-SAH was further elaborated by scanning electron microscopy, as shown in Fig. 1b, which indicates that the surface is rough and most suitable for the adsorption process.
![[double bond, length as m-dash]](https://www.rsc.org/images/entities/char_e001.gif) C aromatic group; the peak at 1540 cm−1 is probably due to the N
C aromatic group; the peak at 1540 cm−1 is probably due to the N![[double bond, length as m-dash]](https://www.rsc.org/images/entities/char_e001.gif) N stretching band of the azo group in CR. The change in surface morphology was also studied by SEM, as shown in Fig. 2(c and d), which indicated and confirmed the attachment of dyes in aggregates on the surface of ZI-SAH successfully.
N stretching band of the azo group in CR. The change in surface morphology was also studied by SEM, as shown in Fig. 2(c and d), which indicated and confirmed the attachment of dyes in aggregates on the surface of ZI-SAH successfully.

![[thin space (1/6-em)]](https://www.rsc.org/images/entities/char_2009.gif) :
:![[thin space (1/6-em)]](https://www.rsc.org/images/entities/char_2009.gif) 10%, % mole composition) between the anionic and cationic monomers in ZI-SAH. The compositional difference was calculated through the number of moles of the individual monomer in the total composition of the ZI-SAH copolymer before the synthesis of ZI-SAH. The percent (%) swelling was calculated by applying eqn (1):
10%, % mole composition) between the anionic and cationic monomers in ZI-SAH. The compositional difference was calculated through the number of moles of the individual monomer in the total composition of the ZI-SAH copolymer before the synthesis of ZI-SAH. The percent (%) swelling was calculated by applying eqn (1):


![[thin space (1/6-em)]](https://www.rsc.org/images/entities/char_2009.gif) qe vs. log
qe vs. log![[thin space (1/6-em)]](https://www.rsc.org/images/entities/char_2009.gif) Ce (Fig. 11); the parameters Kf and n were determined from intercept and slope, respectively. The higher regression factor (R2) values, i.e., 0.9930 and 0.9837 for CV and CR, respectively, compared with that for the Langmuir isotherm (Table 2) confirmed that the absorption of dyes by ZI-SAH follows both Langmuir and Freundlich isotherm models. However, the other parameter of the Freundlich model, namely, n further highlighted the interface concentration within the solution, which can be justified by the n values. In this study, the values of n obtained for CV and CR were 1.60 and 1.32, respectively, which confirmed that the absorption of dyes by ZI-SAH is efficient. As the value of n > 1, therefore the sorption process for CV and CR is corporative in this study.40
Ce (Fig. 11); the parameters Kf and n were determined from intercept and slope, respectively. The higher regression factor (R2) values, i.e., 0.9930 and 0.9837 for CV and CR, respectively, compared with that for the Langmuir isotherm (Table 2) confirmed that the absorption of dyes by ZI-SAH follows both Langmuir and Freundlich isotherm models. However, the other parameter of the Freundlich model, namely, n further highlighted the interface concentration within the solution, which can be justified by the n values. In this study, the values of n obtained for CV and CR were 1.60 and 1.32, respectively, which confirmed that the absorption of dyes by ZI-SAH is efficient. As the value of n > 1, therefore the sorption process for CV and CR is corporative in this study.40

![[thin space (1/6-em)]](https://www.rsc.org/images/entities/char_2009.gif) Ce, as shown in Fig. 12. The bT and AT values were calculated from the slope and the intercept of the linear trend. The lower regression factor (R2) values of 0.83 and 0.94 for CV and CR, respectively, showed that the absorption of dyes by ZI-SAH does not follow the Temkin model (Table 2). Similarly, in the current study, the values of AT (34.34 and 5.002 L g−1 for CV and CR, respectively) and B (157.10 and 1106.50 J mol−1 for CV and CR, respectively) indicated a physical absorption process.
Ce, as shown in Fig. 12. The bT and AT values were calculated from the slope and the intercept of the linear trend. The lower regression factor (R2) values of 0.83 and 0.94 for CV and CR, respectively, showed that the absorption of dyes by ZI-SAH does not follow the Temkin model (Table 2). Similarly, in the current study, the values of AT (34.34 and 5.002 L g−1 for CV and CR, respectively) and B (157.10 and 1106.50 J mol−1 for CV and CR, respectively) indicated a physical absorption process.
![[thin space (1/6-em)]](https://www.rsc.org/images/entities/char_2009.gif) Qe − KL1t
Qe − KL1t


![[thin space (1/6-em)]](https://www.rsc.org/images/entities/char_2009.gif) ln
ln![[thin space (1/6-em)]](https://www.rsc.org/images/entities/char_2009.gif) Kz
Kz

![[thin space (1/6-em)]](https://www.rsc.org/images/entities/char_2009.gif) Kz vs. 1/T, while the values of ΔS° and ΔH° were calculated from the intercept and slope of the plot, as shown in Fig. 15 and mentioned in Table 4. The obtained values of entropy and enthalpy were used in eqn (12) to obtain the value of Gibbs free energy to check the spontaneity of the process. The value of Kz was determined from the ratio of Cads (solid) (concentration of adsorption on solid) to Ce (liquid) (concentration in liquid at equilibrium).
Kz vs. 1/T, while the values of ΔS° and ΔH° were calculated from the intercept and slope of the plot, as shown in Fig. 15 and mentioned in Table 4. The obtained values of entropy and enthalpy were used in eqn (12) to obtain the value of Gibbs free energy to check the spontaneity of the process. The value of Kz was determined from the ratio of Cads (solid) (concentration of adsorption on solid) to Ce (liquid) (concentration in liquid at equilibrium).

![[double bond, length as m-dash]](https://www.rsc.org/images/entities/char_e001.gif) C bonds. However, when it reacts with the OH group, the C
C bonds. However, when it reacts with the OH group, the C![[double bond, length as m-dash]](https://www.rsc.org/images/entities/char_e001.gif) C bond is destroyed, due to which the conjugation becomes decentralized from C
C bond is destroyed, due to which the conjugation becomes decentralized from C![[double bond, length as m-dash]](https://www.rsc.org/images/entities/char_e001.gif) C; hence, the chromophore and auxochrome become deactivated and thus, the substance (dye) becomes colorless. Congo red showed a similar behavior toward NaOH solution.42 The regenerated gels were further reused for the removal of dyes in 5 consecutive cycles and the % removal was found to be greater than 75%, which showed the good efficiency of ZI-SAH as compared to that of classical adsorbents. The classical adsorbents such as saw dust, peels of various fruits and vegetables, and nut shells require modification and functionalization before use and their recycling involves multiple steps, which overall limits the impact on these species (Fig. 16).
C; hence, the chromophore and auxochrome become deactivated and thus, the substance (dye) becomes colorless. Congo red showed a similar behavior toward NaOH solution.42 The regenerated gels were further reused for the removal of dyes in 5 consecutive cycles and the % removal was found to be greater than 75%, which showed the good efficiency of ZI-SAH as compared to that of classical adsorbents. The classical adsorbents such as saw dust, peels of various fruits and vegetables, and nut shells require modification and functionalization before use and their recycling involves multiple steps, which overall limits the impact on these species (Fig. 16).


