 Open Access Article
A clinical and computational study on anti-obesity effects of hydroxycitric acid†
Manu Tomar a,
Raghavendra Prahlad Raob,
Palaniyamma Dorairajb,
Abhishek Koshtaa,
Sowbhagya Suresha,
Mohamed Rafiqb,
Rajesh Kumawatb,
Rangesh Parameshb,
Babu U. V*b and
K. V. Venkatesh
 *a
*a
aDepartment of Chemical Engineering, Indian Institute of Technology, Bombay, Powai, Mumbai – 400076, India. E-mail: venks@iitb.ac.in; Tel: +91 22 2576 7223
bThe Himalaya Drug Company, Makali, Bengaluru, 562162, India. E-mail: dr.babu@himalayawellness.com; Tel: +91 8067549862
First published on 12th June 2019
Abstract
Hydroxycitric acid (HCA), a major active ingredient of Garcinia cambogia extracts, is known to suppress body weight gain and fat synthesis in animals and humans. But the underlying mechanism of HCA action is not fully understood. Clinical study on 100 obese individuals for a period of 3 months was performed followed by a computational study aimed to investigate the effects of HCA treatment on human subjects at anthropometric and plasma lipid profile levels. A detailed hepatic metabolic model was used to incorporate the effect of HCA at the metabolic pathway level. Perturbation analysis of ATP citrate lyase activity in the metabolic pathway was performed to simulate the net effect of HCA. Significant reductions in body weight, triceps, subscapular, and mid axillary measurements as well as in serum triglyceride, cholesterol, HDL and LDL levels were observed following HCA dosage. During the study, half of the subjects experienced a decline in body weight and the remainder experienced an increase in body weight. However, analysis of fat mass with the help of empirical correlations clearly showed significant reduction in the mean values due to HCA dosage in both cases. An extra increase in fat free mass was responsible for offsetting the decrease in fat mass for the subjects who experienced an increase in body weight during the trials. Perturbation analysis showed a net reduction in fatty acid, triglyceride and cholesterol synthesis along with urea cycle fluxes under lipogenetic conditions. Moreover, protein synthesis fluxes increased under these conditions. These results indicate that HCA treatment can reduce body weight gain and fat accumulation in obese subjects along with improving their anthropometric parameters and metabolic state.
1. Introduction
There has been an increase in the prevalence of obesity and related comorbidity over the last few decades. This is evident as worldwide obesity has nearly tripled since 1975.1 Obesity is defined as a Body Mass Index (BMI) over 30 kg m−2 and is associated with several chronic and debilitating lifestyle related health problems like cardiovascular disease, type-2 diabetes, obesity related cancers, osteoarthritis, hyperlipidemia, gall bladder disease, abnormal dilation of veins, backache, shortage of breath, hypertension and also psychological disturbances.2 A wide variety of obesity management strategies are presently practiced including lifestyle changes in terms of diet and physical activity; behavioral treatment strategies to improve adherence to lifestyle interventions; pharmacological & herbal dietary products based strategies and bariatric surgery for treating extreme cases.3–7 Hydroxycitric acid (HCA) is a well-known herbal dietary supplement used for obesity treatment.8 It is a derivative of citric acid and is found in plant species native to south Asia like Garcinia cambogia, Garcinia indica and Garcinia atroviridis.9 HCA is an α-β-dihydroxy tricarboxylic acid which is a key component present in fruit rind and is recognized for its weight loss property.10,11Multiple mechanisms are known to be responsible for the weight loss and anti-obesity effect of HCA, namely, (1) serotonin regulation and food intake suppression, (2) decreased de novo lipogenesis, (3) increased fatty acid oxidation, (4) downregulation of a spectrum of obesity associated genes and (5) reduction in plasma insulin and leptin levels along with glucose intake rates in tissues. These mechanisms often lead to reduced respiratory exchange ratio (RER) and increased energy expenditure (ER) during exercise and resting states (Fig. 1(A)).12,13 It has been found that HCA reduces weight gain by inhibiting ATP citrate lyase (ACLY), an enzyme responsible for catalysing the extra-mitochondrial cleavage of citrate to oxaloacetate and acetyl coenzyme A (acetyl-CoA), a building block of fatty acid synthesis.14 Thus, HCA reduces acetyl-CoA and subsequently malonyl-CoA pool, limiting the availability of two carbon groups required for the synthesis of fats and cholesterol.
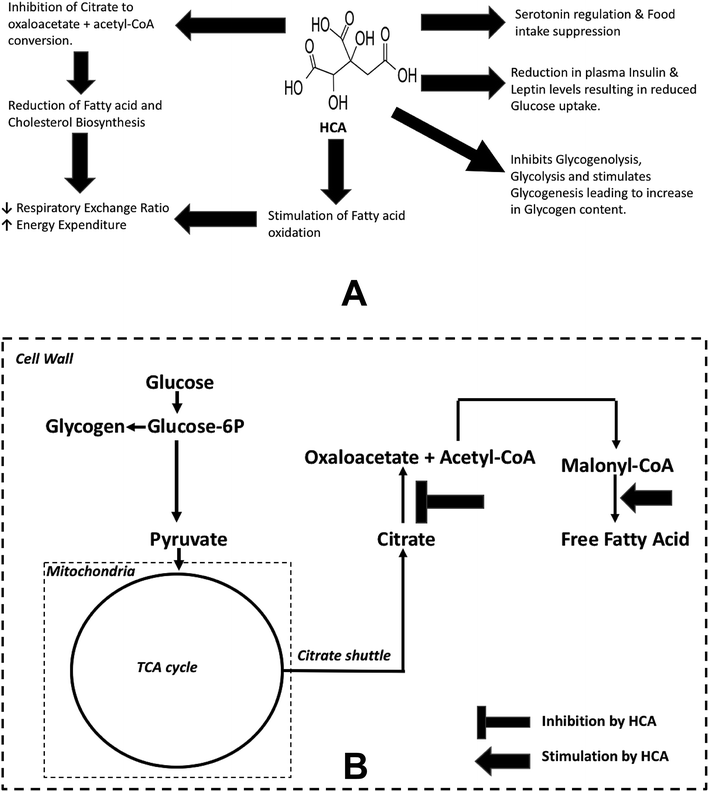 | ||
| Fig. 1 Anti-obesity effects of Garcinia cambogia/HCA. (A) Possible mechanisms that contribute to anti-obesity effects of HCA. (B) Highlights two reactions which have been perturbed in the metabolic pathway model25 to simulate the anti-obesity effect of HCA. Firstly, inhibition of eqn (3): citrate → oxaloacetate + acetyl-CoA. Secondly, activation of eqn (4): malonyl-CoA → free fatty acid. | ||
Several clinical studies have validated the anti-obesity effects of HCA. For instance, it is reported that HCA dosage reduces de novo lipogenesis in humans who are overfed with carbohydrates.15 Similarly, 500 mg of lyophilised extract of Garcinia cambogia given three times a day for eight weeks reduces body weight gain, cholesterol and triglycerides in overweight humans, without showing any adverse effects.16 HCA treatment increases branched chain and aromatic amino-acids in liver and serum in male rats leading to a rise in protein synthesis due to changes in the metabolic directions of amino-acids.17 Further, it is known that HCA inhibits phosphofructokinase18 which is a key enzyme controlling glycolysis. Thus, this mechanism inhibits glycolysis leading to higher glycogen content in liver and muscle.
Similarly, HCA reduces lipid droplet accumulation via decreasing acetyl-CoA supply and accelerated energy metabolism in cultured primary chicken hepatocytes.19 This study also shows that HCA affects lipid metabolism related gene expression. For instance, it inhibits ATP citrate lyase (ACLY) and fatty acid synthase (FAS) mRNA expression levels and increases peroxisome proliferator-activated receptor (PPAR) alpha which contributes to increase in fatty acid oxidation. Moreover, the expression of glycogen synthase (GS) increases and glycogen phosphorylase (GP) decreases which is in line with the earlier observations where glycogen levels increased in the HCA treatment groups. In another such study on mice,20 effect of four weeks of treatment of G. cambogia rind fruit extract showed a significant decrease in serum total cholesterol, triglycerol, glucose, insulin and leptin levels. Another study, conducted for 8 weeks, showed a significant reduction in triglycerides, LDL and total cholesterol levels of lipid profiles in human subjects treated with HCA vis-à-vis placebo group.21
However, the effect of HCA on humans has not been conclusive. In a systematic review and meta-analysis of randomised clinical trials on the use of Garcinia extract (hydroxycitric acid) as a weight loss supplement,8 authors examined its efficacy as a weight reducing agent for overweight, obese and normal subjects. They found that the magnitude of this weight loss effect is small and is significant only in the short term. Further, lifestyle adjustments like diet and exercise also influence the effect of these studies in an uncertain manner. In an inconclusive study, randomised double-blind, placebo controlled clinical trial investigating the efficacy of 12 weeks HCA supplementation on body weight, body composition and blood chemistry in healthy, overweight subjects showed a significant decrease in body fat but insignificant reduction in BMI and some anthropometric measurements due to HCA intervention.22 In another twelve week randomised controlled trial, authors concluded that Garcinia cambogia failed to produce significant weight loss and fat mass loss in obese men and women beyond that observed in placebo.23 Some negative effect of high dose of HCA has also been reported where it suppresses fat accumulation in developing male Zucker obese rats, but is highly toxic to the testis.24
Hence, the overall effect of HCA is inconclusive with the exact underlying mechanisms still unclear. However, in our current study, the inhibition of ATP citrate lyase and activation of carnitine palmitoyl transferase-I by HCA has been quantitatively analysed by a hepatic metabolic model.25 Along with this micro level study, clinical data analysis is also reported with respect to various anthropometric and physiological variables which changed significantly due to HCA dosage. These variables also give insights into macro level parameters related to body composition like fat mass, fat free mass with the help of empirical relations. This is the first time in literature that such statistical and empirical analysis of clinical data along with metabolic pathway perturbation analysis has been conducted.
2. Methodology
2.1 Clinical data analysis
An open-label clinical study was conducted on 100 obese individuals of either sex in the age group of 20–45 years. The study was carried out after getting approval from the Institutional Ethics Committee. A written informed consent was obtained from all the subjects before enrolling into the study. Single Garcinia caplet was given twice daily for the period of three months. Each 600 mg caplet contained 250 mg extract and 350 mg powder. The extract is 60–66% of HCA which is obtained by water extraction after eliminating all hydrophobic compounds. Remaining ingredients in the extract are – calcium, citric acid, lactones and moisture (ESI Table 11†). The stability of the caplet was also studied over a period of three-months and found to be safely within the specified limits (ESI Table 12†).Eight variables were measured before and after consumption of caplets. These are body weight, skin fold thickness of triceps, subscapular and midaxillary along with serum levels of cholesterol, triglycerides, HDL and LDL. The aim of statistical analysis was to identify the presence of significant differences in variables before and after the medicine was given to patients. Details of the methodology adopted for statistical data analysis is given in ESI (Appendix I†). Apart from the above mentioned statistical analysis of the physical and physiological variables, body composition in terms of fat mass, fat free mass has also been calculated for the entire population with the help of following empirical relations.26
 | (1) |
 | (2) |
In eqn (1) and (2); Fm, Fw are fat mass for men and women respectively. BW represents body weight and ‘H’ is height. Complete raw data obtained from the trial is provided in ESI File S2.†
2.2 Hepatic metabolism – micro model analysis
A mathematical model incorporating the regulatory circuit of hepatic metabolism has been used to analyze the metabolic effects of HCA in diet.27 It takes plasma macronutrients (glucose, amino acids and fatty acids) as input regulators of metabolic pathways. The regulatory actions are mediated by hormones like insulin and glucagon that are triggered by sensing the plasma macronutrients through pancreas. These hormones further activate specific signaling pathways that eventually stimulate downstream enzymes that catalyze metabolism. The model consists of central metabolic pathways including glycolysis, gluconeogenesis, glycogen metabolism, TCA cycle, fatty acid synthesis and oxidation, protein synthesis and breakdown, urea cycle, pentose phosphate pathway, cholesterol biosynthesis and hexosamine pathway (Fig. S1†). These pathways are further integrated with sub-models for signaling and transcription networks adopting a systems level approach. Thus, the overall model is composed of four modules viz., blood (metabolites and hormones), metabolism, signaling and transcription. It consists of 272 rate equations, 167 ODEs and 801 parameters. Mechanistic actions of HCA is incorporated by reducing fatty acid synthesis fluxes and increasing fatty acid oxidation fluxes in the model. HCA competitively inhibits citrate cleaving enzyme ATP citrate lyase28 in cytosol (eqn (3)).| Citrate + ATP + CoA → acetyl-CoA + OAA + ADP + Pi | (3) |
| Acetyl-CoA + 7Mal-CoA + NADPH → FFA + 8CoA + 14NADP + CO2 | (4) |
3. Results & discussion
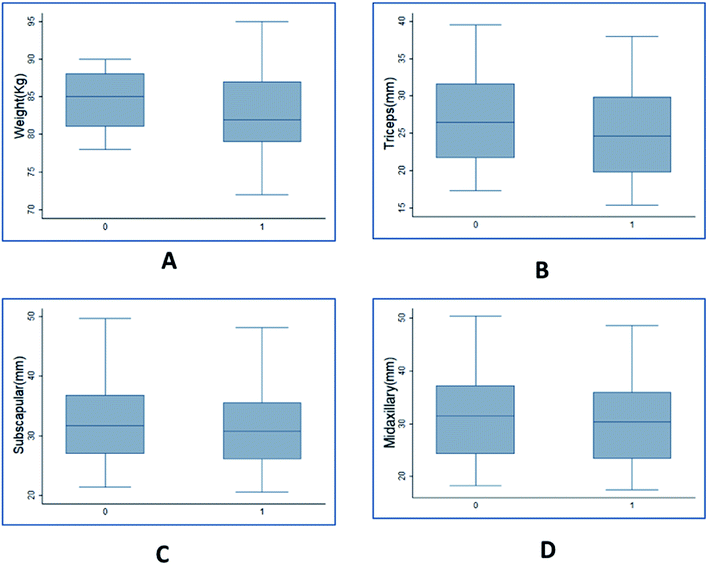
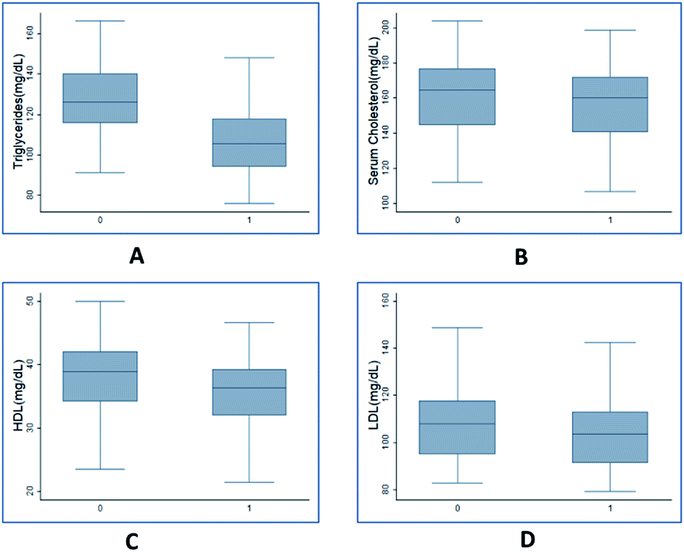
Clinical data of plasma lipid profile & anthropometric variables for 100 individual with initial BMI greater than or equal to 28 was observed. The paired t-test results showed that the mean value of all the 8 variables measured after giving Garcinia caplets was lesser than the mean values measured earlier (ESI Table 1†). The p-values for the mean difference being negative was less than 10−4 for all the cases, indicating statistical significance in the observed difference. The same was verified with the help of box plots showing comparison of variables before and after consuming HCA caplets (Fig. 2 & 3).Fig. 2 shows the box plots of anthropometric variables before and after the trials. The mean value of body weight (Fig. 2(A)) before the trial was 84.2 kg which reduced to 82.5 kg after the trial. This indicates an average of 18.9 mg per day reduction in body weight with values ranging from 111.1 mg per day to −88.9 mg per day. The body weight drop resulted in an average BMI reduction of 0.74 kg m−2 (Fig. S2†) during the trial period with a maximum of 4.11 kg m−2 and a minimum of −3.78 kg m−2 drop. The skin fold thickness measured in triceps, subscapular and midaxillary also dropped from a mean of 27.07, 32.68 and 32.14 to 25.22, 31.57 and 30.95 (Fig. 2(B, C and D) respectively). The serum lipid measurements indicated that triglyceride, cholesterol, HDL and LDL values reduced from an average of 127, 161, 38 and 107 to 107, 157, 36 and 103 mg dL−1, respectively (Fig. 3(A–D)). The highest amount of reduction of close to 15% was observed in the case of triglycerides, followed by 6% reduction in HDL. As seen from these figures, the variance in the case of weight was higher post trial compared to before trials. However, the other variables indicated similar variance. This indicated that HCA had a variable effect on body weight of individuals compared to other variables. Overall, it is seen that the values were significantly higher before as compared to after the consumption of Garcinia. Therefore, it can be concluded that consumption of HCA caplets has a significant effect on an individual's weight, skin fold thickness (triceps, subscapular, midaxillary), cholesterol, triglycerides, HDL and LDL levels.
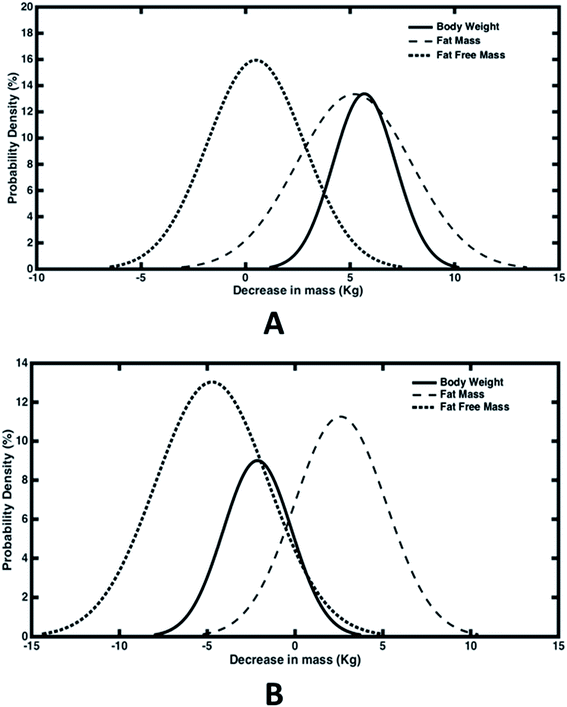
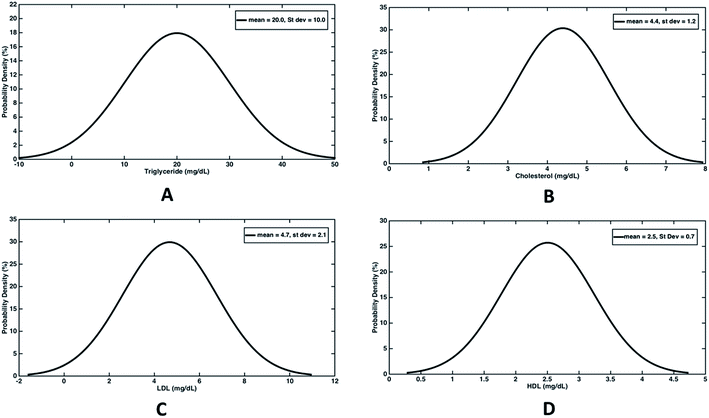
In order to evaluate the percent drop in fat and fat free mass, empirical relationships (eqn (1)) estimating fat mass from body weight, BMI and age were used. Out of the total 100 subjects who participated in the study, 50 experienced a decline in body weight and the rest experienced an increase in body weight. Hence we have analysed both the cases separately wherein the difference in weight, fat mass and fat free mass before and after the trial were fitted with normal distribution (Fig. 4). For those experiencing a decline in bodyweight, a mean drop of 5.7 kg was achieved, out of which 5.2 kg drop was due to reduction in fat mass (Fig. 4(A)). Thus almost 91% weight reduction was contributed due to fat mass reduction alone. On an average, daily dosage of 1200 mg of Garcinia caplets led to 57.8 g per day and 5.6 g per day of fat mass and fat free mass reduction, respectively. Whereas, rest of the subjects experienced an average increase of 2.1 kg and 4.7 kg of body weight and fat free mass, respectively. However, their fat mass decreased with an average value of 2.6 kg (Fig. 4(B)). Thus their average decrease and increase in fat mass and fat free mass was 28.9 g per day and 52.2 g per day, respectively. It can be seen that the reduction in fat mass is offset by an extra increase in fat free mass, leading to an increase in body weight in this case. This may be due to the fact that these subjects were exercising, physically more active or consuming a high protein diet during the trials. Fig. 5(A–D) show the normal distribution of reduction in plasma lipid levels before and after the trials. The mean drop in serum triglyceride and cholesterol levels were 20 mg dL−1 and 4.4 mg dL−1 with a standard deviation of 10 mg dL−1 and 1.2 mg dL−1 respectively; while the mean drop for LDL and HDL were 4.7 mg dL−1 and 2.5 mg dL−1 respectively. This indicates that HCA preferably reduces more bad cholesterol (LDL) than good cholesterol (HDL).
A validated and previously published mathematical model incorporating signaling and metabolic pathways in liver,25 was used to analyse the effect of HCA on the metabolic state in liver. In order to incorporate the effect of HCA, the activity of ATP-citrate lyase was lowered and dynamic response was obtained under lipogenesis conditions with increased plasma levels of glucose, fatty acid and amino acid. Such micro level analysis of hepatic metabolic fluxes provides dynamic as well as static response of HCA effect on metabolite levels both inside liver and in plasma.
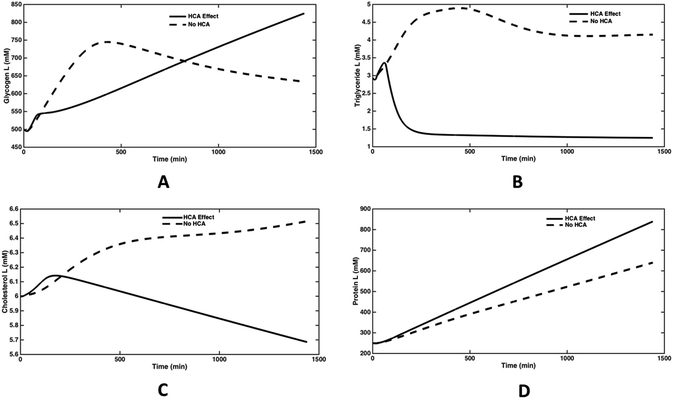
The direct effect of lowering the activity of ATP-citrate lyase was observed on the dynamics of glycogen synthesis (Fig. 6(A)). It is seen that glycogen levels peak at about 400 minutes in absence of HCA, whereas it continues to increase for a period of 24 hours in presence of HCA. HCA action fills the glycogen stores in liver and other tissues, thereby reducing appetite while increasing energy levels.31 The triglyceride synthesis reaches a steady state value of 4 mM over 1000 min, while on inhibiting the enzyme, the steady state triglyceride level was reduced by 70% (Fig. 6(B)). The cholesterol levels also reduced by 18% in 1000 minutes and continues to decrease further (Fig. 6(C)). These results are in line with several studies which state the hypolipidemic effects of Garcinia in obese humans and animals.32,33 The plasma protein levels increased by about 30% in 1000 minutes and continues to increase further (Fig. 6(D)). Thus, protein synthesis dynamics are slower than that of triglyceride and cholesterol synthesis. HCA is known to increase the protein synthesis in liver and muscle by inhibiting fatty acid synthesis and altering metabolic directions of amino acids.17,34
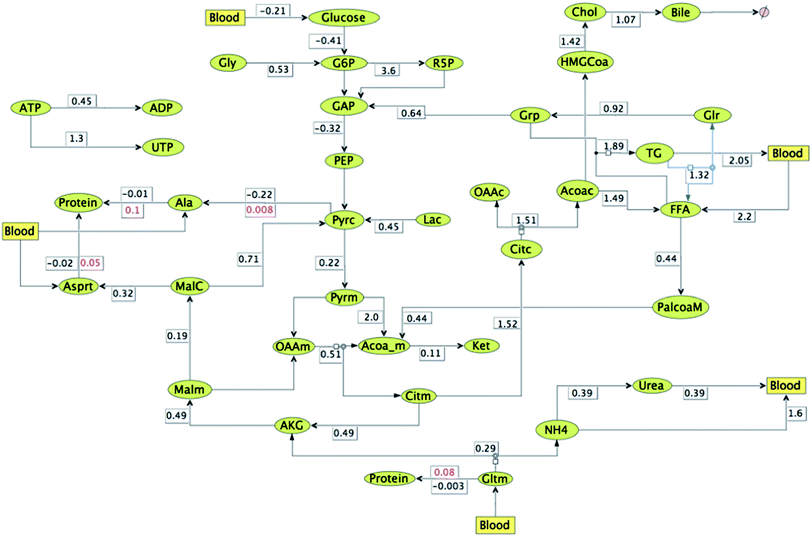
In order to first understand the changes in fluxes under high macronutrient conditions such as in the case of obesity, compared to fasting conditions with respect to the plasma metabolic levels, relative flux map is constructed (Fig. 7). The numbers represent fluxes under conditions of lipogenesis (when glucose, AA, FA = 2 folds each) relative to fasting state (when glucose, AA, FA = 1 fold each). The figure clearly shows an increase in triglyceride and fatty acid synthesis rates along with cholesterol, bile formation and pentose phosphate pathway fluxes in hepatic cells (with relative flux values greater than 1). On the other hand, fatty acid oxidation, urea formation, TCA cycle, ketone formation (from ACoA), glycogen breakdown and gluconeogenesis fluxes decrease under these (with relative flux values < 1) conditions. Moreover, proteins are getting synthesized from amino acids like alanine, glutamine and aspartate (as shown by reversal of fluxes from protein breakdown to synthesis in Fig. 7).
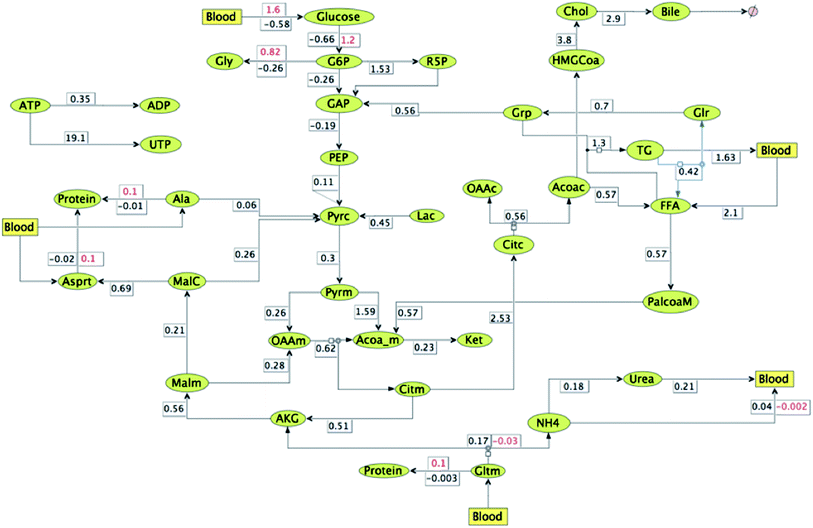
In order to obtain insights into the changes in relative fluxes due to the effect of HCA under lipogenesis conditions, ratio of the metabolic reaction rate was mapped at the steady state triglyceride synthesis rate. The fluxes were quantified relative to the fasting conditions. ATP-citrate lyase activity was reduced to 56% and in addition, FFA oxidation fluxes were reduced to only 57% due to HCA effect. The resulting fluxes at the end of 66 minutes are shown in Fig. 8. Glucose uptake, glycogen synthesis and pentose phosphate pathway fluxes increase along with a decrease in gluconeogenesis fluxes. It can be observed that there is 190% increase in ejection of cholesterol through bile. Rate of urea formation is reduced by 82% and protein synthesis occurring (instead of slow protein breakdown under normal conditions) from all the three AA with more ammonia getting consumed in the process instead of urea formation. Further, TCA cycle and ketone synthesis fluxes decrease due to the given perturbations under HCA effect. ADP formation fluxes decrease with most ATP getting consumed in UTP formation (19.1 fold change).
On comparing the fluxes mapped in Fig. 7 and 8 anti-lipolytic effect of HCA is evident. Synthesis rates of free fatty acid and triglycerides decrease from 1.5 and 1.9 to 0.6 and 1.3 respectively. Further, rates of cholesterol ejection through bile and free fatty acid oxidation increase from 1.1 and 0.4 to 2.9 and 0.6 respectively. Although cholesterol synthesis rates also increases from 1.4 to 3.8, plasma cholesterol levels decrease due to increase in bile excretion. Flux of triglyceride release into blood reduce from 2.1 to 1.6 due to HCA effect. But in spite of this reduction triglyceride levels in the hepatic cells decrease due to reduction of their synthesis rates. These values clearly demonstrate anti-lipogenic and pro-fatty acid oxidation and bile formation effects of HCA. Urea formation and release rates (into blood) decrease from 0.4 to 0.2, whereas amino acid and protein formation fluxes increase inside the hepatic cell. TCA fluxes under lipogenic conditions (both with and without HCA effect) reduce as compared to normal fasting conditions. But ketone formation (from acetyl-CoA) fluxes increase from 0.1 to 0.2 under the influence of the perturbations induced by HCA. Moreover, HCA effect is also causing flux reversals from glycogen breakdown to glycogen formation under lipogenic conditions.35 Glucose is now absorbed rather than released into the blood with increase in glycolytic fluxes and decrease in gluconeogenetic fluxes. Flux towards pentose phosphate pathway decrease under HCA effect in lipogenic conditions. Formation of UTP from ATP increases (19.1 vs. 1.3) at the expense of ADP conversion (0.4 vs. 0.3), thereby increasing the blood flow to muscle.36
Physiologically, we can see that HCA helps in reducing fat accumulation and increasing fat breakdown under lipogenic conditions. But this effect comes at the cost of increased ketogenesis which is undesirable under surplus levels of glucose in blood and glycogen in cells. Excessive production of ketone bodies under such conditions may lead to diabetic ketoacidosis37,38 resulting in drop of pH levels leading to damaging effect on other organs like kidney, liver and muscle in the long run.39–41 As a precaution it should be noted that HCA consumption should not be accompanied with high fat diet in order to prevent side effects like hepatic ketogenesis.42 Moreover, the increase in glycogen and protein synthesis17 can result in increased muscle mass in the body or an increase in plasma nitrogen levels (in the form of urea (BUN) or amino acids) depending on the presence or absence of exercise in lifestyle.43 While former can be a favorable condition, latter can lead to diseases like rhabdomyolysis and nephropathy.39,40 Hence, low fat diet and exercise must be included in the lifestyle along with HCA dosage to avoid any side effects.
4. Conclusion
Our study highlights the anti-obesity effects of HCA with the help of clinical data and metabolic model analysis. Anthropometric and lipid profile parameters show significant reduction in median values. Moreover, mean reduction in serum triglyceride level was equal to 20 mg dL−1 over a period of three months, which is equivalent to 0.003 mM decline per day (almost equal to that obtained from the metabolic model); higher than cholesterol, HDL and LDL accounting for improved lipid profiles in obese subjects. Average decline in fat and fat free mass of the subjects who experienced body weight reduction was 57.8 and 5.6 g per day whereas the same values for the remaining participants who experienced an increase in body weight were 28.9 and −52.2 g per day. Thus, fat mass reduction effect of HCA was offset by the extra increase in fat free mass in the subjects who experienced an increase in body weight during the trial. Micro model analysis of hepatic metabolism shows a decrease in fatty acid and triglyceride synthesis and urea cycle fluxes along with an increase in glycogen and protein synthesis fluxes. Thus, giving insights into mechanisms involved in the anti-obesity action of HCA.Conflict of interest
The authors declare no conflict of interest.Acknowledgements
We thank Ministry of Human Resource Development, Government of India for funding of Teaching Assistantship and Department of Biotechnology for providing grants to Research Assistants.References
- World Health Organisation, Obesity and overweight, WHO, 2016, https://entity/mediacentre/factsheets/fs311/en/index.html Search PubMed.
- J. B. Dixon, The effect of obesity on health outcomes, Mol. Cell. Endocrinol., 2010, 316(2), 104–108 CrossRef CAS PubMed.
- N. Alamuddin, Z. Bakizada and T. A. Wadden, Management of obesity, J. Clin. Oncol., 2016, 34(35), 4295–4305 CrossRef PubMed.
- R. F. Kushner, Weight loss strategies for treatment of obesity, Prog. Cardiovasc. Dis., 2014, 56(4), 465–472 CrossRef PubMed.
- E. Burgess, P. Hassmén, M. Welvaert and K. L. Pumpa, Behavioural treatment strategies improve adherence to lifestyle intervention programmes in adults with obesity: a systematic review and meta-analysis, Clin. Obes., 2017, 7(2), 105–114 CrossRef CAS PubMed.
- L. Van Gaal and E. Dirinck, Pharmacological approaches in the treatment and maintenance of weight loss, Diabetes Care, 2016, 39(suppl. 2), S260–S267 CrossRef CAS PubMed.
- N. N. Sun, T. Y. Wu and C. F. Chau, Natural dietary and herbal products in anti-obesity treatment, Molecules, 2016, 21(10), 1351 CrossRef PubMed.
- I. Onakpoya, S. K. Hung, R. Perry, B. Wider and E. Ernst, The use of garcinia extract (hydroxycitric acid) as a weight loss supplement: a systematic review and meta-analysis of randomised clinical trials, J. Obes., 2011, 2011, 1–9 CrossRef PubMed.
- C. Roongpisuthipong, R. Kantawan and W. Roongpisuthipong, Reduction of adipose tissue and body weight: effect of water soluble calcium hydroxycitrate in Garcinia atroviridis on the short term treatment of obese women in Thailand, Asia Pac. J. Clin. Nutr., 2007, 16(1), 25–29 Search PubMed.
- B. Antony, W. Varghese and M. Elias, Preparation-and-evaluation-of-hydroxy-citric-acid-from-garcinia-cambogia-extract-using-rpamide-hplc.pdf, Indian J. Pharm. Sci., 2004, 66(2), 208 CAS.
- S. E. Ohia, et al., Safety and mechanism of appetite suppression by a novel hydroxycitric acid extract (HCA-SX), Mol. Cell. Biochem., 2002, 238(1–2), 89–103 CrossRef CAS PubMed.
- L. O. Chuah, W. Y. Ho, B. K. Beh and S. K. Yeap, Updates on antiobesity effect of garcinia Origin (−)-HCA, Evid.-Based Complementary Altern. Med., 2013, 2013, 1–17 CrossRef PubMed.
- R. B. Semwal, D. K. Semwal, I. Vermaak and A. Viljoen, A comprehensive scientific overview of Garcinia cambogia, Fitoterapia, 2015, 102, 134–148 CrossRef CAS PubMed.
- J. A. Watson and J. M. Lowenstein, Citrate and the conversion of carbohydrate into fat. Fatty acid synthesis by a combination of cytoplasm and mitochondria, J. Biol. Chem., 1970, 245(22), 5993–6002 CAS.
- E. M. R. Kovacs and M. S. Westerterp-Plantenga, Effects of (-)-hydroxycitrate on net fat synthesis as de novo lipogenesis, Physiol. Behav., 2006, 88, 371–381 CrossRef CAS PubMed.
- R. R. Ramos, J. F. Saenz and M. C. Aguilar, Control of obesity with Garcinia cambogia extract, Invest. Med. Int., 1996, 22(3), 97–100 Search PubMed.
- N. Han, L. Li, M. Peng and H. Ma, (-)-Hydroxycitric Acid Nourishes Protein Synthesis via Altering Metabolic Directions of Amino Acids in Male Rats, Phytother. Res., 2016, 1329, 1316–1329 CrossRef PubMed.
- S. A. McCune, L. G. Foe, R. G. Kemp and R. R. Jurin, Aurintricarboxylic acid is a potent inhibitor of phosphofructokinase, Biochem. J., 1989, 259, 925–927 CrossRef CAS PubMed.
- L. Li, M. Peng, C. Ge, L. Yu and H. Ma, (-)-Hydroxycitric Acid Reduced Lipid Droplets Accumulation via Decreasing Acetyl-Coa Supply and Accelerating Energy Metabolism in Cultured Primary Chicken Hepatocytes, Cell. Physiol. Biochem., 2017, 43, 812–831 CrossRef CAS PubMed.
- K. Hayamizu, et al., Effects of Garcinia cambogia (Hydroxycitric Acid) on Visceral Fat Accumulation: A Double-Blind, Randomized, Placebo-Controlled Trial, Curr. Ther. Res., 2003, 64(8), 551–567 CrossRef CAS PubMed.
- H. G. Preuss, et al., Effects of a natural extract of (-)-hydroxycitric acid (HCA-SX) and a combination of HCA-SX plus niacin-bound chromium and Gymnema sylvestre extract on weight loss, Diabetes, Obes. Metab., 2004, 6, 171–180 CrossRef CAS PubMed.
- T. Opala, P. Rzymski, I. Pischel, M. Wilczak and J. Wozniak, Efficacy of 12 weeks supplementation of a botanical extract-based weight loss formula on body weight, body composition and blood chemistry in healthy, overweight subjects - a randomised double-blind placebo-controlled clinical trial, Eur. J. Med.Res., 2006, 11, 343–350 CAS.
- S. B. Heymsfield, et al., Garcinia cambogia (hydroxycitric acid) as a potential antiobesity agent: a randomized controlled trial, J. Am. Med. Assoc., 1998, 280(18), 1596–1600 CrossRef CAS PubMed.
- M. Saito, et al., High dose of Garcinia cambogia is effective in suppressing fat accumulation in developing male Zucker obese rats, but highly toxic to the testis, Food Chem. Toxicol., 2005, 43, 411–419 CrossRef CAS PubMed.
- P. R. Somvanshi, A. K. Patel, S. Bhartiya and K. V. Venkatesh, Influence of plasma macronutrient levels on hepatic metabolism: role of regulatory networks in homeostasis and disease states, RSC Adv., 2016, 6, 14344–14371 RSC.
- K. D. Hall, et al., Quantification of the effect of energy imbalance on bodyweight, Lancet, 2011, 378, 826–837 CrossRef.
- P. R. Somvanshi, A. K. Patel, S. Bhartiya and K. V. Venkatesh, Influence of plasma macronutrient levels on hepatic metabolism: role of regulatory networks in homeostasis and disease states, RSC Adv., 2016, 6(17), 14344–14371 RSC.
- J. Hu, A. Komakula and M. E. Fraser, Binding of hydroxycitrate to human ATP-citrate lyase, Acta Crystallogr., Sect. D: Struct. Biol., 2017, 73(8), 660–671 CrossRef CAS PubMed.
- D. W. Foster, Malonyl-CoA: the regulator of fatty acid synthesis and oxidation, J. Clin. Invest., 2012, 122(6), 1958–1959 CrossRef CAS PubMed.
- B. S. Jena, G. K. Jayaprakasha, R. P. Singh and K. K. Sakariah, Chemistry and biochemistry of (−)-hydroxycitric acid from Garcinia, J. Agric. Food Chem., 2002, 50(1), 10–22 CrossRef CAS PubMed.
- R. V. Geetha, T. Lakshmi and A. Roy, Garcinia cambogia (Malabar Tamarind): A Pharmacological Review, J. Pharm. Res., 2011, 4(5), 1464–1466 Search PubMed.
- A. S. Koshy and N. R. Vijayalakshmi, Impact of certain flavonoids on lipid profiles potential action of Garcinia cambogia flavonoids, Phytother. Res., 2001, 15(5), 395–400 CrossRef CAS PubMed.
- C. A. R. Vasques, et al., Hypolipemic effect of garcinia cambogia in obese women, Phytother. Res., 2014, 28(6), 887–891 CrossRef PubMed.
- M. L. Peng, J. Han, L. L. Li and H. T. Ma, Metabolomics reveals the mechanism of (−)-hydroxycitric acid promotion of protein synthesis and inhibition of fatty acid synthesis in broiler chickens, Animal, 2018, 12(4), 774–783 CrossRef CAS PubMed.
- R. D. Mattes and L. Bormann, Effects of (−)-hydroxycitric acid on appetitive variables, Physiol. Behav., 2000, 71(1–2), 87–94 CrossRef CAS PubMed.
- J. B. Rosenmeier, G. G. Yegutkin and J. González-Alonso, Activation of ATP/UTP-selective receptors increases blood flow and blunts sympathetic vasoconstriction in human skeletal muscle, J Physiol, 2008, 586(20), 4993–5002 CrossRef CAS PubMed.
- N. Tentolouris and N. Katsilambros, Diabetic Ketoacidosis in Adults, in Diabetic Emergencies: Diagnosis and Clinical Management, 2011, DOI:10.1002/9781119971825.ch1.
- K. S. Kamel and M. L. Halperin, Acid–Base Problems in Diabetic Ketoacidosis, N. Engl. J. Med., 2015, 372(6), 546–554 CrossRef PubMed.
- J. W. Li and P. Bordelon, Hydroxycitric acid dietary supplement-related herbal nephropathy, Am. J. Med., 2011, 124(11), e5–e6 CrossRef PubMed.
- S. Dehoney and M. Wellein, Rhabdomyolysis associated with the nutritional supplement Hydroxycut, Am. J. Health-Syst. Pharm., 2009, 66(2), 142–148 CrossRef CAS PubMed.
- G. Crescioli, et al., Acute liver injury following Garcinia cambogia weight-loss supplementation: case series and literature review, Intern. Emerg. Med., 2018, 13(6), 857–872 CrossRef PubMed.
- N. E. Sunny, et al., Progressive adaptation of hepatic ketogenesis in mice fed a high-fat diet, Am. J. Physiol.: Endocrinol. Metab., 2010, 298(6), E1226–E1235 CrossRef CAS PubMed.
- I. S. Cheng, et al., Oral hydroxycitrate supplementation enhances glycogen synthesis in exercised human skeletal muscle, Br. J. Nutr., 2012, 107(7), 1048–1055 CrossRef CAS PubMed.
Footnote |
| † Electronic supplementary information (ESI) available. See DOI: 10.1039/c9ra01345h |
| This journal is © The Royal Society of Chemistry 2019 |

