 Open Access Article
Creative Commons Attribution 3.0 Unported Licence
The effect of oxidant species on direct, non-syngas conversion of methane to methanol over an FePO4 catalyst material†
Venkata D. B. C.
Dasireddy
 *a,
Darko
Hanzel
b,
Krish
Bharuth-Ram
cd and
Blaž
Likozar
a
aDepartment of Catalysis and Chemical Reaction Engineering, National Institute of Chemistry, Hajdrihova 19, 1001 Ljubljana, Slovenia. E-mail: dasireddy@ki.si; Fax: +386 1 4760300; Tel: +386 1 4760504
bDepartment of Low and Medium Energy Physics, “Jozef Stefan” Institute, Jamova cesta 39, 1000 Ljubljana, Slovenia
cPhysics Department, Durban University of Technology, Durban 4000, South Africa
dSchool of Chemistry and Physcis, University of KwaZulu Natal, Durban 4000, South Africa
First published on 30th September 2019
Abstract
The effect of the phase transformation of a FePO4 catalyst material from the tridymite-like (tdm) FePO4 to the α-domain (α-Fe3(P2O7)2) during the direct selective oxidation of methane to methanol was studied using oxidant species O2, H2O and N2O. The main reaction products were CH3OH, carbon dioxide and carbon monoxide, whereas formaldehyde was produced in rather minute amounts. Results showed that the single-step non-syngas activation of CH4 to oxygenate(s) on a solid FePO4 phase-specific catalyst was influenced by the nature of the oxidizer used for the CH4 turnover. Fresh and activated FePO4 powder samples and their modified physicochemical surface and bulk properties, which affected the conversion and selectivity in the partial oxidation (POX) mechanism of CH4, were investigated. Temperature-programmed re-oxidation (TPRO) profiles indicated that the type of moieties utilised in the procedures, determined the re-oxidizing pathway of the reduced multiphase FePO4 system. Mössbauer spectroscopy measurements along with X-ray diffraction (XRD) examination of neat, hydrogenated and spent catalytic compounds, demonstrated a variation of the phosphate into a mixture of crystallites, which depended on operating process conditions (for example time-on-stream). The Mössbauer spectra revealed the change of the initial ferric orthophosphate, FePO4 (tdm), to the divalent metal form, iron(II) pyrophosphate (Fe2P2O7); thereafter, reactivity was governed by the interaction (strength) with individual oxidizing agents. The Fe3+ ↔ Fe2+ chemical redox cycle can play a key mechanistic role in tailored multistep design, while the advantage of iron-based heterogeneous catalysis primarily lies in being inexpensive and comprising non-critical raw resources. When compared to the other catalysts reported in the literature, the FePO4-tdm phase catalysts showed in this work exhibited a high activity towards methanol i.e., 12.3 × 10⁻³ μmolMeOH gcat h−1 using N2O as an oxidant. This catalyst also showed a high activity with O2 as an oxidant (5.3 × 10⁻³ μmolMeOH gcat h−1). Further investigations will include continuous reactor unit engineering optimisation.
1 Introduction
The direct conversion of methane to methanol has been attracting considerable attention because of its great potential application in the efficient utilization of abundant natural gas reserves. In the last decade a number of interesting approaches was suggested for the effective implementation of this difficult transformation.1 A most attractive approach is to convert the natural gas into products such as methanol, which under ambient temperature and pressure is a liquid.2 However, over the past few decades, the conversion of methane to methanol has remained as one of the major unrequited challenges in chemistry. To activate methane, usually high temperatures are required. At these temperatures, formed methanol undergoes further oxidation to CO2 and H2O, as illustrated below.3,4 | (1) |
Methanol is formed via methane oxidation by α-oxygen, CH4 + (Mn–O*−)α, migrated from α-oxygen sites. It is generally accepted that α-sites perform the oxidation via the reversible redox transition Mn ↔ Mn+1.3. Much of the work on the variety of catalysts that have been investigated for partial oxidation of methane to methanol has been summarized in recent literature reports.5–7 The majority of the studies involved supported metal oxide catalysts, primarily vanadium and molybdenum oxide.1,2 Higher activity and selectivity to the desired products over mixed metal oxide catalysts can be attributed to the formation of easily reducible metal oxide species caused by interactions between the metals. Loading of supported phase below the monolayer coverage has been shown to be preferable for the high production of formaldehyde and methanol from methane.8,9 Otsuka et al.1,10 reported that the conversion of methane is accelerated by co-feeding hydrogen with oxygen over several iron containing catalysts. The co-feeding of hydrogen induces the formation of methanol over FePO4, FeAsO4 and FAPO-5 (Fe![[thin space (1/6-em)]](https://www.rsc.org/images/entities/char_2009.gif) :
:![[thin space (1/6-em)]](https://www.rsc.org/images/entities/char_2009.gif) Al
Al![[thin space (1/6-em)]](https://www.rsc.org/images/entities/char_2009.gif) :
:![[thin space (1/6-em)]](https://www.rsc.org/images/entities/char_2009.gif) P = 0.1
P = 0.1![[thin space (1/6-em)]](https://www.rsc.org/images/entities/char_2009.gif) :
:![[thin space (1/6-em)]](https://www.rsc.org/images/entities/char_2009.gif) 0.9
0.9![[thin space (1/6-em)]](https://www.rsc.org/images/entities/char_2009.gif) :
:![[thin space (1/6-em)]](https://www.rsc.org/images/entities/char_2009.gif) 1.0) catalysts at atmospheric pressure and in the temperature range of 350–500 °C. Thus, in order to design a better catalyst, it is quite important to understand which the effective and/or ineffective iron sites are in the selective oxidation of methane to methanol.
1.0) catalysts at atmospheric pressure and in the temperature range of 350–500 °C. Thus, in order to design a better catalyst, it is quite important to understand which the effective and/or ineffective iron sites are in the selective oxidation of methane to methanol.
A low temperature (150 °C), isothermal, gas-phase recyclable process was described for the partial oxidation of methane to methanol over Cu/ZSM-5 by Sheppard et al.,11 which showed a stable formation of methanol for a long period of time. Depending on the iron content and activation conditions, a variety of Fe species may be available in the zeolite, ranging from isolated Fe(II) and Fe(III) cations and oligo-nuclear Fe complexes up to large agglomerates of iron oxide. FeZSM-5 zeolites have a long application history as catalysts for oxidations by N2O.3,4,12 Methanol and dimethyl ether (DME) were the products extracted from the catalytic surface. Co-feeding water strongly increased methanol selectivity, which attained a fractional concentration of 62% at 275 °C. The location, dispersion and environment (acidic or alkaline) of iron sites and the nature of oxidant are key factors in determining the catalytic performances of iron-containing mesoporous materials for selective oxidation reactions.13,14 Shiota and Yoshizawa15 have computed and analysed the reactions of the first row MO+ complexes (M = Sc, Ti, V, Cr, Mn, Fe, Co, Ni and Cu) and methane, which can competitively form methanol and methyl radical. Anderson et al.16 carried out a systematic study of the conversion of methane using a number of metal oxide catalysts. They demonstrated that cobalt oxide is the most active single component catalyst which resulted in a high conversion, but with a very low selectivity towards methanol synthesis.
Štolcová and co-workers17,18 examined the influence of structure and reactivity of copper iron pyrophosphate catalysts for the selective oxidation of methane using O2 and N2O as oxidizing agents. These oxidants showed appreciable impact on the onset of both methane conversion and the primary oxidation products. The catalytic results showed that the lattice oxygen of the catalyst could react with methane molecules producing methanol and that replenishment of the lattice oxygen by N2O takes places rather readily and rapidly. Wang et al.13 showed the use of N2O oxidant for the epoxidation of C3H6 over iron-containing catalysts. Iron is peculiar for obtaining high selectivity to propylene oxide, and the modification of the iron sites with an alkali metal salt can promote the C3H6 epoxidation. Christos et al.19 have shown that the reactivity of commercial zeolite-based catalysts containing Fe and/or Cu cations for the partial oxidation of methane is influenced by the acid sites strength and concentration in the catalyst which depends on the Si/Al molar ratio and type of zeolite. It was shown that the Fe cations are responsible for the superior oxygenates productivity, while the crucial role of Cu is to maintain high MeOH selectivity by suppressing the production of the deeper oxidation product, HCOOH. Partial oxidation of methane over iron phosphate supported on silica produced high formaldehyde yields.17,20 In the literature,18,21 it has been shown that the nature of the oxidant, however, was observed to play a vital role in favoring yield towards methanol. In line with the state of the art direct conversion of methane to methanol, we have undertaken this work with the aim to investigate which of the oxidant species, O2, H2O or N2O, would lead to achieving a high yield of methanol over FePO4 catalysts. As an attempt to achieve this objective, an ammonia gel method was employed to synthesize FePO4 catalyst, the resulting catalyst structures were then revealed by different characterisation techniques and the influence of oxidants on the structure and phase of FePO4 during the reaction was examined.
2. Experiment
2.1 Synthesis of the catalyst
The catalysts were synthesized by the ammonia gel method described by Friedrich et al.22–24 This catalytic preparation methodology was chosen because of its simplicity and to achieve a better control of particle size and morphology of the active phase. In essence, an appropriate amount of ferric nitrate, Fe(NO3)3·9H2O (99%, Sigma Aldrich) was dissolved in water and then a dilute ammonium solution (25% NH3 in H2O, Sigma Aldrich) was added. This led to precipitation and formation of iron(III) hydroxide (brown gel). Orthophosphoric acid (85% H3PO4, Sigma Aldrich) was added while stirring the gel, followed by a 40 wt% silica solution. The stirred mixture was then heated to 60 °C and kept at this temperature for 2 h. The obtained gel was heated at 90 °C for 12 h, and the dried solid achieved was then calcined at a temperature 500 °C for 4 h in a 2 bar flow of air.2.2 Characterization of catalysts
The characterizations of fresh and used catalysts are described below. Nitrogen physisorption analyses were carried out by degassing the catalysts under N2 flow for 4 h at 200 °C. The degassed samples were analysed in the Micromeritics ASAP 2020 multi-point surface area and porosity analyser. Powder X-ray diffraction (XRD) studies were conducted using the PANalytical X'Pert Pro instrument. Scanning from 10 to 90° was carried out using the CuKα-radiation source with the wavelength of 0.15406 nm. Temperature programmed reduction-oxidation (TPRO) was performed using the Micromeritics 2920 Autochem II Chemisorption Analyser. Initially, the reduction of the catalyst was done using 4.9 mol% H2 in Ar as a reducing agent as in the method described in.25,26 Temperature programmed desorption (TPD) was carried out using the Micromeritics 2920 Autochem II Chemisorption Analyser as well. After reduction, the catalysts were pre-treated at 350 °C under the stream of helium for 60 min. The temperature was consequently decreased to 80 °C. Appropriate pre-chosen gas was passed over the catalysts (10 mol% CO2 in He or 4.9 mol% H2 in Ar) at the flow rate of 30 mL min−1 for 60 min. The excess gas was removed by purging with helium for 30 min. The temperature was thereafter gradually raised to 900 °C by ramping at 10 °C min−1 under the flow of helium, wherein the desorption data of CO2 or H2 was recorded. The desorption data of O2, H2O and N2O were also recorded in the same procedure. Metal dispersion is calculated using CO chemisorption which is illustrated in literature24,26The structural morphology of the prepared catalysts was studied using field-emission scanning electron microscope (Carl Zeiss, FE-SEM SUPRA 35VP), equipped with energy-dispersive X-ray spectroscopy hardware (Oxford Instruments, model INCA 400). Particle size, morphology and elemental mapping performed by EDXS analyses were investigated using Cs corrected scanning transmission electron microscope JEOL ARM 200 CF equipped with JEOL Centurio 100 mm2 EDXS system. 57Fe-Mössbauer spectroscopy measurements were made at room temperature (RT) in conventional transmission geometry with a 57Co source embedded in Rh matrix.
2.3 Partial oxidation of methane
The catalytic partial oxidation runs using the FePO4 catalysts were carried out in a horizontal fixed-bed U-shaped quartz reactor as described in.27,28 The catalyst (∼0.4 g) was placed in the middle of the reactor and a flow of N2 (30 mL min−1) was introduced into the reactor at a temperature of 200 °C in order to remove the physisorbed gases from the surface of the catalyst. The catalytic runs were carried out under atmospheric pressure at the temperature range of 200–500 °C using undiluted high purity CH4 (99.95%) and the appropriate oxidant (O2, N2O or H2O) at flow rate of 60 mL min−1, corresponding to the gas hour space velocity (GHSV) of 3600 h−1 with a methane to oxidant ratio of 1![[thin space (1/6-em)]](https://www.rsc.org/images/entities/char_2009.gif) :
:![[thin space (1/6-em)]](https://www.rsc.org/images/entities/char_2009.gif) 1. The gas products were analysed using an Agilent 490 Micro GC TCD equipped with CP-Molsieve and PoraPolt U columns. Reported values are given after 5 h of the reaction under steady-state conditions. The product mixture including methane, methanol, carbon oxides and nitrogen were analysed by online quadrupole mass spectrometry (MS). The signals in the MS are calibrated with different mole fractions of methane, methanol, carbon oxides and nitrogen in order to determine the mole composition of gases in the outflow. No other gaseous products were detected during the reaction. All the data points were recorded in duplicate with a standard deviation of ± 2%. The carbon mass balances are in the range of 98–99%.
1. The gas products were analysed using an Agilent 490 Micro GC TCD equipped with CP-Molsieve and PoraPolt U columns. Reported values are given after 5 h of the reaction under steady-state conditions. The product mixture including methane, methanol, carbon oxides and nitrogen were analysed by online quadrupole mass spectrometry (MS). The signals in the MS are calibrated with different mole fractions of methane, methanol, carbon oxides and nitrogen in order to determine the mole composition of gases in the outflow. No other gaseous products were detected during the reaction. All the data points were recorded in duplicate with a standard deviation of ± 2%. The carbon mass balances are in the range of 98–99%.
The methane conversion (δ) was calculated using the following equation:
3 Results and discussion
The effect of reaction temperature on methane conversion over FePO4 catalyst with different oxidative environments was investigated as shown in Fig. 1. Methane conversion with N2O and O2 increases with temperature; however when H2O is used as an oxidant, methane conversion increases at much lower linear rate with temperature. Furthermore, the maximum methane conversion (17%) was obtained when oxygen is used as an oxidant at a temperature of 500 °C, the highest reaction temperature in this study. The differences in conversion rates clearly show that selective oxidation of methane on FePO4 is influenced by the nature of the oxidant. These facts strongly suggest that the reaction mechanisms are different.29 This conclusion is strengthened by the greater conversions with O2 than N2O, which is in agreement with the reaction thermodynamics and the activation energy differences between these two oxidants.1 This means that there exists a lower kinetic barrier for O2 than N2O in catalytic selective oxidation of methane.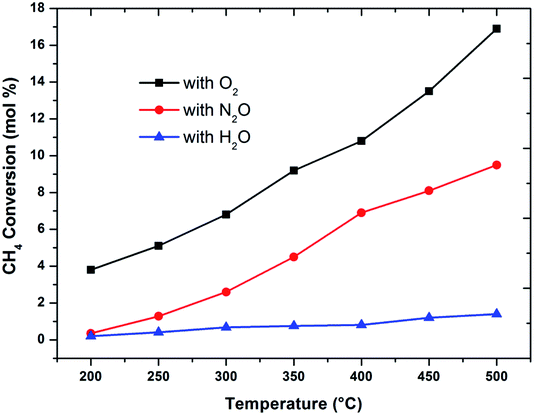 | ||
Fig. 1 Influence of oxidant on methane conversion over FePO4 catalyst with varying temperature (GHSV = 3600 h−1 and methane to oxidant ratio of 1![[thin space (1/6-em)]](https://www.rsc.org/images/entities/char_2009.gif) : :![[thin space (1/6-em)]](https://www.rsc.org/images/entities/char_2009.gif) 1). 1). | ||
When considering the effect of temperature on the methane conversion, two factors need to be considered. Firstly, methane conversion will depend on the oxidant feed concentration, secondly, even if total oxidant consumption occurs, methane conversion can change with a change in selectivity. Most of the studies2,3,11,18,30,31 reported in literature have examined the effect of temperature over a range varying from approximately 300 to 500 °C. It has been found that very low conversion occurs until a critical temperature is reached, after which a very rapid rise in conversion is observed (Fig. 1). This usually corresponds to total oxidant consumption. Typically the products obtained in the partial oxidation of reaction consist of CH3OH, CO, CO2, HCHO and H2O. CO2 and H2O are formed initially at temperatures below 300 °C. At 400 °C both selectivity and yield of methanol are found to pass through a maximum before decreasing as the temperature is increased further (Fig. 2). Methanol formation is accompanied by the production of CO along with CO2 and H2O. It was generally found that increasing the temperature well above the self-ignition temperature of methanol favors the production of CO, CO2 and H2O at the expense of methanol.1,10,18
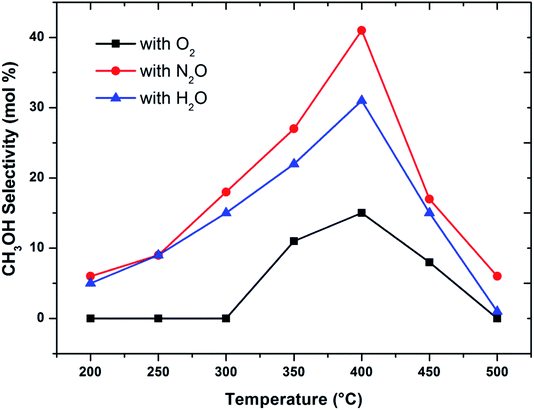 | ||
Fig. 2 Influence of oxidant on CH3OH selectivity in methane partial oxidation reaction over FePO4 catalyst with varying temperature (GHSV = 3600 h−1 and methane to oxidant ratio of 1![[thin space (1/6-em)]](https://www.rsc.org/images/entities/char_2009.gif) : :![[thin space (1/6-em)]](https://www.rsc.org/images/entities/char_2009.gif) 1). 1). | ||
To make a better comparison of catalytic performance among the oxidants, we further carried out the reactions with various flow rates between a GHSV of 2000 and 7000 h−1. The conversion of methane increased and the selectivity to methanol decreased with decrease in the flow rate as expected (ESI, Fig. S1†). From these data, the plot (Fig. 3) of methanol selectivity versus methane conversion was constructed. The selectivity towards methanol was very high at lower methane conversion at higher flow rate. However, when the comparison was made at higher methane conversion, the selectivity to methanol was the highest when N2O is used as oxidant. In addition to that, the selectivity of methanol at low conversions (<2%) of methane was almost identical (see first two data points at nearly 100% selectivity in Fig. 3). By elevating the reaction temperature at these conditions also, methanol selectivity gradually dropped and raised the CO production. This was a consequence of the low stability of methanol at higher temperatures and thereby it over oxidised to carbon oxides. It has been well recognized that the selective oxidation of methane proceeds via redox mechanism, but the pathways and product distribution depend on the nature of the oxidant and the reaction conditions.16,29
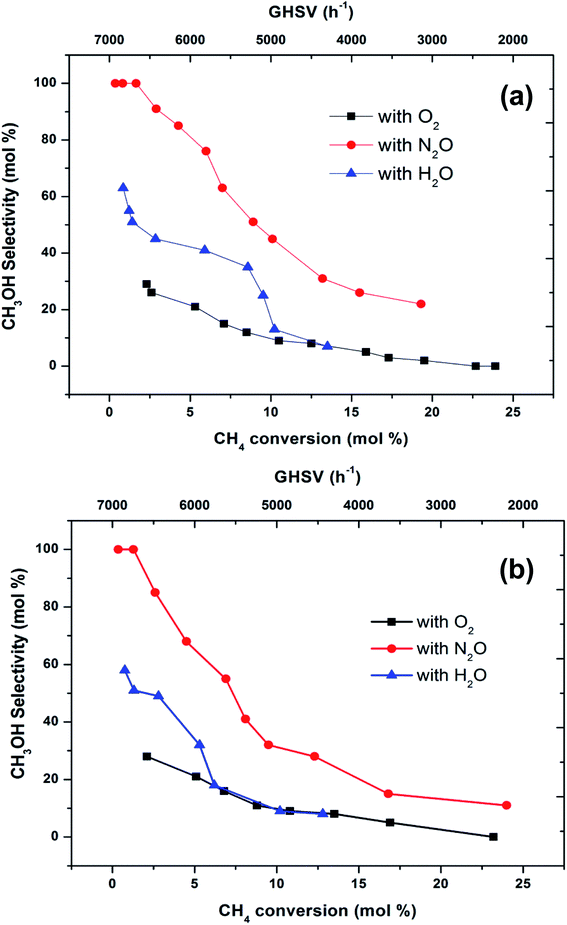 | ||
Fig. 3 Selectivity towards methanol varying with methane conversion over FePO4 catalyst at the temperatures of (a) 300 °C and (b) 400 °C (GHSV = 2000–7000 h−1, methane to oxidant ratio of 1![[thin space (1/6-em)]](https://www.rsc.org/images/entities/char_2009.gif) : :![[thin space (1/6-em)]](https://www.rsc.org/images/entities/char_2009.gif) 1). 1). | ||
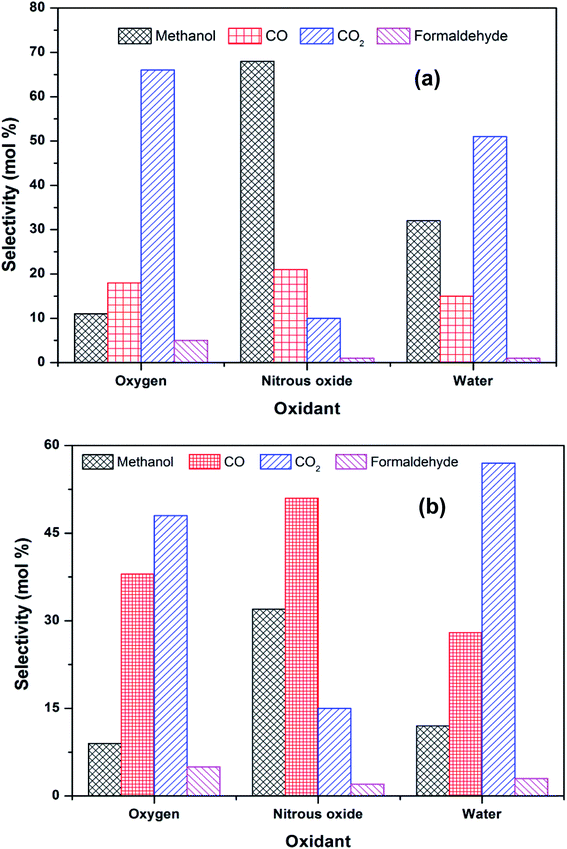
Activation of methane may occur by both hemolytic and heterolytic mechanisms.2,27 Thus the investigations of used catalysts of FePO4 might give an insight into the modified physicochemical properties of the catalysts which further influenced the conversion and selectivity in the partial oxidation of methane. The rate determining step would be the rupture of the C–H bond and the formation of CH3 and HO radicals were postulated as the initial step.1,29 For methane oxidation to methanol, the most strongly supported mechanism consists of consecutive conversion scheme as shown in eqn (1). The methoxy radical is an important intermediate in the reaction pathway.19 Elimination of hydrogen from methoxy radical in a reaction such as oxidative dehydrogenation gives formaldehyde which is easily converted to CO and CO2. Hydrogenation of the methoxy radical yields methanol.1 Stabilization of the methoxy radical by hydrogenation is a key step to achieve a high methanol yield.18Fig. 4 shows the selectivity towards products in the partial oxidation of methane at iso-conversions of 10% and 5%. At both iso-conversion conditions (similar conversions at the same temperature), methanol was formed in high quantity when N2O used as an oxidant. CO2 is the major product with both O2 and H2O. This could be either due to the further oxidation of methoxy radical to CO2 or the direct combustion of methane to CO2. On the other hand, when N2O was used, these effects were less systematic; the production rate of methanol was approximately doubled (Fig. 4). Using N2O, methanol selectivity was higher, with decreased CO2 selectivity. The catalytic differences have been ascribed to the differing oxidizing power of O2, N2O and H2O. In accordance with the Mars–van Krevelen mechanism,1,2,29 which has been proposed, the re-oxidation of the catalyst will be less effective with N2O and H2O compared to O2. At all conditions, formaldehyde is formed in very minor quantities, which could also be due to a secondary oxidation of formaldehyde to CO or CO2.
Fig. 5 shows the SEM images of FePO4 catalysts treated under various conditions. The fresh catalyst possesses rough crystalline morphology with a particle sizes ranging from 50–80 nm with a homogeneous dispersion of the particles. After reduction, the agglomeration of these particles was observed. After oxidation with oxygen the crystalline nature is retained with a separate agglomerated bulk particles. After oxidation with N2O and H2O, the catalysts showed a relatively poor crystalline structure and an amorphous like morphology (Fig. 5d and e). The BET surface areas, measured by the physical nitrogen adsorption for all of the samples, are presented in Table 1. The specific surface area of fresh FePO4 was found to be 19 m2 g−1. However, BET surface area decreased after reduction and oxidation treatments. After reduction, the surface area of the catalyst reduced drastically to 9 m2 g−1, due to the blocking of the pores of the FePO4 by the amorphous carbon which formed large crystallites, as evidenced by XRD and pore-size distribution measurements.
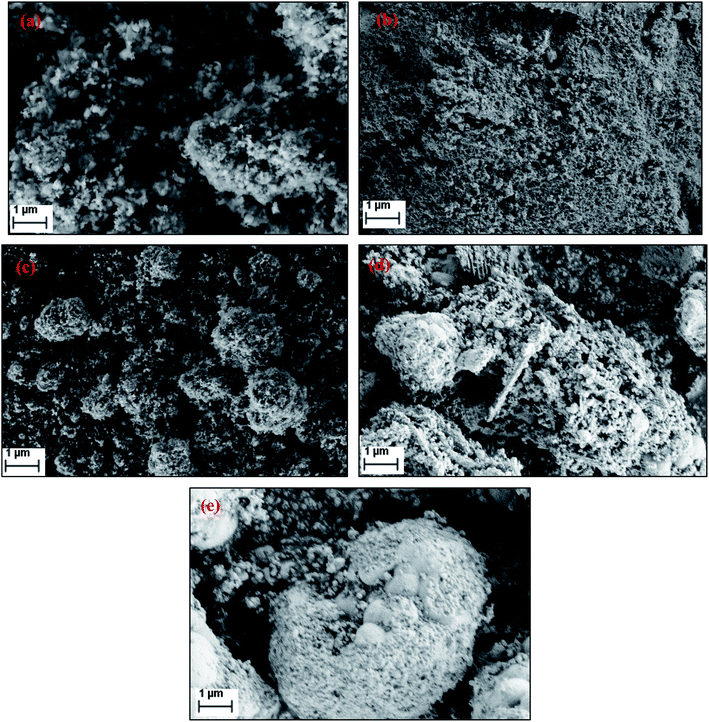 | ||
| Fig. 5 Scanning electron micrographs (SEM) of FePO4 catalysts under various conditions (a) fresh, (b) reduced under CH4, (c) oxidized with O2, (d) oxidized with N2O and (e) oxidized with H2O. | ||
| Catalyst condition | Surface area (m2 g−1) | Pore volume (cm3 g−1) | Metal dispersiona (%) | Crystallite sizeb (nm) |
|---|---|---|---|---|
| a Calculated from CO chemisorption32. b Average crystallite size calculated by Scherrer equation. | ||||
| Fresh | 19 | 0.021 | 27.8 | 28 |
| Reduced (with CH4) catalyst | 9 | 0.015 | 10.3 | 41 |
| Oxidized (with O2) catalyst | 15 | 0.020 | 22.3 | 32 |
| Oxidized (with N2O) catalyst | 12 | 0.019 | 17.3 | 35 |
| Oxidized (with H2O) catalyst | 13 | 0.018 | 15.8 | 35 |
The N2 adsorption–desorption isotherms of the fresh, reduced and oxidised catalysts (ESI, Fig. S2†) can be categorised as the type IV isotherms, with a distinct hysteresis loop, observed in the relative pressure (P/Po) range of 0.47–0.79.33 The pore-size distribution, calculated from the desorption counterpart using Barrett–Joyner–Halenda (BJH) method, showed a dominant peak in the mesoporous range (ESI, Fig. S3†). The metal dispersion of Fe species was calculated from CO chemisorption. Metal dispersion showed the similar trend to surface area, as the fresh catalyst showed a high metal dispersion compared to the reduced and oxidised catalysts. Among the oxidised catalysts, the catalyst oxidised with oxygen showed a higher metal dispersion compared to the catalysts oxidised with N2O or H2O. This could be due to the amount of available oxygen present in N2O or H2O. This shows that the nitrous oxide or water provides adequate oxidation of reduced sites of the catalyst. This may explain the fact that the number of active sites is altered and the nature of the active sites of the oxidised catalyst remained unchanged.
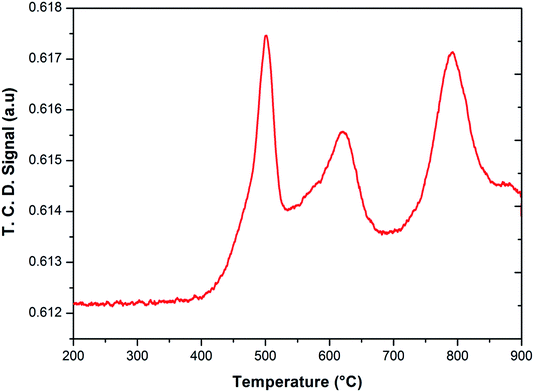
To investigate the phase transformations occurred during reduction and oxidation, powder XRD and Mössbauer analysis of the reduced and oxidized samples were carried out. The reduced sample was obtained using reducing the fresh FePO4 catalyst under 10% CH4 in Ar. In the TPR profile, the catalyst showed three peaks at the temperatures of 492, 625 and 815 °C (Fig. 6). These peaks represent reduction of FePO4 to Fe2P2O7 as suggested in:22,34
As reported in the literature,35,36 the first step in the reduction occurs above the temperatures of 500 °C. The use of CH4 as reductant in this study accelerated the reduction, probably due to the activation and spill over of hydrogen from the metal centers to the iron phosphate.
After the reduction, the oxidation was conducted using O2, N2O and H2O as oxidants (10% of oxidant in Ar), separately. The TPRO profile under H2O exhibited a very wide range of oxidation profile in the temperature ranging from 200–370 °C (Fig. 7). When N2O is used an oxidant, only one peak was exhibited and two peaks in the profile occurred with O2 as oxidant. There were no peaks observed above 500 °C, in the TPRO profiles. Various literature reports37,38 stated that the oxidative transformation of iron pyrophosphate phase to quartz phase occurs in two steps as below:
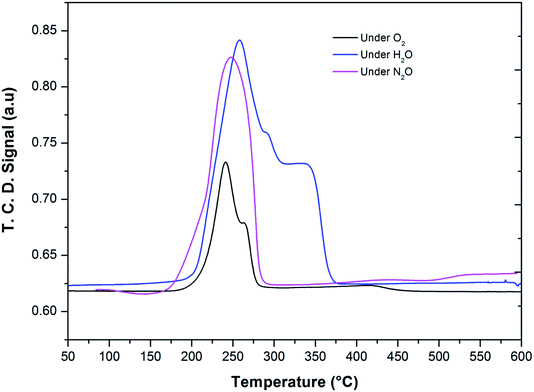 | ||
| Fig. 7 Temperature programmed reduction–oxidation (TPRO) profiles of FePO4 catalyst under various oxidant environments. | ||
The formation of the quartz type phase has been reported in the literature; however, it was formed at temperatures above 500 °C.39 However, it was also observed that the transformation between the α-phase and Fe2P2O7 is reversible. Thus, from TPRO profiles, it is evident that the type of oxidant used in the re-oxidation influenced the re-oxidation path way of reduced FePO4 catalyst. The powder XRD patterns of the fresh, reduced and oxidized catalysts are shown in Fig. 8.
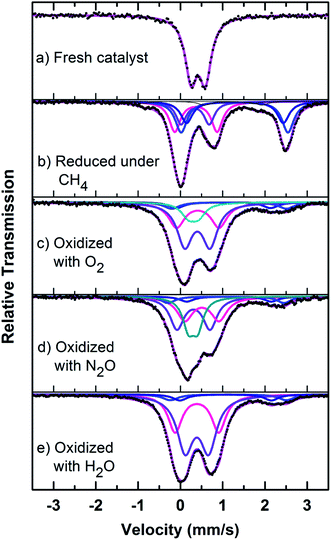 | ||
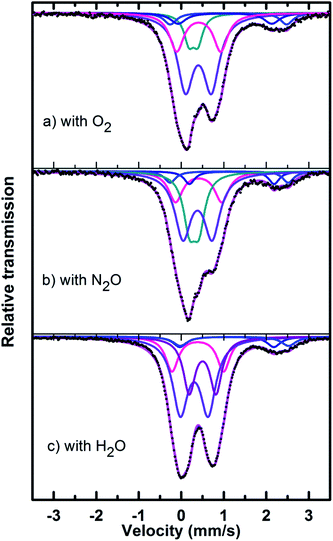
| Fig. 8 Mössbauer spectra of fresh, reduced (with CH4) and oxidized (with N2O, O2 and H2O) FePO4 catalyst. | ||
The fresh catalyst showed the presence of the FePO4 trydimite-like (tdm) phase by exhibiting a main peak at a 2θ = 34° and minor peaks in the range of 24–30°. The XRD pattern of the reduced catalyst (with methane) shows two distinct peaks at 2θ values of 24° and 30°, confirming the formation of the Fe2P2O7 phase range (ESI, Fig. S4†). The formation of this phase is also observed in literature22,37 when FePO4 is reduced under various hydrocarbon reduction atmospheres. When the reduced catalyst is oxidised in the presence of oxygen, the formation of the α-phase (α-Fe3(P2O7)2) is observed. The XRD profile of this catalyst showed two characteristic major peaks in the region of 2θ = 33–36° indicating the presence of α-phase (α-Fe3(P2O7)2) along with some minor peaks. Some of the XRD peaks in this region also coincide with peaks characteristic of the β-phase.22,37 The XRD profile of the catalyst oxidized with N2O also showed the presence of the α-phase along with Fe2P2O7 phase, but absence of the β-phase which would give a peak at 2θ = 36° range (ESI, Fig. S4†). Oxidation of the catalyst in H2O showed a similar pattern to the catalyst oxidized with oxygen, but with the notable absence of a peak at a 2θ = 28°, indicating the absence of the β-phase under H2O oxidation also. This could be due to a high oxidizing atmosphere being required for the formation of β-phase and the low oxidizing strength of H2O compared to O2.22,37
Mössbauer spectra of fresh, reduced (with CH4) and oxidized (with N2O, O2 and H2O) FePO4 catalysts are shown in Fig. 8. The spectra were corrected for thickness effects and then fitted with the analysis code RECOIL51 using Lorentzian line shapes for the spectral components. The spectral fit parameters (isomer shift (IS), electric quadrupole splitting (QS), line width (HWHM), area fractions (f)) and phase assignments are collected in Table 2 where the isomer shifts are given relative to α-Fe at room temperature. The phase assignments were made on the basis of parameters reported in ref. 36, 37 and 40–42.
| Sample | IS (mm s−1) | QS (mm s−1) | Γ (HWHM) (mm s−1) | Fe species | Area (%) | Attributed phase |
|---|---|---|---|---|---|---|
| a The isomer shifts are expressed relative to α-Fe at room temperature. | ||||||
| Fresh catalyst | 0.42(1) | 0.34(1) | 0.17 | Fe3+ | 100 | FePO4-tdm |
| Reduced with CH4 | 0.37(1) | 1.00(2) | 0.16 | Fe3+ | 25(2) | Fe7(PO4)6 |
| 0.35(8) | 0.67(8) | 0.15 | Fe3+ | 17(2) | FePO4-low quartz | |
| 1.28(7) | 2.53(8) | 0.17 | Fe2+ | 27(4) | Fe2P2O7 | |
| 1.29(1) | 2.29(4) | 0.17 | Fe2+ | 19(1) | ||
| 1.25(3) | 1.35(7) | 0.17 | Fe2+ | 3(1) | ||
| Oxidized with O2 | 0.41(6) | 1.01(6) | 0.23 | Fe3+ | 28(4) | α-Fe3(P2O7)2 |
| 0.40(1) | 0.60(3) | 0.22 | Fe3+ | 46(4) | ||
| 1.02(8) | 2.23(9) | 0.21 | Fe2+ | 6(1) | Fe2P2O7 | |
| 1.15(4) | 2.71(9) | 0.22 | Fe2+ | 7(1) | ||
| 0.31(1) | 0.24(5) | 0.20 | Fe3+ | 13(2) | FePO4-tdm | |
| Oxidized with N2O | 0.31(1) | 0.78(1) | 0.20 | Fe3+ | 34(3) | α-Fe3(P2O7)2 |
| 0.51(2) | 0.81(2) | 0.23 | Fe3+ | 29(3) | ||
| 1.15(2) | 2.00(5) | 0.20 | Fe2+ | 6(1) | Fe2P2O7 | |
| 1.08(2) | 2.74(6) | 0.20 | Fe2+ | 7(1) | ||
| 0.30(1) | 0.22(3) | 0.16 | Fe3+ | 24(1) | FePO4-tdm | |
| Oxidized with H2O | 0.39(1) | 1.03(1) | 0.20 | Fe3+ | 33(1) | α-Fe3(P2O7)2 |
| 0.39(1) | 0.56(1) | 0.23 | Fe3+ | 56(2) | ||
| 1.14(2) | 2.75(5) | 0.22 | Fe2+ | 6(1) | Fe2P2O7 | |
| 1.07(3) | 2.16(6) | 0.20 | Fe2+ | 5(1) | ||
The phase parameters of the fresh catalyst confirm that only the FePO4-tdm phase is present in the catalyst, in agreement with literature and previous work.23,24,37 Two Fe2+ species which are observed after the reduction of the fresh catalyst under methane at 500 °C, are attributable to the Fe2P2O7 phase.22 A 17% contribution from a FePO4 low quartz phase is evident, most likely the result of the unreduced phase present in the catalyst.37 The effect of oxygen atmosphere on the phase formation is reflected by the Mössbauer spectrum for the O2 oxidized catalyst (Fig. 8), which shows a 74% spectral area due to a Fe3+ iron phase and a weaker Fe2+ component with IS of 1.15 mm s−1 and QS of 2.71 mm s−1. These values are in accordance with the values of Fe3+ and Fe2+ components in the α-phase of the catalyst, α-Fe3(P2O7)2. The XRD profile of the catalyst also supports this assignment. In addition, a trydimite like FePO4 phase is observed with a spectral area of 13%.
The Mössbauer spectrum obtained for the oxidized catalyst with N2O (Fig. 8), showed a 12% contribution from components with IS and QS values characteristic of Fe2+ (Fig. 9 and Table 2) which can be assigned to the Fe2P2O7 phase. In addition, the spectrum showed a 18% Fe3+ component with parameters corresponding to the α-phase together with a mixture of 44% Fe2+ in the Fe2P2O7 phase. A Fe3+ species, with IS and QS values which were not characteristic of a typical FePO4-tdm phase in the oxidized catalyst, with a 26% site fraction is observed.22,37 The Mössbauer spectrum of the catalyst oxidized with H2O, showed Fe2+ components with a combined 11% intensity, which can be assigned to the Fe2P2O7 phase. The spectrum also shows the presence of the Fe3+ species with a 88% site fraction (Fig. 10). The respective IS and QS values of this ferric species are in agreement with the Fe3+ species in the various iron phosphate type phases, namely the α-phase.20,22,23
In the Powder XRD diffractogram of the used catalyst after the reaction with O2 atmosphere, two major peaks are evident at 34.2° and 35.1° which can be attributed to the Fe2P2O7 phase, but this region also coincides with an overlap of the most intense peak of the α-phase.20,37 In the Mössbauer data of the used catalysts (Fig. 10), the α-Fe3(P2O7)2 phase, with a Fe3+ spectral component, was the dominant phase (74%). The appearance of the Fe2P2O7 phase was also observed, with ferric and ferrous species each contributing towards an 11% total site fraction.43 The formation of the α-phase results from the transformation between the FePO4-tdm and Fe2P2O7 phases, which takes place reversibly, depending on strength of the redox atmosphere20,23 and the fact that the α-Fe3(P2O7)2 phase is a mixed ferric and ferrous pyrophosphate consisting of both Fe4(P2O7)3 and Fe2P2O7.37,43
The diffractogram obtained for the used catalyst after the reaction with N2O (ESI, Fig. S5†), showed an intense, sharp peak at 2θ = 34.5°. The Mössbauer data (Fig. 10) for the used catalyst after the reaction with N2O showed typical of Fe3+ species (88%) and a Fe2+ species (12%) with parameters which correlate with the FePO4-low quartz and Fe7(PO4)6 phases. In addition, there is a component (22%) with IS and QS values corresponding to Fe2+ which we identified as Fe2P2O7 phase. These results showed an enhancement towards the α-phase after reaction with N2O atmosphere. The absence of the β-phase during the oxidation reactions has been observed in previous studies, especially during the oxidative dehydrogenation of isobutyric acid with a water co-feed over FePO4 catalyst.22,23,43 In literature, it has been reported that an FePO4 catalyst consisting of the quartz type phase as the precursor, undergoes phase transformation during a catalytic reaction involving the oxidative dehydrogenation of isobutyric acid to form Fe7(PO4)6 and the α-phase (Table 3).18,23
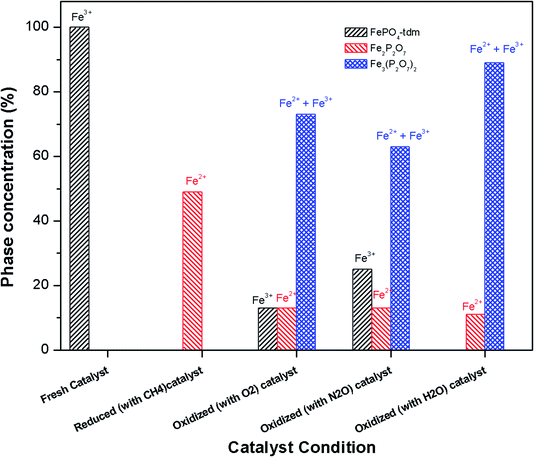 | ||
| Fig. 9 Phase quantification of fresh, reduced (with CH4) and oxidized (with N2O, O2 and H2O) FePO4 catalyst determined from the Mössbauer spectra shown in Fig. 8. | ||
| Oxidizing atmosphere | IS (mm s−1) | QS (mm s−1) | Γ (HWHM) (mm s−1) | Fe species | Area(%) | Attributed phase |
|---|---|---|---|---|---|---|
| a The isomer shifts are expressed relative to α-Fe at room temperature. | ||||||
| O2 | 0.40(1) | 0.61(2) | 0.23 | Fe3+ | 51(2) | α-Fe3(P2O7)2 |
| 0.41(2) | 1.04(2) | 0.20 | Fe2+ | 23(2) | ||
| 1.03(8) | 2.20(5) | 0.25 | Fe2+ | 7(1) | Fe2P2O7 | |
| 1.11(4) | 2.74(4) | 0.18 | Fe2+ | 5(1) | ||
| 0.29(1) | 0.21(2) | 0.14 | Fe3+ | 12(2) | FePO4-tdm | |
| N2O | 0.38(1) | 0.68(3) | 0.23 | Fe3+ | 44(3) | Fe7(PO4)6 |
| 0.40(2) | 1.09(3) | 0.20 | Fe3+ | 18(3) | FePO4-low quartz | |
| 1.19(4) | 2.00(5) | 0.15 | Fe2+ | 6(1) | Fe2P2O7 | |
| 1.13(2) | 2.78(4) | 0.16 | Fe2+ | 6(1) | ||
| 0.30(1) | 0.22(8) | 0.17 | Fe3+ | 26(1) | FePO4-tdm | |
| H2O | 0.30(1) | 0.65(5) | 0.22 | Fe3+ | 45(2) | α-Fe3(P2O7)2 |
| 0.50(1) | 0.63(1) | 0.17 | Fe3+ | 26(1) | α-Fe3(P2O7)2 | |
| 0.39(1) | 1.20(2) | 0.18 | Fe2+ | 17(2) | ||
| 1.14(2) | 2.75(5) | 0.22 | Fe2+ | 6(1) | Fe2P2O7 | |
| 1.25(3) | 2.54(8) | 0.20 | Fe2+ | 5(1) | ||
The diffractogram of the used catalyst using H2O as an oxidant showed the presence of Fe2P2O7 phase along with α-phase. The Mössbauer spectrum, after using H2O as an oxidant (Fig. 10), showed Fe2+ and Fe3+ components with a relative intensities of 11% and 71% (Fig. 11), which can be assigned to the α-Fe3(P2O7)2 phase.20,22,23 Similar to the catalyst obtained after reaction under N2O atmosphere, no evidence of β-phase was observed after the reaction with H2O also.17,18,24 It has been reported that formation of the β-phase is dependent on the catalyst structure and redox atmosphere.43,44 Obviously, water plays a role in avoiding high reduction atmospheres. Similar observation was reported in literature,22,37 that the addition of the water co-feed in the reaction, blocks the formation of the less selective β-phase. In summary, the XRD and Mössbauer spectra of the fresh and used catalysts oxidized in the presence of N2O and H2O showed that the α-phase was formed in high quantity22 when the formation of β-phase was suppressed.
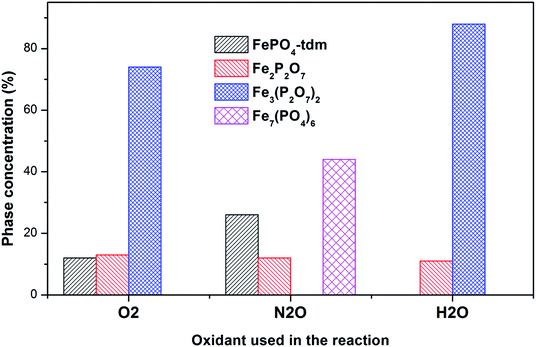 | ||
| Fig. 11 Phase quantification of used catalysts after reaction with O2, N2O and H2O, determined from the Mössbauer spectra. | ||
Panov et al.3,12 assessed the methane partial oxidation by nitrous oxide in the processes in which the α-oxygen sites were created at 160 °C temperature over FeZSM-5 zeolite. They discovered that the reactions occur through a hydrogen abstraction mechanism, making methoxy or hydroxy groups bounded to the α-sites. When the same reaction is performed with heating to 160 °C, they verified that at CH4![[thin space (1/6-em)]](https://www.rsc.org/images/entities/char_2009.gif) :
:![[thin space (1/6-em)]](https://www.rsc.org/images/entities/char_2009.gif) N2O molar ratio equal to 1
N2O molar ratio equal to 1![[thin space (1/6-em)]](https://www.rsc.org/images/entities/char_2009.gif) :
:![[thin space (1/6-em)]](https://www.rsc.org/images/entities/char_2009.gif) 1, the reactions directly provide methanol. Wood et al. studied the mechanism of “catalytic” oxidation reactions of methane by nitrous oxide over Fe-ZSM-5 zeolite, and concluded that the primary products of methane oxidation are methoxy groups bounded to active iron (i.e., Fe–OCH3). As can be seen, the Fe2+ cations of α-sites are activated by nitrous oxide generating adsorbed oxidant species (i.e., Fe3+–O˙−)α-sites, which convert methane to adsorbed methanol. Afterwards, adsorbed methanol can be converted to dimethyl ether and water. Beznis et al.45 assessed the activity of Co–ZSM-5 solid catalysts on reactions of partial oxidation of methane. They found that methanol production proportionally increased in relation to surface area of catalyst, which can be increased treating the catalyst with NaOH. These authors discovered that the active sites (i.e., cobalt oxidic species, such as Co3O4 and CoO, present on catalyst external surface) were also proportionally formed in relation to surface area of solid catalyst. In the presence of N2O, CH4 would be oxidized by peroxo species MO2 formed by the reaction of N2O with a Fe
1, the reactions directly provide methanol. Wood et al. studied the mechanism of “catalytic” oxidation reactions of methane by nitrous oxide over Fe-ZSM-5 zeolite, and concluded that the primary products of methane oxidation are methoxy groups bounded to active iron (i.e., Fe–OCH3). As can be seen, the Fe2+ cations of α-sites are activated by nitrous oxide generating adsorbed oxidant species (i.e., Fe3+–O˙−)α-sites, which convert methane to adsorbed methanol. Afterwards, adsorbed methanol can be converted to dimethyl ether and water. Beznis et al.45 assessed the activity of Co–ZSM-5 solid catalysts on reactions of partial oxidation of methane. They found that methanol production proportionally increased in relation to surface area of catalyst, which can be increased treating the catalyst with NaOH. These authors discovered that the active sites (i.e., cobalt oxidic species, such as Co3O4 and CoO, present on catalyst external surface) were also proportionally formed in relation to surface area of solid catalyst. In the presence of N2O, CH4 would be oxidized by peroxo species MO2 formed by the reaction of N2O with a Fe![[double bond, length as m-dash]](https://www.rsc.org/images/entities/char_e001.gif) O centre. Fe
O centre. Fe![[double bond, length as m-dash]](https://www.rsc.org/images/entities/char_e001.gif) O centres may be the active sites for methanol formation.3,17,46 The kinetic results obtained on the oxidation of CH4 by N2O showed that carbon oxides are probably primary products and may also stem from methanol or formaldehyde as secondary products. The direct pathway to carbon oxides could be ascribed to the existence of surface sites where the intermediate oxygenates expected are strongly attached and not allowed to desorb in the gas phase. In contrast, formation of methanol or formaldehyde would rather correspond to oxygenate precursors more easily desorbed because less retained at the catalyst surface.
O centres may be the active sites for methanol formation.3,17,46 The kinetic results obtained on the oxidation of CH4 by N2O showed that carbon oxides are probably primary products and may also stem from methanol or formaldehyde as secondary products. The direct pathway to carbon oxides could be ascribed to the existence of surface sites where the intermediate oxygenates expected are strongly attached and not allowed to desorb in the gas phase. In contrast, formation of methanol or formaldehyde would rather correspond to oxygenate precursors more easily desorbed because less retained at the catalyst surface.
In literature, it is well established that Fe based catalysts entail different chemical properties considering those of their other individual monometallic components, e.g. achieving the synergistic effects in methane activation reactions. In general, ZSM-5 catalysts show a higher activity for methane activation than other supports. Panov and co-workers3,4 showed the methane oxidation over Fe-ZSM-5 catalysts by N2O at 200 °C and showed that methanol that formed via methane oxidation by α-oxygen, CH4 + (FeIII–O˙−)α, migrated from α-sites, initiating new reaction cycles. At 200 °C, a 4 h run provided a turn over frequency (TOF) of 5.5 × 10⁻³ μmolMeOH gcat h−1. Beznis and co-workers45,47 showed that the selective activation of methane towards methanol over Co–ZSM-5 can be influenced by altering the micro-and meso-porosity of the zeolite material. They showed a linear relationship between the ZSM-5 surface area and the amount of methanol produced (5.5 × 10⁻³ μmolMeOH gcat h−1) over Co–ZSM-5 from methane and oxygen at 250 °C (Table 4).
| S. no | Catalyst | Oxidant | Temperature (°C) | Methanol TOF (μmolMeOH gcat h−1) | Reference |
|---|---|---|---|---|---|
| a Batch reactor, under a pressure of 2 bar. | |||||
| 1 | 2% Fe–ZSM5 | O2 | 300 | 6.3 × 10⁻⁴ | 4 |
| 2 | 2% Fe–ZSM5a | N2O | 200 | 5.5 × 10⁻³ | 3 |
| 3 | 2% Fe–ZSM5 | N2O | 550 | 7.1 × 10⁻³ | 19 |
| 4 | 0.5% Fe–SIL-1 | N2O | 550 | 8 × 10⁻³ | 2 |
| 5 | FePO4/MCM-41 | O2 | 400 | 7.5 × 10⁻⁴ | 14 |
| 6 | FePO4/SBA-15 | O2 | 500 | 1.2 × 10⁻⁴ | 48 |
| 7 | 2% Co–ZSM5 | O2 | 250 | 1.5 × 10⁻⁴ | 45 and 47 |
| 8 | 0.5% Fe–SiO2 | O2 | 500 | 2.1 × 10⁻⁴ | 49 and 50 |
| 9 | FePO4-tdm | O2 | 300 | 5.3 × 10⁻³ | This work |
| 10 | FePO4-tdm | N2O | 300 | 12.3 × 10⁻³ | This work |
Zhang and co-workers48–50 showed that the iron species introduced into mesoporous silica SBA-15 could catalyze the selective oxidation of CH4 to methanol by O2 and that the catalyst with a Fe content of 0.5 wt% provided the highest single-pass yield (2.1 × 10⁻⁴ μmolMeOH gcat h−1). The TOF towards methanol formation decreased with increasing Fe content. They also studied SBA-15-supported iron phosphate (FePO4) for the partial oxidation of CH4 with O2. The SBA-15-supported FePO4 catalysts exhibit higher CH4 conversion and MeOH selectivity than the unsupported and the MCM-41-supported ones in the partial oxidation of CH4 with O2.14,48,50 The catalyst with a loading amount of 5 wt% shows the highest MeOH selectivity at a given CH4 conversion and the highest MeOH formation rate based on the amount of FePO4 in the catalyst. It is likely that the improved catalytic performances of the SBA-15-supported samples are related to the enhanced redox properties of FePO4 species, the large porous diameter and the high inertness of SBA-15.48 With compared to the other catalysts reported in literature, the FePO4-tdm phase catalysts showed in this work exhibited a high activity towards methanol i.e., 12.3 × 10⁻³ μmolMeOH gcat h−1 using N2O as an oxidant. This catalyst also showed a high activity with O2 as an oxidant (5.3 × 10⁻³ μmolMeOH gcat h−1).
4 Conclusion
A high yield of methanol was observed over FePO4 when using N2O as oxidant. The methane conversion with O2 and N2O increased steeply with temperature but increased much slower when H2O was applied as an oxidizing agent. Furthermore, the maximum CH4 consumption (17 mol%) was obtained when oxygen had been used as the oxidant at 500 °C, the highest in this study. The selectivity towards methanol was very good at lower methane conversions (elevated flow rates). Additionally, when a comparison was made at all the levels of CH4 consumption, it was the highest when N2O was used as an oxidant. The present results clearly show that the selective oxidation of methane over FePO4 is influenced by the nature of the oxidizing agent. Furthermore, the fresh catalyst possessed a rough crystalline morphology with particle sizes ranging from 50 to 80 nm, and with a homogeneous dispersion of crystallites. After reduction, agglomeration of these nanoparticles was observed. After the oxidation with O2, the crystalline nature was retained, but with separate agglomerated bulk particles present. From TPRO profiles, it was evident that the type of oxidant, used in re-oxidation, influenced the pathway of oxidation for a reduced FePO4 catalyst.Mössbauer spectroscopy, complemented with powder X-ray diffraction, proved to be a very sensitive tool in providing an understanding of the phase transformations of FePO4 material using O2, H2O and N2O as oxidizing agents for the selective conversion of methane to methanol. The Mössbauer data provided evidence that the Fe2P2O7 phase was dominant in the reduced catalyst sample, while its amount decreased five-fold after the oxidation with O2 due to the formation of α-domains. In the Mössbauer data of the used catalysts, the α-Fe3(P2O7)2 phase, with a Fe3+ spectral component, was the dominant phase (74%). The appearance of the Fe2P2O7 phase was also observed, with ferric and ferrous species each contributing towards an 11% total site fraction. The formation of the α-phase results from the transformation between the FePO4-tdm and Fe2P2O7 phases, which takes place reversibly, depending on strength of the redox atmosphere and the fact that the α-Fe3(P2O7)2 phase is a mixed ferric and ferrous pyrophosphate consisting of both Fe4(P2O7)3 and Fe2P2O7. In summary, the XRD and Mössbauer spectra of the fresh and used catalysts oxidized in the presence of N2O and H2O showed that the α-phase was formed in high quantity when the formation of β-phase was suppressed. When compared to the other catalysts reported in literature, the FePO4-tdm phase catalysts showed in this work exhibited a high activity towards methanol i.e., 12.3 × 10⁻³ μmolMeOH gcat h−1 using N2O as an oxidant. This catalyst also showed a high activity with O2 as an oxidant (5.3 × 10⁻³ μmolMeOH gcat h−1).
Conflicts of interest
There are no conflicts to declare.Acknowledgements
The authors acknowledge the financial support from the Slovenian Research Agency (research core funding No. P2−0152 and P1−0112) within the project Direct Conversion of Methane to Higher Hydrocarbons using Superacid Catalysts, J2–7319. KB-R acknowledges support from the National Research Foundation (South Africa).References
- K. Otsuka and Y. Wang, Appl. Catal., A, 2001, 222, 145–161 CrossRef CAS.
- M. C. Alvarez-Galvan, N. Mota, M. Ojeda, S. Rojas, R. M. Navarro and J. L. G. Fierro, Catal. Today, 2011, 171, 15–23 CrossRef CAS.
- E. V. Starokon, M. V. Parfenov, S. S. Arzumanov, L. V. Pirutko, A. G. Stepanov and G. I. Panov, J. Catal., 2013, 300, 47–54 CrossRef CAS.
- M. V. Parfenov, E. V. Starokon, L. V. Pirutko and G. I. Panov, J. Catal., 2014, 318, 14–21 CrossRef CAS.
- A. A. Latimer, A. Kakekhani, A. R. Kulkarni and J. K. Nørskov, ACS Catal., 2018, 8, 6894–6907 CrossRef CAS.
- A. S. Rosen, J. M. Notestein and R. Q. Snurr, ACS Catal., 2019, 9, 3576–3587 CrossRef CAS.
- J. Bao, G. Yang, Y. Yoneyama and N. Tsubaki, ACS Catal., 2019, 9, 3026–3053 CrossRef CAS.
- P. Khirsariya and R. K. Mewada, Procedia Eng., 2013, 51, 409–415 CrossRef CAS.
- C. Hammond, N. Dimitratos, R. L. Jenkins, J. A. Lopez-Sanchez, S. A. Kondrat, M. Hasbi ab Rahim, M. M. Forde, A. Thetford, S. H. Taylor, H. Hagen, E. E. Stangland, J. H. Kang, J. M. Moulijn, D. J. Willock and G. J. Hutchings, ACS Catal., 2013, 3, 689–699 CrossRef CAS.
- Y. Wang and K. Otsuka, J. Mol. Catal. A: Chem., 1996, 111, 341–356 CrossRef CAS.
- T. Sheppard, C. D. Hamill, A. Goguet, D. W. Rooney and J. M. Thompson, Chem. Commun., 2014, 50, 11053–11055 RSC.
- G. I. Panov, K. A. Dubkov and A. S. Kharitonov, in Modern Heterogeneous Oxidation Catalysis, Wiley-VCH Verlag GmbH & Co. KGaA, 2009, ch. 7, pp. 217–252, DOI:10.1002/9783527627547.
- Y. Wang, W. Yang, L. Yang, X. Wang and Q. Zhang, Catal. Today, 2006, 117, 156–162 CrossRef CAS.
- X. Wang, Y. Wang, Q. Tang, Q. Guo, Q. Zhang and H. Wan, J. Catal., 2003, 217, 457–467 CrossRef CAS.
- Y. Shiota and K. Yoshizawa, J. Am. Chem. Soc., 2000, 122, 12317–12326 CrossRef CAS.
- R. B. Anderson, K. C. Stein, J. J. Feenan and L. J. E. Hofer, Ind. Eng. Chem., 1961, 53, 809–812 CrossRef CAS.
- R. Polnišer, M. Štolcová, M. Hronec and M. Mikula, Appl. Catal., A, 2011, 400, 122–130 CrossRef.
- M. Štolcová, C. Litterscheid, M. Hronec and R. Glaum, in Studies in Surface Science and Catalysis, ed. M. S. Fábio Bellot Noronha and S.-A. Eduardo Falabella, Elsevier, 2007, vol. 167, pp. 37–42 Search PubMed.
- C. Kalamaras, D. Palomas, R. Bos, A. Horton, M. Crimmin and K. Hellgardt, Catal. Lett., 2016, 146, 483–492 CrossRef CAS.
- R. L. McCormick, G. O. Alptekin, D. L. Williamson and T. R. Ohno, Top. Catal., 2000, 10, 115–122 CrossRef CAS.
- J. Schumann, A. Tarasov, N. Thomas, R. Schlögl and M. Behrens, Appl. Catal., A, 2016, 516, 117–126 CrossRef CAS.
- F. B. Khan, K. Bharuth-Ram and H. B. Friedrich, Hyperfine Interact., 2010, 197, 317–323 CrossRef CAS.
- F. B. Khan, V. D. B. C. Dasireddy, K. Bharuth-Ram, H. Masenda and H. B. Friedrich, Hyperfine Interact., 2015, 231, 123–129 CrossRef CAS.
- V. D. B. C. Dasireddy, K. Bharuth-Ram, A. Harilal, S. Singh and H. B. Friedrich, Hyperfine Interact., 2015, 231, 137–142 CrossRef CAS.
- V. D. B. C. Dasireddy, S. Singh and H. B. Friedrich, Appl. Catal., A, 2013, 456, 105–117 CrossRef CAS.
- T. Chetty, H. B. Friedrich, V. D. B. C. Dasireddy, A. Govender, P. J. Mohlala and W. Barnard, ChemCatChem, 2014, 6, 2384–2393 CrossRef CAS.
- V. D. B. C. Dasireddy and B. Likozar, Energy Technol., 2017, 5, 1344–1355 CrossRef CAS.
- Š. Hajduk, V. D. B. C. Dasireddy, B. Likozar, G. Dražić and Z. C. Orel, Appl. Catal., B, 2017, 211, 57–67 CrossRef.
- J. H. Lunsford, Catal. Today, 2000, 63, 165–174 CrossRef CAS.
- A. V. Annapragada and E. Gulari, J. Catal., 1990, 123, 130–146 CrossRef CAS.
- J. Zhang, H. Wang and A. K. Dalai, J. Catal., 2007, 249, 300–310 CrossRef CAS.
- H. Du, H. Zhu, T. Liu, Z. Zhao, X. Chen, W. Dong, W. Lu, W. Luo and Y. Ding, Catal. Today, 2017, 281, 549–558 CrossRef CAS.
- H. G. Merkus, Particle Size Measurements: Fundamentals, Practice, Quality, Springer Netherlands, 2009 Search PubMed.
- F. Khan, V. B. C. Dasireddy, K. Bharuth-Ram, H. Masenda and H. B. Friedrich, Hyperfine Interact., 2015, 231, 123–129 CrossRef CAS.
- J. M. M. Millet and J. C. Vedrine, Appl. Catal., 1991, 76, 209–219 CrossRef CAS.
- J. M. Millet, C. Virely, M. Forissier, P. Bussière and J. C. Vedrine, Hyperfine Interact., 1989, 46, 619–628 CrossRef.
- J.-M. M. Millet, Catal. Rev., 1998, 40, 1–38 CrossRef CAS.
- P. Bonnet and J. M. M. Millet, J. Catal., 1996, 161, 198–205 CrossRef CAS.
- E. Muneyama, A. Kunishige, K. Ohdan and M. Ai, Bull. Chem. Soc. Jpn., 1996, 69, 509–513 CrossRef CAS.
- P. Bonnet, J. M. M. Millet, C. Leclercq and J. C. Védrine, J. Catal., 1996, 158, 128–141 CrossRef CAS.
- J. C. Vedrine, J. M. M. Millet and J.-C. Volta, Catal. Today, 1996, 32, 115–123 CrossRef CAS.
- J.-M. Millet and J. Védrine, Top. Catal., 2001, 15, 139–144 CrossRef CAS.
- M. Ai and K. Ohdan, in Studies in Surface Science and Catalysis, ed. F. V. M. S. M. Avelino Corma and G. F.José Luis, Elsevier, 2000, vol. 130, pp. 755–760 Search PubMed.
- M. Ai and K. Ohdan, in Studies in Surface Science and Catalysis, ed. S. T. O. A. M. G. R. K. Grasselli and J. E.Lyons, Elsevier, 1997, vol. 110, pp. 527–534 Search PubMed.
- N. V. Beznis, B. M. Weckhuysen and J. H. Bitter, Catal. Lett., 2010, 136, 52–56 CrossRef CAS.
- T. Ren, L. Yan, X. Zhang and J. Suo, Appl. Catal., A, 2003, 244, 11–17 CrossRef CAS.
- N. V. Beznis, A. N. C. van Laak, B. M. Weckhuysen and J. H. Bitter, Microporous Mesoporous Mater., 2011, 138, 176–183 CrossRef CAS.
- Y. Wang, X. Wang, Z. Su, Q. Guo, Q. Tang, Q. Zhang and H. Wan, Catal. Today, 2004, 93–95, 155–161 CrossRef CAS.
- J. He, Y. Li, D. An, Q. Zhang and Y. Wang, J. Nat. Gas Chem., 2009, 18, 288–294 CrossRef CAS.
- Q. Zhang, Y. Li, D. An and Y. Wang, Appl. Catal., A, 2009, 356, 103–111 CrossRef CAS.
- K. Lagarec and D. G. Rancourt, Recoil−Mössbauer spectral analysis software for Windows, version 1.0, Department of Physics, University of Ottawa, Ottawa, ON, Canada, 1998, pp. 43 Search PubMed.
Footnote |
| † Electronic supplementary information (ESI) available. See DOI: 10.1039/c9ra02327e |
| This journal is © The Royal Society of Chemistry 2019 |


