 Open Access Article
The preparation of organophosphorus ligand-modified SBA-15 for effective adsorption of Congo red and Reactive red 2†
Fan Zhangab,
Chuting Yang b,
Yi Lib,
Min Chenac,
Sheng Hub and
Haiming Cheng
 *ac
*ac
aNational Engineering Laboratory for Clean Technology of Leather Manufacture, Sichuan University, Chengdu 610065, Sichuan, China. E-mail: chenghaiming@scu.edu.cn
bInstitute of Nuclear Physics and Chemistry, China Academy of Engineering Physics, Mianyang 621900, Sichuan, China
cThe Key Laboratory of Leather Chemistry and Engineering of Ministry of Education, Sichuan University, Chengdu 610065, China
First published on 2nd May 2019
Abstract
P,P-bis (2-oxooxazolidin-3-yl)-N-(3-(triethoxysilyl)propyl)phosphinic amide (APTES-BOP)-modified SBA-15 (SBA-15-BOP) was prepared by a post-synthesis grafting method for the removal of anionic azo dyes from aqueous solutions. The properties of the prepared adsorbent were characterized by PXRD, FT-IR, SEM, TEM, nitrogen sorption, and elemental analysis. Adsorption equilibrium and adsorption kinetic studies demonstrated that the experimental data fitted well with the Langmuir isotherm model and pseudo-second-order model. According to Langmuir fitting, SBA-15-BOP showed high adsorption capacity for CR and RR2 dyes, with the maximum adsorption capacities of 518.1 mg g−1 and 253.8 mg g−1, respectively. The thermodynamic study indicated that the adsorption processes of CR and RR2 dyes on SBA-15-BOP were spontaneous and exothermal. The prepared SBA-15-BOP can be a promising adsorbent for the removal of anionic dyes from aqueous solutions.
1. Introduction
Over ten thousand types of commercial dyestuffs have been widely used in industries such as textile, food, paper, leather, plastics, cosmetics, and printing.1,2 They impart the products with rich colors. However, it is known that in most of the dyeing processes, dyes cannot be used completely; moreover, many dyes are toxic to microorganisms and hard to be biodegraded. Therefore, wastewater from dyeing possesses the characteristics of high chroma, complicated composition and biological toxicity and is classified as industrial wastewater that is difficult to treat.3,4 It is essential to remove the dyes from wastewater to achieve the discharge standard.Physico-chemical and biological methods including adsorption,3 chemical oxidation,5–7 coagulation,8 membrane separation,1 biodegradation,9,10 and photo-catalytic degradation11,12 have been developed for dye removal from wastewater. Among these methods, the adsorption technique, which offers the benefits of wide sources of absorbents, economic feasibility, simplicity, rapidity, and ease of operation,13–15 has been regarded as one of the most efficient methods for dye removal. Till now, various adsorbents have been reported for dye removal, including activated carbon,16,17 MOF materials,18,19 metal oxide nanoparticles,20 mesoporous materials,22–24 and hydroxides.25,26 However, the adsorption performance parameters of these adsorbents such as adsorption capacity and adsorption efficiency are still limited. Therefore, there is still an urgent need to develop adsorbents with excellent performance for the removal of dyestuffs from aqueous solutions.
Ordered mesoporous silica SBA-15, exhibiting remarkable properties such as excellent hydrothermal stability, high surface area, and sufficient mechanical resistance, has been identified as a promising adsorbent for removing dyes and heavy metal ions.27–30 For instance, many reports related to the application of SBA-15 in the recovery of uranium(VI)29–32 are available; moreover, the functionalized SBA-15 materials have also been found to efficiently remove various dyes such as methyl orange, reactive blue, methylene blue and acid blue,27,28 while there are some limitations to their application.23–35 Phosphonic-based ligands form the most important ligand family, which have numerous interesting chemical structures such as phosphates, phosphonates or organophosphorus derivatives.36–38 These ligands exhibit remarkable coordination abilities and high chemical resistance.39 Therefore, phosphonic-based ligands are used for the surface modification of materials to enhance their adsorption capacity and adsorption efficiency, which are of great interest for adsorption-based applications.40,41 However, previous research has mainly focused on the application of phosphonic-based ligands in the field of metal ion extraction. So far, there are no reports about the use of phosphonic-based ligand-modified SBA-15 in the adsorption of dyes. This study, therefore, reports the application of phosphonic-based ligands in the removal of dyes for the first time.
Herein, P,P-bis(2-oxooxazolidin-3-yl)-N-(3-(triethoxysilyl)propyl)phosphinic amide (APTES-BOP)-modified SBA-15 (SBA-15-BOP) has been prepared by a post-synthesis grafting method. Two commonly used anionic azo dyes, namely, Congo red (CR) and Reactive red 2 (RR2) were used for investigating the dye adsorption properties of SBA-15-BOP. The adsorption study focused on the effect of operation parameters including adsorption time, adsorbent dosage, temperature and pH. Adsorption kinetics, equilibrium and thermodynamics were evaluated as well.
2. Experimental
2.1 Reagents and materials
SBA-15 was provided by XFNANO Materials Tech Co., Ltd (Nanjing, China). 3-Aminopropyltriethoxysilane (APTES) was obtained from Aladdin Industrial Corporation (Shanghai, China). Dichloromethane, triethylamine and toluene were purchased from Sinopharm Chemical Reagent (Shanghai, China). Bis(2-oxo-3-oxazolidinyl)phosphinic chloride (BOP) was obtained from Accela ChemBio Co., Ltd (Shanghai, China). Congo red (>98.0%, HPLC pure) was obtained from Aladdin Industrial Corporation, and Reactive red 2 (100%, in strength) was obtained from Shanghai Macklin Biochemical Co., Ltd (Shanghai, China) (Table S1†). All reagents were of analytical grade and used as received without further purification. Milli-Q water (Milli-Q Advantage A10, Millipore, USA) was used for solution preparation.2.2 Preparation of SBA-15-BOP
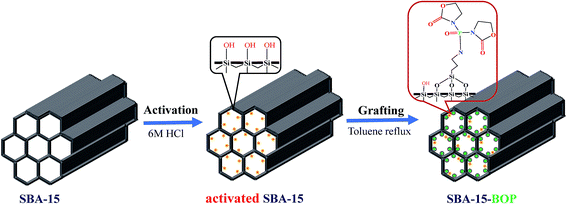
The synthesis of SBA-15-BOP consists of two steps: APTES-BOP ligand synthesis and SBA-15-BOP synthesis. The synthesis process is illustrated in Scheme 1.42Step 1: Preparation of APTES-BOP ligand. Typically, 1.15 g (4.5 mmol) of BOP, 1.0 g (4.5 mmol) of APTES, and 0.67 g (6.75 mmol) of triethylamine were dissolved in 5 mL of dichloromethane at 0 °C under N2 atmosphere. Then, the reaction mixture was continuously stirred at room temperature for 6 h. After that, for purification, the organic phase was washed with saturated NaHCO3 solution three times. The solvent was subsequently evaporated in a rotary evaporator and finally, a slightly yellow solid was obtained. The structure of APTES-BOP was validated by 1H NMR and 13C NMR analyses (Fig. S1 and S2†).
Step 2: Synthesis of SBA-15-BOP. SBA-15 was activated in 6 M HCl solutions at 120 °C for 8 h, followed by rinsing and desiccation. Then, 1.0 g of activated SBA-15 was added into 50 mL toluene and then, 1.75 g (4.0 mmol) of APTES-BOP was added drop-wise into the system. The reaction was refluxed at 120 °C for 12 h. Then, the solid product was recovered by filtration, washed with ethanol and water thoroughly, and finally dried at 50 °C under vacuum.
2.3 Characterization
The powder X-ray diffraction (PXRD) profiles of SBA-15 samples were collected on a Bruker D8 ADVANCE Powder X-ray Diffractometer (Bruker, Germany) using Cu Kα radiation (1.54 Å) for 2θ from 0.5 to 10°. FT-IR data were recorded on a Bruker Vertex-70 infrared spectrometer (Bruker, Germany) by the KBr pellet method. N2 adsorption–desorption isotherms were measured at 77 K using a Tristar-3000 system (Micromeritics Instrument Ltd., USA). The specific surface areas were measured by the Brunauer–Emmett–Teller (BET) method, and the pore volume and average pore size were obtained according to the Barrett–Joyner–Halenda (BJH) method. The morphologies of the samples were collected using an FEI Quanta 400 scanning electron microscope (SEM) (FEI, USA) and an FEI Tecnai G2 F20 S-TWIN transmission electronic microscope (TEM) (FEI, USA). Elemental C–H–N analyses were performed using an Elementar Vario EL Cube elemental analysis apparatus (Elementar, Germany). Nuclear magnetic resonance (NMR) data were determined on a Bruker AVANCE III 600 MHz instrument (Bruker, Germany). Solid-state magic-angle spinning (MAS) NMR data were recorded on a Bruker AVANCE III 500 MHz instrument (Bruker, Germany). The point of zero charge (pHpzc) of the adsorbent in the aqueous phase was analyzed by the titration method according to a previous report.432.4 Batch adsorption experiments
The removal of CR and RR2 dyes was performed in a HZS-H thermostatic air shaker (Donglian Electronic, China). The dye solutions were prepared with Milli-Q water. To determine the maximum absorption wavelength of CR and RR2 dyes, the solutions of CR dye (100 mg L−1) and RR2 dye (50 mg L−1) were scanned from 200 to 800 cm−1 using a Lambda 650 UV-Vis spectrophotometer (PerkinElmer, USA) (Fig. S4†). The pH of the dye solutions was adjusted to the desired value using 0.1 M NaOH or 0.1 M HCl. Set amounts of SBA-15-BOP and dye solutions were placed in a 50 mL polyethylene tube and then, the contents were shaken at 25 °C at 200 rpm for a predetermined period of time. The content of dyes, before and after adsorption, was determined by a UV-Vis spectrophotometer at the wavelengths of 498 nm (CR dye) and 539 nm (RR2 dye) according to standard methods and the calibration curves of CR and RR2 dyes. The amount of adsorption q (mg g−1) and the adsorption percentage (removal efficiency) (R%) were calculated by eqn (1) and (2), respectively:
 | (1) |
 | (2) |
Here, C0 (mg L−1) and Ce (mg L−1) are the initial and equilibrium concentrations of the dye in solution, respectively; V (mL) is the volume of the dye solution and m (mg) is the mass of the adsorbent used.
3. Results and discussion
3.1 Characterization of the adsorbent
The FT-IR profiles of SBA-15 and SBA-15-BOP samples are given in Fig. 1a. Several intrinsic peaks of SBA-15 such as the peaks at 3446 cm−1 (–OH vibration of hydrated silane group), 1634 cm−1 (the bending vibration of surface hydroxide), 1085 cm−1 (asymmetric Si–O–Si stretching), 803 cm−1 (symmetric Si–O–Si stretching) and 464 cm−1 (Si–O–Si bending vibration) were observed .27,30,44 The FT-IR profile of SBA-15-BOP presents characteristic peaks at 1760 cm−1 for –C![[double bond, length as m-dash]](https://www.rsc.org/images/entities/char_e001.gif) O stretching vibrations, 1480 cm−1 for –CH2 group bending vibration (scissor vibration), and 1398 cm−1 for P
O stretching vibrations, 1480 cm−1 for –CH2 group bending vibration (scissor vibration), and 1398 cm−1 for P![[double bond, length as m-dash]](https://www.rsc.org/images/entities/char_e001.gif) O stretching vibrations, suggesting that the organophosphorus groups have been successfully grafted onto the SBA-15 matrix.37 Moreover, after grafting, the pHpzc of SBA-15-BOP was 3.0, which was determined by the titration method (Fig. 1b).
O stretching vibrations, suggesting that the organophosphorus groups have been successfully grafted onto the SBA-15 matrix.37 Moreover, after grafting, the pHpzc of SBA-15-BOP was 3.0, which was determined by the titration method (Fig. 1b).
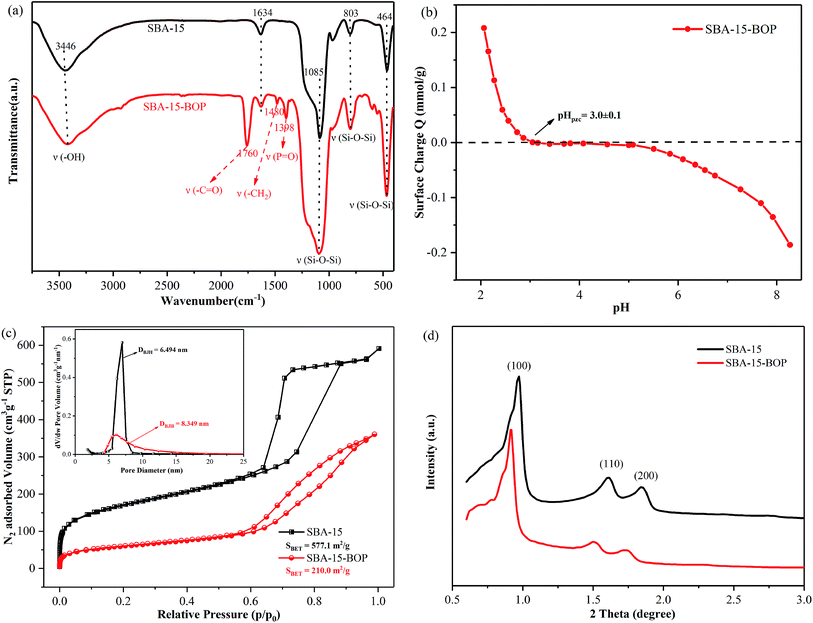 | ||
| Fig. 1 (a) FT-IR spectra; (b) surface charge of adsorbent as a function of pH; (c) the N2 adsorption–desorption isotherms (77 K). Inset: pore size distribution; (d) low-angle XRD patterns. | ||
The N2 adsorption–desorption isotherms of SBA-15 samples are displayed in Fig. 1c. The profiles show a type-IV isotherm with an H1-type hysteresis loop based on the IUPAC classification for both SBA-15 and SBA-15-BOP.42 The pore size distribution of SBA-15 and SBA-15-BOP samples was calculated from the N2 adsorption–desorption isotherms using the Barrett–Joyner–Halenda model. The results showed that the BET surface area and the pore volume of SBA-15 are 577.1 m2 g−1 and 0.81 cm3 g−1, respectively; however, after modification, they decreased to 210.0 m2 g−1 and 0.56 cm3 g−1, respectively. The decrease in the BET surface area and pore volume during modification might be due to the coverage of APTES-BOP groups on the surface of SBA-15. However, the pore size of SBA-15 (6.49 nm) increased after modification (8.35 nm for SBA-15-BOP). The solid state 31P CP-MAS NMR spectra of SBA-15-BOP reveal a single peak at 9.2 ppm, which can be assigned to the P atoms on the APTES-BOP ligand (Fig. S3†). These results further indicated that the organophosphorus groups were successfully functionalized on SBA-15.
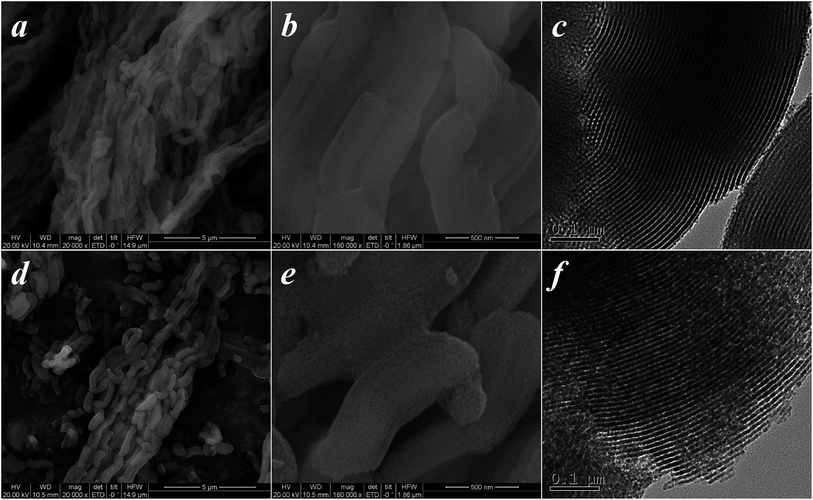
Fig. 1d shows the XRD patterns of SBA-15 samples. The 2θ profiles exhibit three intense and well-defined peaks in the region of 0.65–3.0°, corresponding to the (100), (110), and (200) reflections of the hexagonal pore structure of the p6mm symmetry.45 It can be seen that there are some distinct differences in the relative intensities of the (100), (110), and (200) reflections, which can be related to the functional groups grafted on the surface of the SBA-15 inorganic matrix. A similar change can be observed in their SEM and TEM morphologies (Fig. 2). Furthermore, the amount of functional groups grafted on the SBA-15 surface was confirmed by elemental analysis.30,35 The chemical and physical properties of the SBA-15 samples are presented in Table 1.
| Property | SBA-15 | SBA-15-BOP |
|---|---|---|
| Specific surface area (m2 g−1) | 577.1 | 210.0 |
| Pore volume (BJH) (cm3 g−1) | 0.8110 | 0.5617 |
| Pore size (BJH) (nm) | 6.494 | 8.349 |
| Functional group content (mmol g−1) | — | 1.828 |
| pHpzc | — | 3.0 ± 0.1 |
3.2 Adsorption study
3.3 Adsorption isotherms
The effect of the initial concentration of dyes on the adsorption of CR and RR2 dyes onto SBA-15-BOP was investigated by varying the concentration of dyes from 25 to 1000 mg L−1. The experiments were performed at 25 °C with 30 mL of dye solution and 10 mg of SBA-15-BOP for 60 min. It could be seen that the adsorption capacities of SBA-15-BOP for both dyes increased on increasing the initial dye concentration until a plateau was reached (Fig. 5a). While the initial dye concentration increased in the range of 25–1000 mg L−1, the adsorption capacity (qe) for CR dye increased from 68.55 to 507.2 mg g−1 and the adsorption capacity (qe) for RR2 dye increased from 70.83 to 249.7 mg g−1. An adsorption isotherm is essential in understanding the interactive behavior between the adsorbate and the adsorbent when the adsorption attains equilibrium. Herein, the experimental data were evaluated with the models of Langmuir,49 Freundlich,50 and Temkin51 (Fig. 5b, S5, and Table S2†). The results showed that the Langmuir model fitted the experimental data well with the correlation coefficient (R2) values of 0.9984 (CR dye) and 0.9991 (RR2 dye) (Table S3†), suggesting a monolayer uniform adsorption mode for SBA-15-BOP adsorbing anionic dyes. The maximum adsorption capacities (qmax) of SBA-15-BOP according to the Langmuir fitting result were 518.1 mg g−1 for CR dye and 253.8 mg g−1 for RR2 dye. In comparison with other reported adsorbents in the literature (Table 2), SBA-15-BOP exhibited a good adsorption performance for CR and RR2 dyes in aqueous solutions in near-neutral pH conditions. A dimensionless parameter RL from the Langmuir model is commonly used to predict the feasibility of the adsorption process, which is defined in eqn (3).
 | (3) |
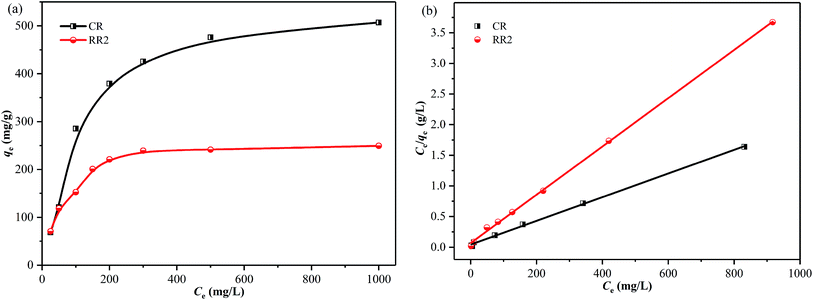 | ||
| Fig. 5 (a) Effect of initial dye concentration on adsorption; (b) Langmuir models for CR and RR2 adsorption onto SBA-15-BOP (V/m = 3 mL mg−1, t = 60 min, T = 25 °C). | ||
| Dye | Adsorbents | pH | Temp (°C) | qmax (mg g−1) | Reference |
|---|---|---|---|---|---|
| CR | SBA-15/AmBenS | 6–7 | 25 | 64.3 | 28 |
| SBA-15-NH2 | 4 | 40 | 230.9 | 35 | |
| SBA-15-COOH | 9 | 40 | 133.9 | 35 | |
| Hierarchical porous NiFe-LDO | 6–7 | 30 | 330 | 26 | |
| Si-MCM-41 | 4 | 40 | 87.4 | 22 | |
| Si-MCM-41-PEI | 4 | 40 | 458.72 | 24 | |
| SBA-15-BOP | 6–7 | 25 | 518.1 | This study | |
| RR2 | RPB–Fe3O4 nanoparticles | 3 | 25 | 97.8 | 21 |
| BIO-sludge | 2 | 25 | 213.9 | 15 | |
| PC-sludge | 2 | 25 | 159.3 | 15 | |
| CFA-PEI | 2 | 40 | 316.8 | 16 | |
| Si-MCM-41 | 2 | 35 | 60.2 | 22 | |
| SBA-15-BOP | 6–7 | 25 | 253.8 | This study |
The values of RL at different Ce values are depicted in Fig. S6.† The calculated RL values were between 0 and 1, demonstrating that the adsorption of CR and RR2 dyes onto SBA-15-BOP is a favorable process.52
3.4 Adsorption kinetics
The effect of contact time on the adsorption of CR and RR2 dyes onto SBA-15-BOP was studied in 1000 mL Erlenmeyer flasks containing 500 mL of 300 mg L−1 dye solutions with 100 mg of SBA-15-BOP at 25 °C. It could be observed that the adsorption of CR and RR2 dyes on SBA-15-BOP was rapid, reaching equilibrium in 20 min (Fig. 6a). To further investigate the adsorption kinetics, the experimental data were fitted to 4 common kinetic models (Table S2†).53–56 The kinetic parameters are summarized in Table S4,† while the fitting curves are shown in Fig. 6b and S7.† The experimental data fitted well with the pseudo-second-order model, with an R2 value of 0.9999. The results further indicate that the adsorption of anionic azo dyes on SBA-15-BOP is mainly a chemical adsorption process.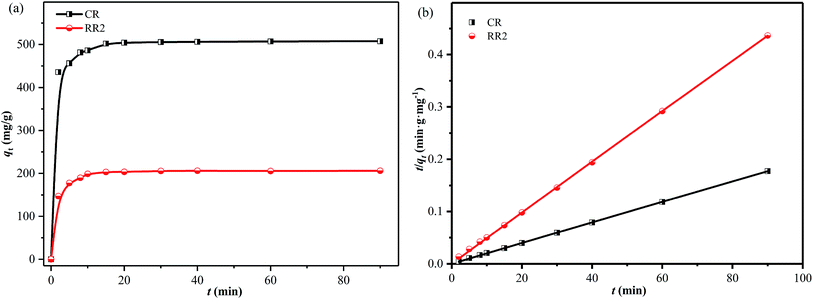 | ||
| Fig. 6 (a) Effect of contact time on adsorption; (b) pseudo-second-order model for CR and RR2 adsorption onto SBA-15-BOP (dye concentration = 300 mg L−1; V/m = 5 mL mg−1; T = 25 °C). | ||
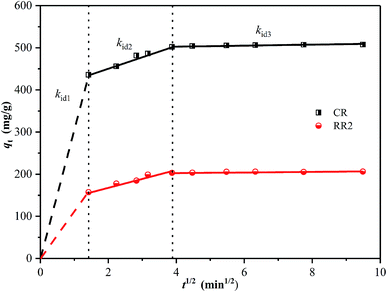
The intra-particle diffusion model has been widely applied to analyze the mechanism of adsorption.14,57 The fitting results are shown in Fig. 7 and Table S5.† It can be observed that the adsorption process is divided into three sections. The first sharp section can be ascribed to instantaneous adsorption or external surface adsorption owing to the high initial concentration of dyes and ample active adsorption sites. The second section illustrates a gradual adsorption stage ascribed to intra-particle diffusion between the dye ions and the adsorbent. The last section represents the equilibrium stage, in which intra-particle diffusion further slows down due to the saturation of active adsorption sites and the decrease in dye concentration.14,58 A similar result was reported in the literature while studying CR dye adsorption on hierarchically porous NiFe-LDO.26 These results suggest that the adsorption process between dye ions and the adsorbent follows the intra-particle diffusion model, indicating that the adsorption process is limited by the intra-particle diffusion rate.26,59
3.5 Thermodynamic study
A thermodynamic study was performed to investigate the effect of temperature on the adsorption process of CR and RR2 dyes by SBA-15-BOP. Ten mg of adsorbent and 30 mL of 200 mg L−1 dye solution were placed in a 50 mL polyethylene tube with continuous shaking under various temperatures for 60 min. The results demonstrated that the adsorption capacity of the two dyes significantly decreased on increasing the temperature from 15 °C to 40 °C, indicating that the adsorption processes are exothermic (Fig. S8a†). The values of standard free energy (ΔGo), standard enthalpy (ΔHo) and standard entropy (ΔSo) were calculated using the van't Hoff equation (Table S2 and Fig. S8b†), and they are summarized in Table S6.† The negative values of ΔHo revealed that the adsorption processes of CR and RR2 dyes on SBA-15-BOP were exothermic. The negative values of ΔGo also confirmed the feasibility and spontaneity of adsorption. In comparison with the observation for the adsorption of the RR2 dye, the value of ΔSo was positive for the adsorption of the CR dye, which may contribute to the increase in randomness at the solid/solution interface during adsorption.60 The result implies that the higher adsorption capacity of SBA-15-BOP for the CR dye than that for the RR2 dye is due to better affinity of SBA-15-BOP towards the CR dye.3.6 Adsorption mechanism
Various mechanisms such as electrostatic interaction, ion exchange, hydrogen bond, and π–π interaction may be involved in the whole adsorption process.61,62 As discussed in the effects of initial pH, the complexation between the functional groups on SBA-15-BOP and the aqueous dye ions is considered to play a major role in the adsorption process, and electrostatic interaction is regarded as an important adsorption force. In addition, some hydroxyl groups exist on the surface of SBA-15-BOP, and hydrogen bonds are also present as a general force in the adsorption process. The adsorption mechanisms for adsorbing CR dye molecules by SBA-15-BOP are schematically illustrated in Fig. 8a. Moreover, the TEM image of SBA-15-BOP after adsorption (Fig. 8b) indicates that CR dye has been adsorbed onto the mesoporous network of SBA-15-BOP.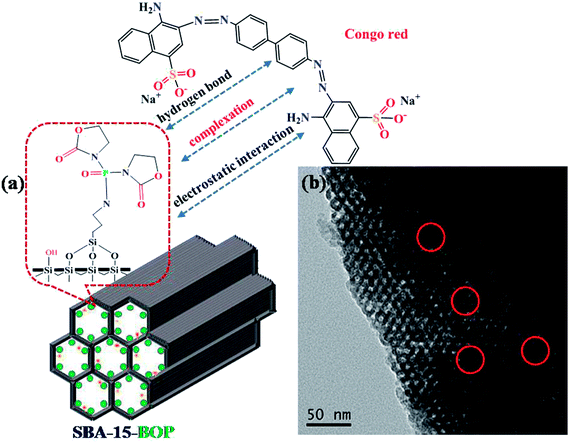 | ||
| Fig. 8 (a) The proposed adsorption mechanism of CR onto SBA-15-BOP; (b) the TEM image of SBA-15-BOP with adsorbed CR. | ||
3.7 Desorption and reusability study
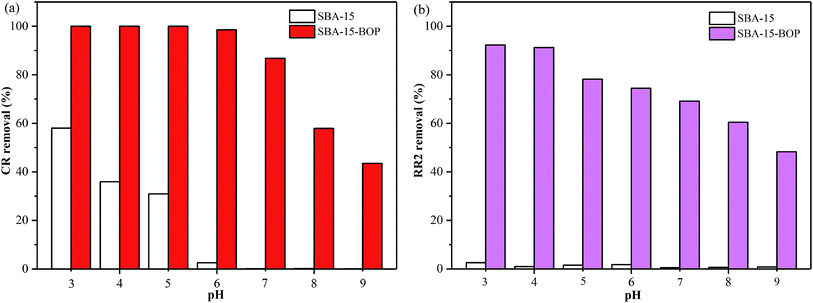
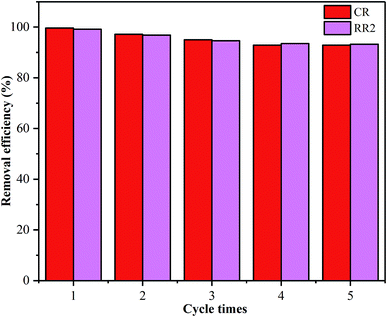
SBA-15-BOP showed poor adsorption performance for both dyes at a higher pH range (Fig. 3), implying that the adsorbed dye ions might be desorbed from SBA-15-BOP by an alkaline medium. In this study, the desorption of CR and RR2 dyes from SBA-15-BOP was studied with 0.1 M NaOH solution. The degrees of desorption were found to be 97.98% (CR dye) and 97.53% (RR2 dye). The reusability was estimated over five consecutive cycles of the adsorption–desorption process (Fig. 9). It was seen that SBA-15-BOP could maintain high removal efficiencies for CR dye (above 92.5%) and RR2 dye (above 93.3%) after five cycles, which indicated the excellent regeneration property of SBA-15-BOP.4. Conclusions
In summary, organophosphorus group-modified SBA-15 (SBA-15-BOP) was prepared by a post-synthesis grafting method, which included ligand synthesis and grafting process. Then, the prepared SBA-15-BOP was used for the removal of the anionic azo dye (CR) and the Reactive dye (RR2) from aqueous solutions. SBA-15-BOP showed good adsorption capacity for CR and RR2 dyes in acidic and near-neutral pH conditions. The adsorption processes followed the Langmuir model and the pseudo-second-order model. The obtained maximum adsorption capacities for CR and RR2 dyes were 518.1 mg g−1 and 253.8 mg g−1, respectively. The intra-particle diffusion model indicated that the adsorption processes were divided into three steps and the intra-particle diffusion rate was the rate-controlling step. The thermodynamic study indicated that the adsorption processes were spontaneous and exothermal.Conflicts of interest
There are no conflicts to declare.Acknowledgements
The authors are grateful for the financial support from the Key Research Program of Sichuan Province of China (2017GZ0268).References
- V. Jegatheesan, B. K. Pramanik, J. Chen, D. Navaratna, C. Y. Chang and L. Shu, Bioresour. Technol., 2016, 204, 202–212 CrossRef CAS PubMed.
- M. Rafatullah, O. Sulaiman, R. Hashim and A. Ahmad, J. Hazard. Mater., 2010, 177, 70–80 CrossRef CAS PubMed.
- M. T. Yagub, T. K. Sen, S. Afroze and H. M. Ang, Adv. Colloid Interface Sci., 2014, 209, 172–184 CrossRef CAS PubMed.
- M. Solís, A. Solís, H. I. Pérez, N. Manjarrez and M. Flores, Process Biochem., 2012, 47, 1723–1748 CrossRef.
- S. Karthikeyan, A. Titus, A. Gnanamani, A. B. Mandal and G. Sekaran, Desalination, 2011, 281, 438–445 CrossRef CAS.
- M. Faouzi Elahmadi, N. Bensalah and A. Gadri, J. Hazard. Mater., 2009, 168, 1163–1169 CrossRef PubMed.
- Y. Shen, Q. Xu, R. Wei, J. Ma and Y. Wang, Ultrason. Sonochem., 2017, 38, 681–692 CrossRef CAS PubMed.
- C. R. Holkar, A. J. Jadhav, D. V. Pinjari, N. M. Mahamuni and A. B. Pandit, J. Environ. Manage., 2016, 182, 351–366 CrossRef CAS PubMed.
- J. F. Osma, J. L. Toca-Herrera and S. Rodríguez-Couto, Appl. Catal., A, 2010, 373, 147–153 CrossRef CAS.
- D. Daâssi, S. Rodríguez-Couto, M. Nasri and T. Mechichi, Int. Biodeterior. Biodegrad., 2014, 90, 71–78 CrossRef.
- M. H. Farzana and S. Meenakshi, Ind. Eng. Chem. Res., 2013, 53, 55–63 CrossRef.
- J. Long, B. Liu, G. Wang and W. Shi, J. Cleaner Prod., 2017, 165, 788–800 CrossRef CAS.
- F. A. Pavan, S. L. P. Dias, E. C. Lima and E. V. Benvenutti, Dyes Pigm., 2008, 76, 64–69 CrossRef.
- V. Vimonses, S. Lei, B. Jin, C. W. K. Chow and C. Saint, Chem. Eng. J., 2009, 148, 354–364 CrossRef CAS.
- G. G. Sonai, S. M. de Souza, D. de Oliveira and A. A. de Souza, J. Environ. Manage., 2016, 168, 149–156 CrossRef CAS PubMed.
- S. Dash, H. Chaudhuri, G. Udayabhanu and A. Sarkar, Energy Fuels, 2016, 30, 6646–6653 CrossRef.
- G. Mezohegyi, F. P. van der Zee, J. Font, A. Fortuny and A. Fabregat, J. Environ. Manage., 2012, 102, 148–164 CrossRef CAS PubMed.
- T. N. V. de Souza, S. M. L. de Carvalho, M. G. A. Vieira, M. G. C. da Silva and D. d. S. B. Brasil, Appl. Surf. Sci., 2018, 448, 662–670 CrossRef.
- E. Haque, J. W. Jun and S. H. Jhung, J. Hazard. Mater., 2011, 185, 507–511 CrossRef CAS PubMed.
- S. Zhao, D. Chen, F. Wei, N. Chen, Z. Liang and Y. Luo, Ultrason. Sonochem., 2017, 39, 845–852 CrossRef CAS PubMed.
- C. Lin, Y. Lin and J. Ho, J. Alloys Compd., 2016, 666, 153–158 CrossRef CAS.
- H. Chaudhuri, S. Dash and A. Sarkar, J. Porous Mater., 2016, 23, 1227–1237 CrossRef CAS.
- H. Chaudhuri, S. Dash and A. Sarkar, Ind. Eng. Chem. Res., 2017, 56, 2943–2957 CrossRef CAS.
- H. Chaudhuri, S. Dash and A. Sarkar, Ind. Eng. Chem. Res., 2016, 55, 10084–10094 CrossRef CAS.
- Z. Bai, Y. Zheng and Z. Zhang, J. Mater. Chem. A, 2017, 5, 6630–6637 RSC.
- C. Lei, M. Pi, C. Jiang, B. Cheng and J. Yu, J. Colloid Interface Sci., 2017, 490, 242–251 CrossRef CAS PubMed.
- M. Mirzaie, A. Rashidi, H. A. Tayebi and M. E. Yazdanshenas, J. Chem. Eng. Data, 2017, 62, 1365–1376 CrossRef CAS.
- A. Węgrzyn, M. Radko, D. Majda, W. Stawiński, M. Skiba and D. Cież, Microporous Mesoporous Mater., 2018, 268, 31–38 CrossRef.
- J. Huynh, R. Palacio, F. Safizadeh, G. Lefevre, M. Descostes, L. Eloy, N. Guignard, J. Rousseau, S. Royer, E. Tertre and I. Batonneau-Gener, ACS Appl. Mater. Interfaces, 2017, 9, 15672–15684 CrossRef CAS PubMed.
- Y. L. Wang, L. J. Song, L. Zhu, B. L. Guo, S. W. Chen and W. S. Wu, Dalton Trans., 2014, 43, 3739–3749 RSC.
- Y. Ren, R. Yang, L. Shao, H. Tang, S. Wang, J. Zhao, J. Zhong and C. Kong, RSC Adv., 2016, 6, 68695–68704 RSC.
- L. Dolatyari, M. R. Yaftian and S. Rostamnia, J. Environ. Manage., 2016, 169, 8–17 CrossRef CAS PubMed.
- F. Rehman, P. L. Volpe and C. Airoldi, J. Environ. Manage., 2014, 133, 135–143 CrossRef CAS PubMed.
- Y. Dong, B. Lu, S. Zang, J. Zhao, X. Wang and Q. Cai, J. Chem. Technol. Biotechnol., 2011, 86, 616–619 CrossRef CAS.
- H. Chaudhuri, S. Dash and A. Sarkar, New J. Chem., 2016, 40, 3622–3634 RSC.
- J. Florek, S. Giret, E. Juere, D. Lariviere and F. Kleitz, Dalton Trans., 2016, 45, 14832–14854 RSC.
- H. Sarafraz, A. Minuchehr, G. Alahyarizadeh and Z. Rahimi, Sci. Rep., 2017, 7, 11675 CrossRef CAS PubMed.
- E. C. Uribe, H. E. Mason, J. A. Shusterman and W. W. Lukens, Dalton Trans., 2017, 46, 5441–5456 RSC.
- R. Boissezon, J. Muller, V. Beaugeard, S. Monge and J. J. Robin, RSC Adv., 2014, 4, 35690 RSC.
- Y. C. Pan, H. H. Gavin Tsai, J. C. Jiang, C. C. Kao, T. L. Sung, P. J. Chiu, D. Saikia, J. H. Chang and H. M. Kao, J. Phys. Chem. C, 2012, 116, 1658–1669 CrossRef CAS.
- C. Labrecque, S. Potvin, L. Whitty-Leveille and D. Lariviere, Talanta, 2013, 107, 284–291 CrossRef CAS PubMed.
- X. Wang, K. S. Lin, J. C. Chan and S. Cheng, J. Phys. Chem. B, 2005, 109, 1763–1769 CrossRef CAS PubMed.
- M. T. Uddin, M. A. Islam, S. Mahmud and M. Rukanuzzaman, J. Hazard. Mater., 2009, 164, 53–60 CrossRef CAS PubMed.
- F. Fan, D. Pan, H. Wu, T. Zhang and W. Wu, Ind. Eng. Chem. Res., 2017, 56, 2221–2228 CrossRef CAS.
- M. Moritz and M. Łaniecki, Appl. Surf. Sci., 2012, 258, 7523–7529 CrossRef CAS.
- J. Zhao, Z. Lu, X. He, X. Zhang, Q. Li, T. Xia, W. Zhang and C. Lu, ACS Sustainable Chem. Eng., 2017, 5, 7723–7732 CrossRef CAS.
- I. Ali, Z. A. Al-Othman and A. Alwarthan, J. Mol. Liq., 2016, 224, 171–176 CrossRef CAS.
- A. Aluigi, F. Rombaldoni, C. Tonetti and L. Jannoke, J. Hazard. Mater., 2014, 268, 156–165 CrossRef CAS PubMed.
- I. Langmuir, J. Am. Chem. Soc., 1916, 38, 2221–2295 CrossRef CAS.
- H. M. F. Freundlich, Z. Phys. Chem., 1906, 57, 385–470 CAS.
- M. J. P. Temkin and V., Acta Physicochim. URSS, 1940, 12, 217–222 Search PubMed.
- Z. Wu, H. Zhong, X. Yuan, H. Wang, L. Wang, X. Chen, G. Zeng and Y. Wu, Water Res., 2014, 67, 330–344 CrossRef CAS PubMed.
- Y. S. Ho, Water Res., 2006, 40, 119–125 CrossRef CAS PubMed.
- S. K. Lagergren, K. Sven. Vetenskapsakad. Handl., 1898, 24, 1–39 Search PubMed.
- W. J. Weber and J. C. Morris, J. Sanit. Eng. Div., Am. Soc. Civ. Eng., 1963, 89, 31–60 Search PubMed.
- A. M. Peers, J. Catal., 1965, 4, 499–503 CrossRef CAS.
- W. H. Cheung, Y. S. Szeto and G. McKay, Bioresour. Technol., 2007, 98, 2897–2904 CrossRef CAS PubMed.
- L. Jin, X. Zhao, X. Qian and M. Dong, J. Colloid Interface Sci., 2018, 509, 245–253 CrossRef CAS PubMed.
- M. Dogan, H. Abak and M. Alkan, J. Hazard. Mater., 2009, 164, 172–181 CrossRef CAS PubMed.
- I. A. W. Tan, B. H. Hameed and A. L. Ahmad, Chem. Eng. J., 2007, 127, 111–119 CrossRef CAS.
- J. Xu, D. Xu, B. Zhu, B. Cheng and C. Jiang, Appl. Surf. Sci., 2018, 435, 1136–1142 CrossRef CAS.
- R. Kumar, S. A. Ansari, M. A. Barakat, A. Aljaafari and M. H. Cho, New J. Chem., 2018, 42, 18802–18809 RSC.
Footnote |
| † Electronic supplementary information (ESI) available: Details of the NMR data of the adsorbent and the adsorption isotherms, adsorption kinetics fitting data. See DOI: 10.1039/c9ra02287b |
| This journal is © The Royal Society of Chemistry 2019 |

