
 Open Access Article
 This Open Access Article is licensed under a Creative Commons Attribution-Non Commercial 3.0 Unported Licence
Tailoring optical cross sections of gold nanorods at a target plasmonic resonance wavelength using bromosalicylic acid†
Weiwei Zou,
Hao Xie,
Yang Ye and
Weihai Ni *
*
Jiangsu Key Laboratory of Thin Films, School of Physical Science and Technology, Soochow University, Suzhou 215006, People's Republic of China. E-mail: niweihai@suda.edu.cn
First published on 21st May 2019
Abstract
In many applications, the optical cross sections of gold nanorods (AuNRs) are required to be tailored at a fixed target longitudinal surface plasmon resonance (LSPR) wavelength depending on the excitation source and the photodetector. In this work, we demonstrate the fine tailoring of optical cross sections of AuNRs at a fixed target resonance wavelength, on the basis of AuNR overgrowth using a binary surfactant mixture consisting of 5-bromosalicylic acid (BSA) and cetyltrimethylammonium bromide (CTAB). A systematic study was performed on the sum effects of the BSA concentration and the volume of the growth solution, which gives a formula for quantitative instructions. Based on the formula, we gave examples for the successful synthesis of AuNRs with different optical cross sections at target LSPR wavelengths. From simulation, a nonlinear relationship was further derived to understand the relationship between the aspect ratio and the width of the AuNRs at a target LSPR wavelength for the dimension design of AuNRs. The ratio of optical against physical cross sections was calculated and plotted as a function of the width. The results clearly indicate that AuNRs with a width of 30 nm possess the highest efficiency in terms of optical per physical cross section. Our study provides reliable methods for the synthesis, as well as guidelines for the dimension design of AuNRs, for use in a variety of applications.
Introduction
The intensity of light and matter interactions at the nanoscale can be represented by the optical cross section, a quantity that statistically represents how great the chance is for incident photons to be absorbed or scattered by a nanoparticle. Gold nanoparticles possess the largest optical per physical cross sections among known optical materials such as organic fluorophores, semiconductor nanocrystals, and atoms/ions.1 They are therefore highly favourable and have been widely used in many applications, including spectroscopy,2 sensing,3 light harvesting,4 photothermal therapy,5 etc. These strong interactions rely on surface plasmon resonance (SPR), the collective oscillation of free electrons across the particle interface under the excitation of incident light.SPR is featured as a Lorentzian-shaped peak centered at a resonance wavelength, where this wavelength is dependent on the particle shape. Varying the shape in terms of the aspect ratio, R, allows for tuning of the longitudinal surface plasmon resonance (LSPR) of gold nanorods (AuNRs) over a wide spectral range from the visible to the near infrared. The height of the Lorentzian peak, known as the optical cross section, is mainly determined by the particle size. Absorption and scattering both contribute to the overall extinction cross section, whereas the fraction of the scattering and absorption in extinction is also size-dependent.6 Mini AuNRs show better photothermal therapy efficiency,7 while large AuNRs are preferred for imaging. The LSPR wavelength and size of the AuNRs can be tuned to some extent by changing the dosage of the reaction reagents during seed-mediated growth using cetyltrimethylammonium bromide (CTAB),8,9 where insights have been extensively gained on the interdependent relationship between some of the synthetic conditions, including the addition of ascorbic acid, the seed amount, Ag+, CTA+, growth temperature, Br−, etc.10–17 Methods toward finely tuning the LSPR of AuNRs have been reported using Hofmeister anions,18 phenols,19 peroxide,20 and benzyldimethylammonium chloride hydrate21 in AuNR synthesis and through shape modifications after synthesis, including oxidation,22–24 overgrowth,25,26 and the addition of sulfide additives.27
In recent years, improved control of the AuNR synthesis using a binary surfactant mixture formed by CTAB and a variety of additives has attracted a lot of attention. These additives include sodium oleate,26,28,29 salicylate salts, and salicylic acid.30 Dual roles of the 5-bromosalicylic acid (BSA) in the tunable synthesis of AuNRs have been clearly revealed.31 The BSA molecule possesses a hydrophobic aromatic ring that can penetrate into the hydrophobic tail of the CTAB molecules, altering the micellization behavior of the CTAB molecules on the AuNR surface, resulting in variable adsorption rates of Au adatoms during growth. This alteration is mild and beneficial for maintaining the rod shape of the AuNRs. By contrast, AuNRs with irregular shapes are obtained after synthesis using thiol molecules that have strong interactions with Au.32
In many applications the LSPR is required to be at a target wavelength depending on the excitation source and the photodetector. Size tuning as well as tailoring of the optical cross sections at a fixed target LSPR wavelength is therefore highly desirable. In the methods reported previously, the size tuning was often performed in the AuNR synthesis, where the yield differs from sample to sample. In comparison, overgrowth after the AuNR synthesis, starting from the same batch of AuNRs, ensures exactly the same AuNR concentration in all of the samples, and the cross sections of different samples can therefore be directly compared.25 Herein, on the basis of overgrowth using BSA, we demonstrate the fine tailoring of optical cross sections of AuNRs at a fixed target resonance wavelength. The overgrowth of Au occurs more preferentially on the sides of the AuNRs, while the growth at the ends is regulated by the concentrations of BSA. This BSA-directed Au growth allows for fine control of the shape of AuNRs during overgrowth, meaning that a fixed target LSPR wavelength can be achieved by controlling the combinations of BSA concentration and the volume of the growth solution (Scheme 1). A systematic study was performed on the sum effects of the BSA concentration and the volume of the growth solution, to give a formula for quantitative instructions. On the basis of the formula, we gave examples for the successful synthesis of AuNRs with different optical cross sections at target LSPR wavelengths. From simulation, a nonlinear relationship was further derived to understand the relationship between R and the width of the AuNRs, D, at a target LSPR wavelength, drawing guidelines for the dimension design of AuNRs for use in a variety of applications.
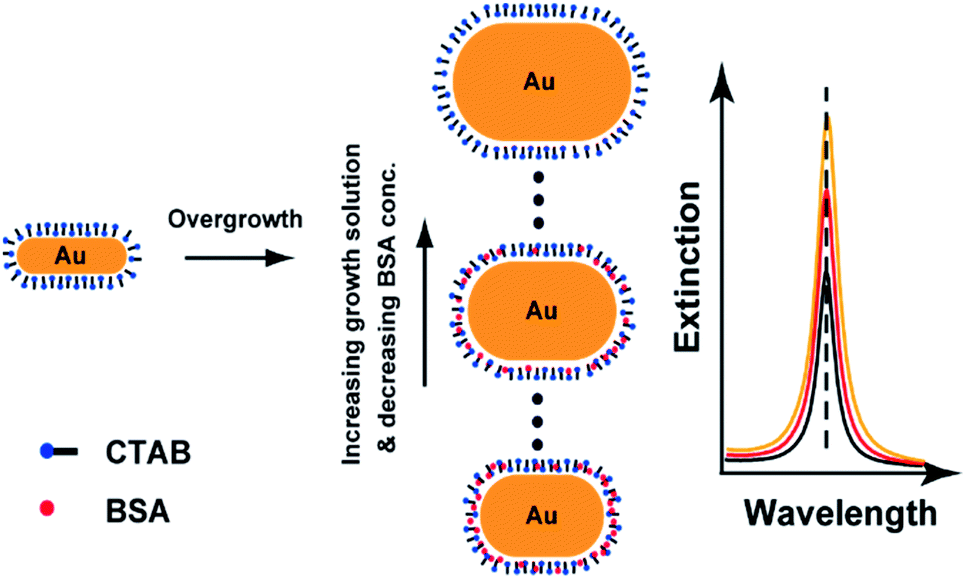 | ||
| Scheme 1 Overgrowth of AuNRs using a binary surfactant mixture consisting of BSA and CTAB. Tailoring the optical cross sections of AuNRs at a fixed target LSPR wavelength can be accomplished by controlling the combinations of BSA concentrations and the volumes of the growth solution. | ||
Results and discussion
Fig. 1a shows the transmission electron microscopy (TEM) image of the starting AuNRs that were synthesized using a binary surfactant mixture consisting of BSA and CTAB, following a previously reported procedure.33 The as-synthesized AuNRs are monodispersed and possess an ensemble LSPR wavelength at 792 nm (black curve, Fig. 1b). Their average width, length, and R are 16.0 ± 1.7 nm, 55.0 ± 6.1 nm, and 3.5 ± 0.4, respectively. The overgrowth was performed using the starting AuNRs as seeds in the presence of BSA. For instance, 50 μL of the starting AuNR solution was added to 150 μL of the growth solution to achieve V = VG![[thin space (1/6-em)]](https://www.rsc.org/images/entities/char_2009.gif) :VS = 3, the volume ratio between the growth solution and the starting AuNR solution. At this fixed volume ratio, the concentration of BSA in the growth solution was increased from 0 to 0.2, 0.5, 1, 2, 5, 10, and 15 mM. The increase in the BSA concentration leads to a blue shift in the LSPR and slight decrease in the extinction of the AuNRs (Fig. 1b). The blue shift is as large as 70 nm in this case, indicating a decrease in R. The slight decrease of the extinction suggests that BSA molecules at high concentrations form a dense coating on the AuNR surface and tend to prohibit further deposition of Au. After overgrowth at 10 mM BSA concentration, the average width, length, and R are 36.8 ± 2.7 nm, 66.6 ± 6.2 nm, and 1.8 ± 0.2, respectively (Fig. 1c). Compared to the starting AuNRs, the width of the resultant AuNRs is greatly increased, while the change in the length is relatively small. Fig. 1d shows the statistical results with an increase in the BSA concentration. The length is decreased from 71 to 64 nm, while the width is kept constant at about 36 nm, resulting in a decrease in R from 2.0 to 1.8 (Fig. 1d). Dimension details and TEM images for the AuNRs can be found in Table S1 and Fig. S1, respectively, in the ESI.† This indicates that Au deposition occurs more preferentially on the sides of the AuNRs during overgrowth. This result is consistent with that reported previously.31 Interestingly, however, in the absence of BSA, the length of the resultant AuNRs is larger. This may be related with the fact that there are relatively fewer CTAB molecules at the ends.34 With an increase in the BSA concentration, the ends are more closely occupied by BSA molecules, preventing the adsorption of Au adatoms, and hence the length is decreased. This suggests that BSA molecules are more concentrated at the ends than at the sides, which is opposite to the behavior observed for the CTAB molecules (Scheme 1). Therefore, R as well as the final LSPR wavelength can be tuned by varying the BSA concentration.
:VS = 3, the volume ratio between the growth solution and the starting AuNR solution. At this fixed volume ratio, the concentration of BSA in the growth solution was increased from 0 to 0.2, 0.5, 1, 2, 5, 10, and 15 mM. The increase in the BSA concentration leads to a blue shift in the LSPR and slight decrease in the extinction of the AuNRs (Fig. 1b). The blue shift is as large as 70 nm in this case, indicating a decrease in R. The slight decrease of the extinction suggests that BSA molecules at high concentrations form a dense coating on the AuNR surface and tend to prohibit further deposition of Au. After overgrowth at 10 mM BSA concentration, the average width, length, and R are 36.8 ± 2.7 nm, 66.6 ± 6.2 nm, and 1.8 ± 0.2, respectively (Fig. 1c). Compared to the starting AuNRs, the width of the resultant AuNRs is greatly increased, while the change in the length is relatively small. Fig. 1d shows the statistical results with an increase in the BSA concentration. The length is decreased from 71 to 64 nm, while the width is kept constant at about 36 nm, resulting in a decrease in R from 2.0 to 1.8 (Fig. 1d). Dimension details and TEM images for the AuNRs can be found in Table S1 and Fig. S1, respectively, in the ESI.† This indicates that Au deposition occurs more preferentially on the sides of the AuNRs during overgrowth. This result is consistent with that reported previously.31 Interestingly, however, in the absence of BSA, the length of the resultant AuNRs is larger. This may be related with the fact that there are relatively fewer CTAB molecules at the ends.34 With an increase in the BSA concentration, the ends are more closely occupied by BSA molecules, preventing the adsorption of Au adatoms, and hence the length is decreased. This suggests that BSA molecules are more concentrated at the ends than at the sides, which is opposite to the behavior observed for the CTAB molecules (Scheme 1). Therefore, R as well as the final LSPR wavelength can be tuned by varying the BSA concentration.
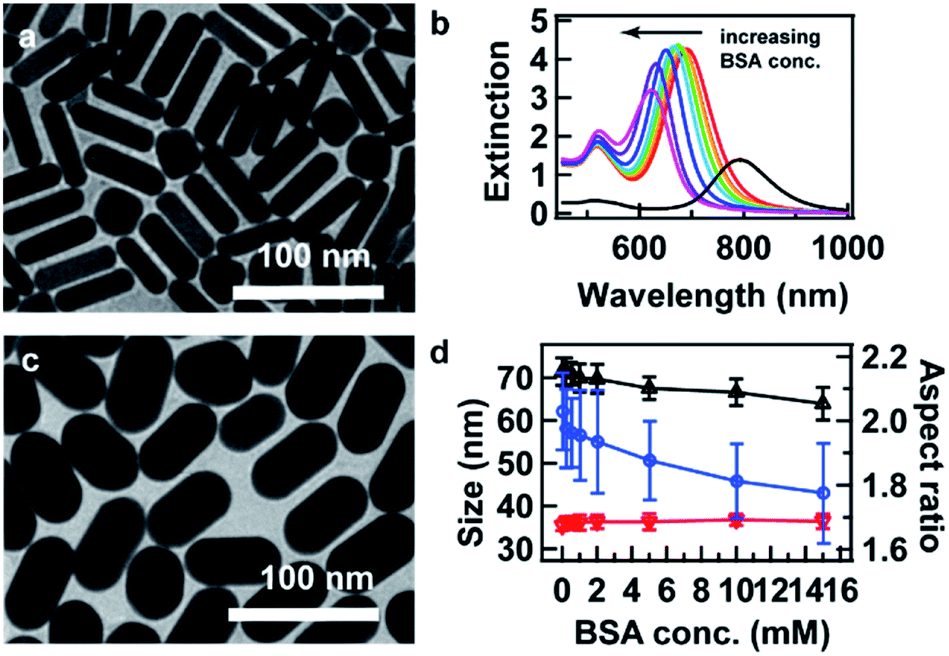 | ||
| Fig. 1 (a) TEM image of the starting AuNRs. (b) Extinction spectra of the starting AuNRs (black) and those after overgrowth (colored). The concentration of BSA in the growth solution was increased from 0 to 0.2, 0.5, 1, 2, 5, 10, and 15 mM (from right to left). The volume ratio V = 3 was fixed. (c) TEM image of the AuNRs after overgrowth at 10 mM BSA concentration. (d) Average width (red lower triangles), length (black upper triangles) and R (blue circles) of the resultant AuNRs after overgrowth as a function of BSA concentration. | ||
It is worth noting that this method produces ideally rod-like AuNRs with spherical ends. The packing of BSA molecules does not absolutely prevent the adsorption of Au adatoms from the reaction solution. In the case of a strong interaction between a thiol group and Au, the adsorption of Au adatoms is prohibited, and AuNRs with irregular-shaped ends will be produced.35
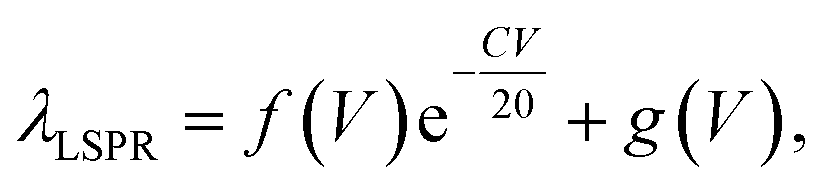
The LSPR wavelength of the resultant AuNRs is dependent not only on the BSA concentration, C, but the volume ratio V. In order to investigate the sum effects of the two parameters, a systematic study was performed using more combinations of C and V. Fig. 2a–d show the evolution of extinction spectra with increasing BSA concentration at four more values of V at 0.8, 1.6, 6, and 10. Together with V at 3 in Fig. 1b, a complete set of combinations was investigated. The spectra were fitted with Gaussian peaks to find the peak positions of LSPR in terms of wavelength, and they were plotted as a function of BSA concentration (Fig. 2e). The data points were found to match well with an exponential decay relationship:
 | (1) |
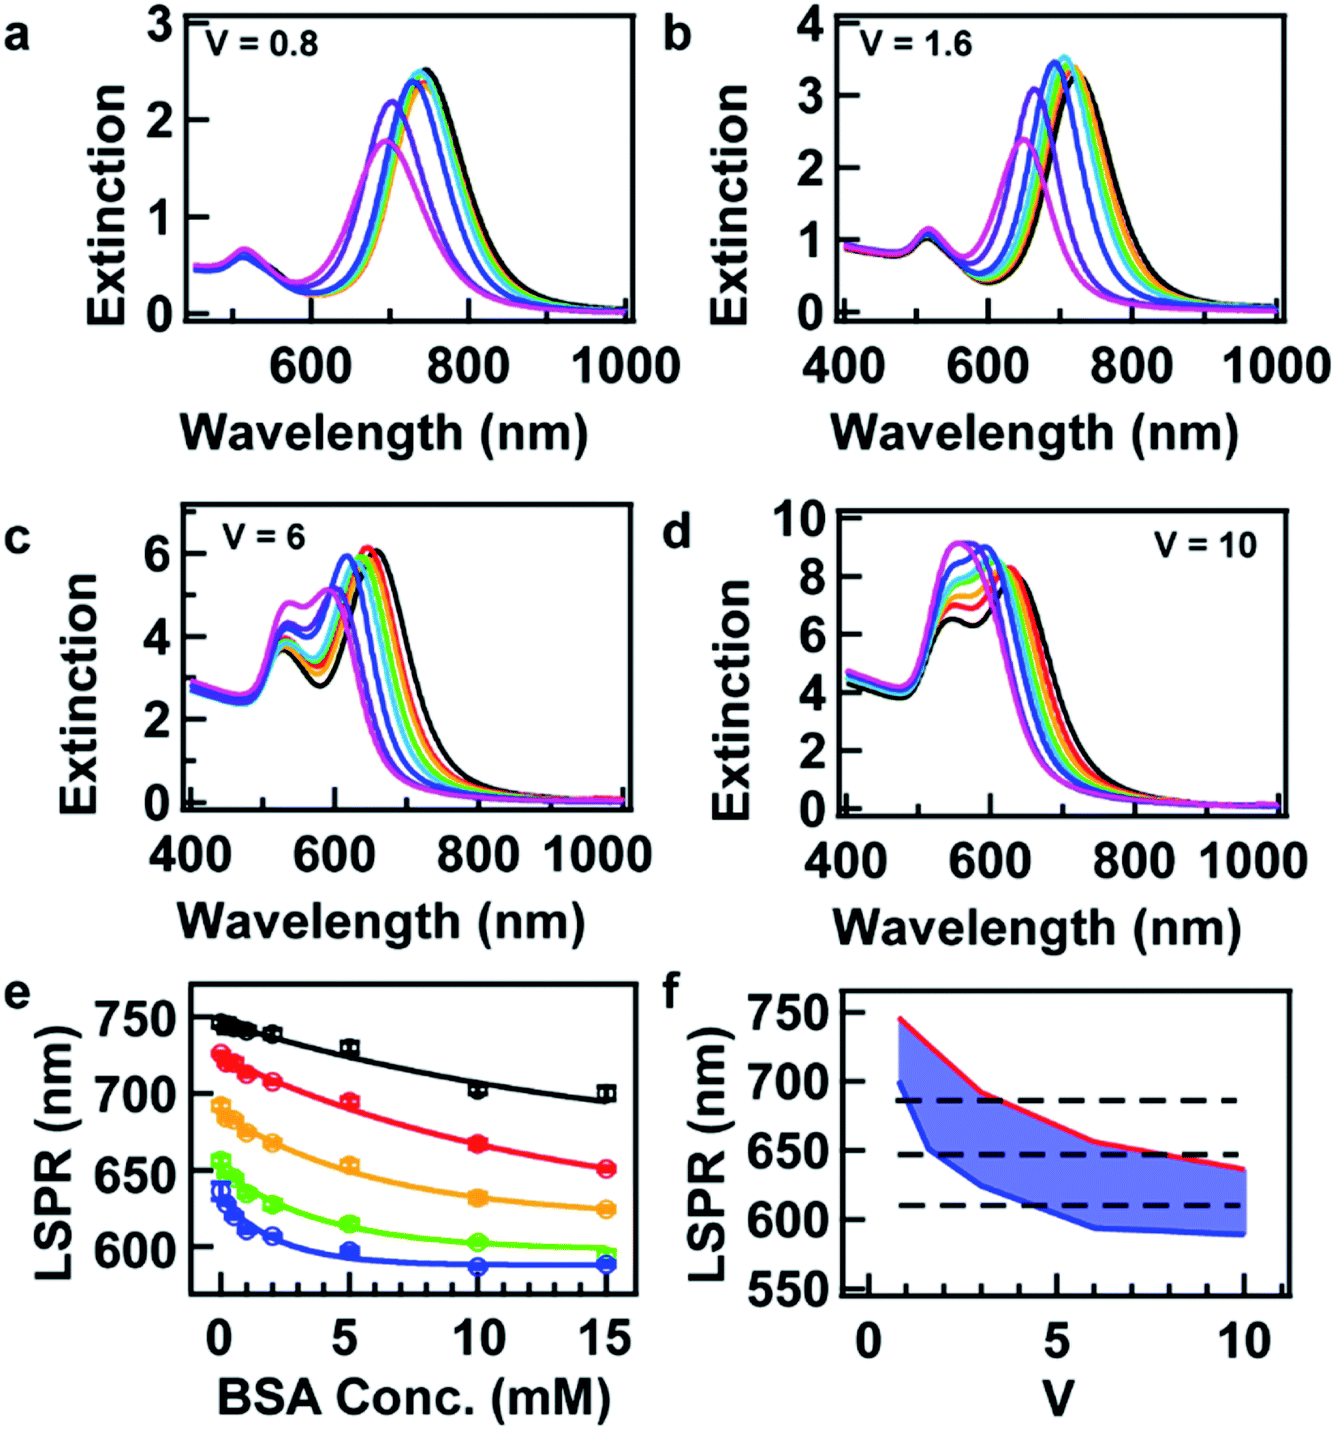 | ||
| Fig. 2 (a–d) Extinction spectra of AuNRs after overgrowth. The ratio V is 0.8, 1.6, 6, and 10, respectively. (e) LSPR wavelength as a function of the BSA concentration. V is 0.8, 1.6, 3, 6, and 10 from top to bottom. (f) Tunable range of LSPR wavelength at given values of V. | ||
The best fitting gave information about f(V) and g(V), which were further found to follow straightforward relationships, as follows:
| f(V) = 109.3e−V/2.5 + 40.4 | (2) |
| g(V) = 628.9 − 4.2V. | (3) |
Eqn (1) is empirical and states that for a given resonance wavelength, λLSPR, one can find combinations of C and V as solutions to the equation. These combinations are suitable for the synthesis of AuNRs with a target λLSPR.
For sure, tuning the LSPR wavelength using our method is not unlimited. At a given value of V, the tunable range of the LSPR wavelength has lower and upper boundaries, which is indicated as blue and red curves, respectively, in Fig. 2f. The area between these boundaries indicates realistic parameters that can be taken in the synthesis for the tuning of the LSPR wavelength using our method.
Here, we provide several examples for the synthesis of AuNRs with increasing size as well as extinction cross section at fixed target LSPR wavelengths. Three target LSPR wavelengths were manually set at 620, 645, and 690 nm. These wavelengths are represented by three straight lines in Fig. 2f, from which the lower and upper limits of V can be identified. Within the limits, three values of V were properly set for tailoring the optical cross section, and hence, corresponding values of BSA concentration were obtained from eqn (1) and are listed in Table S2 in the ESI.† Fig. 3 shows the TEM images of the resultant AuNRs after the designed overgrowth. AuNRs with increasing size (Fig. 3a–i) and extinction (Fig. 3f) were successfully synthesized, while their LSPR wavelengths were kept at fixed target values (Fig. 3j). The length, width and R of the AuNRs were measured statistically, and the average values are listed in Table S2 in the ESI.† To verify the experimental observations, a finite element method (FEM), Comsol Multiphysics, was employed for the simulation of the extinction cross sections of the AuNRs using the average sizes of AuNRs from measurement as inputs. Fig. 4a shows the simulated extinction cross section spectra of the AuNRs with increasing sizes. The simulated LSPR peaks are at the same wavelengths, matching well with the experimental results (Fig. 3j).
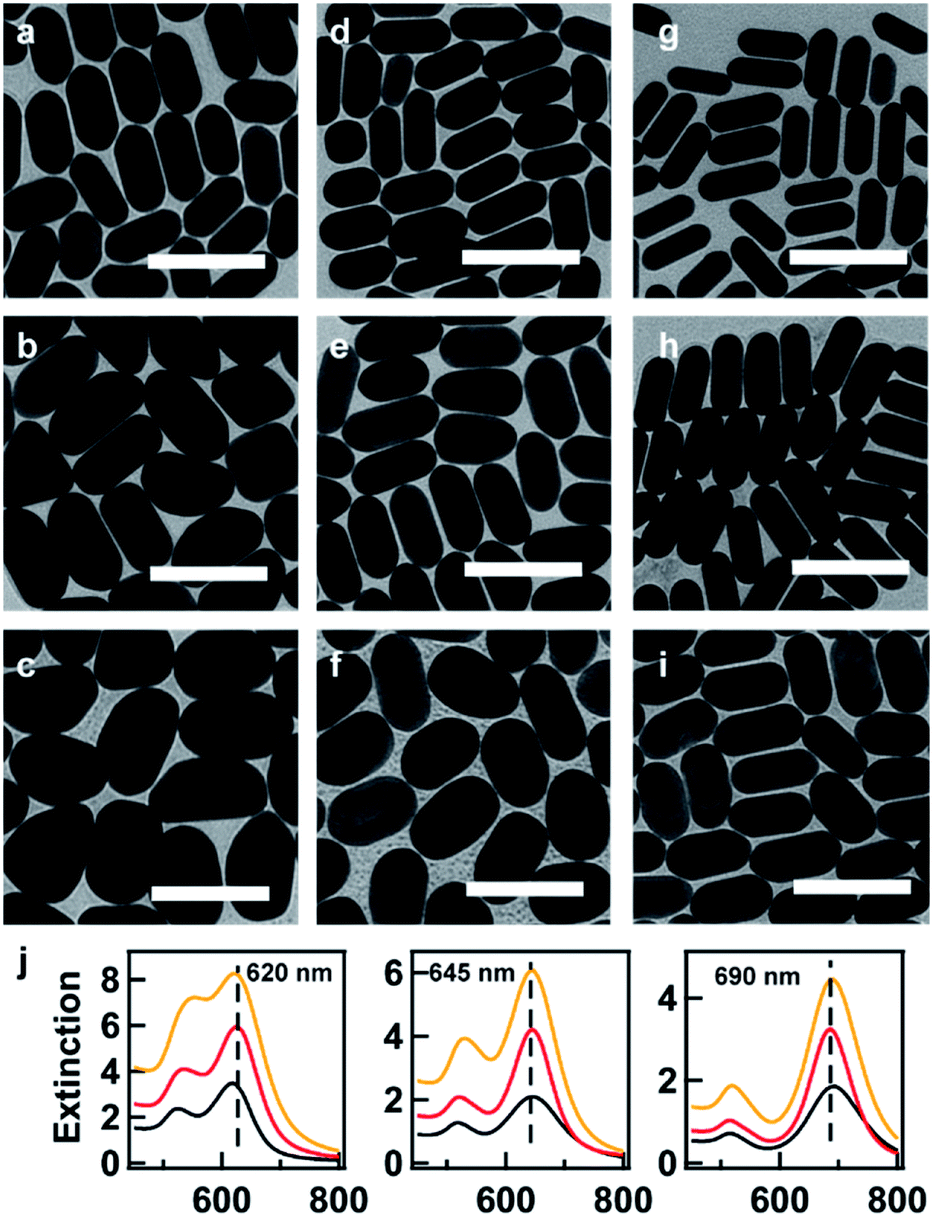 | ||
| Fig. 3 (a–c) TEM images of AuNRs with increasing size at a LSPR wavelength at 620 nm. (d–f) Those for 645 nm. (g–i) Those for 690 nm. (j) Left: Extinction spectra of AuNRs with increasing size and fixed LSPR wavelength at 620 nm. Middle: Those for 645 nm. Right: Those for 690 nm. | ||
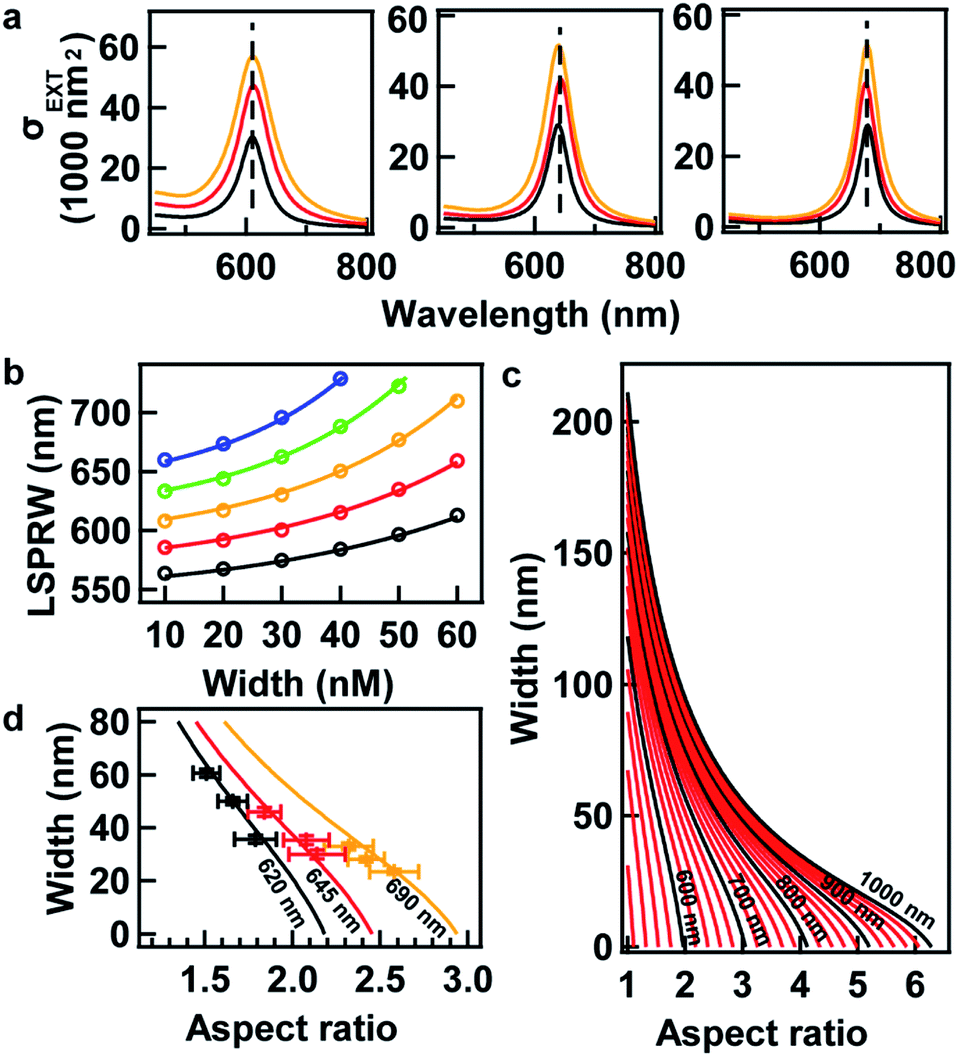 | ||
| Fig. 4 (a) Simulated extinction spectra of AuNRs using the average sizes of AuNRs from measurements. (b) Circles: LSPR wavelength of the AuNRs as a function of the width of the AuNRs. R is increased from 1.5, to 1.75, 2, 2.25, and 2.5 from bottom to top. Curves: exponential fitting. (c) Width of the AuNRs as a function of the aspect ratio at various LSPR wavelengths. The wavelengths are labelled every 20 nm in red and 100 nm in black. (d) Comparison between the measurements (dots with error bars) and simulations (curves). | ||
The LSPR of AuNRs with small size below the quasi static limit can be well described by the Gans theory, where the optical cross section and the LSPR wavelength hold linear dependence on the volume and R of the nanorod, respectively. For larger AuNRs, however, the dependence becomes implicit36,37 due to phase retardation and dynamic depolarization effects.38,39 One has to take this into account when performing the overgrowth of AuNRs at fixed LSPR wavelengths. In order to gain insight into the relationship, systematic FEM simulations were designed and performed. AuNRs with a variety of sizes and R values were simulated, where D was changed from 10 to 60 nm with a step of 10 nm, and R was tuned from 1.5 to 2.5 with a step of 0.25. Their extinction spectra were fitted with Lorentzian peaks to obtain the LSPR wavelengths. The wavelengths were then plotted as a function of D (circles, Fig. 4b). The data points were found to match an exponential increase function (curves, Fig. 4b). Finally, the best fit gave an empirical equation:
 | (4) |
| L0 = 58.7, | (5) |
| η(R) = 2.5R + 11.3, | (6) |
| ξ(R) = 90.1R + 406.5, | (7) |
Although eqn (4) is empirical, it takes a very simple form. As the product of D and R is the length of the AuNRs, the equation actually indicates that the tuning of λLSPR requires R to be tuned linearly when the length of the AuNRs is much smaller than a critical value L0 = 58.7 nm. Beyond this value, a red shift of λLSPR is expected, and the extent of the red shift is dependent on D.
It is meaningful to reveal the relationship between D and R at a certain value of λLSPR. Eqn (4) can be rewritten in the form of:
 | (8) |
Based on this picture, we drew guidelines for the rational design of the size parameters of the AuNRs and the conditions for the synthesis. For example, if AuNRs with a LSPR wavelength at 800 nm are required, Fig. 4c indicates that R and D can only be tuned in ranges from 1 to 4.2 and from 0 to 170 nm, respectively. If D is required to be 40 nm, R has to be about 3. Then, the actual volume of the nanorod can be calculated based on values of R and D, and the ratio V can be estimated on the basis of the nanorod volume. C can be finally derived from eqn (1) using V as input for the synthesis of the AuNRs. The AuNRs after the designed synthesis will possess the target dimensions as well as the LSPR properties. To prove the efficacy of our method, the dimensions of the synthesized AuNRs (Fig. 3) were measured using TEM and compared with the predicted values from the calculations. As can be seen in Fig. 4d, the data points representing the measurements are in good agreement with the curves from the simulations.
One can obtain increasing optical cross sections by increasing the size of the AuNRs. However, this becomes unrealistic when the size is too big. Eqn (8) provides an opportunity to study the varying of the optical cross sections at exactly the same LSPR wavelength for AuNRs with increasing size. At a certain LSPR wavelength of 650 nm, for example, a series of extinction spectra were obtained from simulation (Fig. 5a), where D was increased from 10 to 100 nm at a step of 10 nm, and its corresponding R was obtained by numerically solving eqn (8). Indeed, the LSPR wavelengths of the extinction peaks are located at the same value, suggesting the accuracy of the equation in the range of study. The peak value of the extinction cross section increases with the AuNR width. However, the increase starts to cease when the width of the AuNR exceeds 100 nm. This saturation can be clearly observed in Fig. 5b. It is caused by the saturation of the scattering and more importantly the decrease in the absorption. Simulation shows that a bigger nanorod does not absorb more than a smaller one when the width is larger than 40 nm (Fig. 5b). A question then arises for a nanorod as to how efficient the plasmon resonance per particle volume is. To address this point, the ratio of optical against physical cross sections was calculated and plotted as a function of width. It was found that AuNRs usually possess optical cross sections one order of magnitude larger than their physical ones. With the increase in the width, the efficiency increases in the beginning, but then stops increasing after reaching a maximum of 19 at a width of 30 nm (Fig. 5c). This result clearly indicates that AuNRs with a width of 30 nm possess the highest efficiency in terms of the optical per physical cross section.
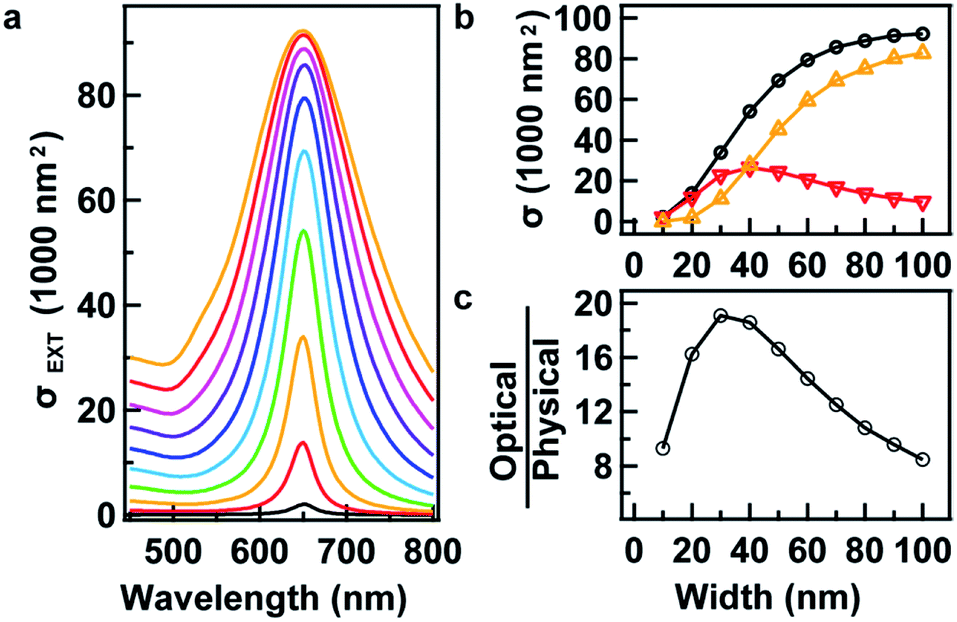 | ||
| Fig. 5 (a) Simulated extinction spectra of the AuNRs at a fixed LSPR wavelength of 650 nm. The width of the AuNRs is increased from 10 to 100 nm at a step of 10 nm from bottom to top. (b) Extinction (circle), absorption (lower triangle) and scattering (upper triangle) cross sections as a function of the AuNR width. (c) Ratio between the optical and physical cross sections as a function of the AuNR width. | ||
Experimental
Chemicals
Tetrachloroauric (III) acid (HAuCl4·3H2O), silver nitrate (AgNO3), L-ascorbic acid (AA), and sodium borohydride (NaBH4) were obtained from Sigma Aldrich. Cetyltrimethylammonium bromide (CTAB) was obtained from Kermel. 5-Bromosalicylic acid (BSA) was obtained from Aladdin. All chemicals were used without any further purification. Solutions were prepared with deionized (DI) water (18.2 MΩ).Characterization
TEM analysis was performed on a Hitachi HT7700 transmission electron microscope operating at 100 kV. Extinction spectra were recorded on an Agilent Technologies Cary 60 UV-vis spectrophotometer using cuvettes with 0.5 or 1 cm optical path.Synthesis of the starting AuNRs
AuNRs were synthesized by a modified Ag-assisted seeded growth method using binary surfactant mixtures.33 The seed solution was prepared by adding a freshly prepared, ice-cold aqueous solution of NaBH4 (600 μL, 0.01 M) into a mixture solution composed of HAuCl4·3H2O (290 μL, 8.6 mM) and CTAB (9.71 mL, 0.1 M). The solution was stirred vigorously for 2 min and aged at room temperature for 30 min before use. The growth solution was prepared by dissolving CTAB (3.6 g) and BSA (0.44 g) in 100 mL of DI water at 55 °C. To this solution, 1.92 mL of 0.01 M of freshly prepared AgNO3 was added, and after keeping it undisturbed at room temperature for 15 min, 100 mL of 1 mM HAuCl4·3H2O solution was added. After gentle mixing of the solution for 15 min, 0.52 mL of 0.1 M ascorbic acid was added under vigorous stirring for 30 s until the mixture became colorless. 0.32 mL of the seed solution was then added to the growth solution. The mixture was vigorously stirred for 30 s and left undisturbed at 27 °C overnight. The LSPR wavelength of the resulting AuNRs in water is 792 nm. The AuNR width, length, and aspect ratio measured from TEM were 16.0 ± 1.7 nm, 55.0 ± 6.1 nm, and 3.5 ± 0.4, respectively.Overgrowth of the AuNRs
A solution mixture containing 20 mM BSA and 50 mM CTAB was prepared by dissolving 0.44 g of BSA in 100 mL of 50 mM CTAB solution at 55 °C, and it was allowed to cool down to room temperature and was mixed thoroughly for 2 h before use. The solution mixture was diluted by adding various volumes of 50 mM CTAB solution to obtain 8 solution mixtures containing 0, 0.2, 0.5, 1, 2, 5, 10, and 15 mM BSA, respectively. The starting AuNRs were used as seeds. For the preparation of the seed solution, the starting AuNRs in 8 aliquots (1 mL each) were washed twice by centrifugation, and the sediments were respectively dispersed into 1 mL of the 8 solution mixtures. The growth solutions were prepared by adding HAuCl4·3H2O (633 μL, 0.01 M) into 15 mL of the 8 solution mixtures, followed immediately by the addition of a freshly prepared ascorbic acid solution (100 μL, 0.1 M) with stirring until the solution became colorless. The seed solutions were added to their corresponding growth solutions with the same BSA concentration. The volume ratios of the growth solution to the seed solution were controlled at 0.8, 1.6, 3, 6, and 10. The reaction solution was mixed by gentle inversion for 10 s and left undisturbed overnight at 27 °C.Overgrowth of the AuNRs at target LSPR wavelengths
A set of combinations of BSA concentration in the reaction solution and the volume ratio of the growth solution to the seed solution were used for AuNRs samples with ensemble LSPR wavelengths at 620, 645, and 690 nm (Table S2, ESI†). Average lengths, widths and aspect ratios of the resultant AuNRs were obtained from TEM measurements and are shown in the table.FEM calculation
A finite element method, Comsol Multiphysics, was employed to simulate the optical cross sections of AuNRs. The refractive index of the surrounding media was 1.39. In the calculations, a AuNR was modelled as a cylinder with two hemispheres at both ends. The simulation region was a cube with an edge length 5 times of the width, and the mesh size was one fiftieth of the width of the AuNR. Perfectly matched layers were set at the boundary of the simulation region.Conclusions
In conclusion, a synthetic method based on the overgrowth of AuNRs using a binary surfactant mixture consisting of BSA and CTAB was presented for fine tailoring of the optical cross sections of AuNRs at a fixed LSPR wavelength. A complete set of combinations of BSA concentration and volume of the growth solution were systematically investigated, from which an equation was obtained to provide suggested combinations for the overgrowth at a target LSPR wavelength. Examples were given for the successful synthesis of AuNRs with different optical cross sections at the same LSPR wavelength. From simulation, a nonlinear relationship was derived between the aspect ratio and the width of the AuNR at a target LSPR wavelength for the dimension design of AuNRs. Optical per physical cross sections as a function of the width clearly indicated that AuNRs with a width of 30 nm possess the highest efficiency.Conflicts of interest
There are no conflicts to declare.Acknowledgements
This work was financially supported by the National Natural Science Foundation of China (grants 21271181 and 21473240).Notes and references
- T. Ming, H. J. Chen, R. B. Jiang, Q. Li and J. F. Wang, J. Phys. Chem. Lett., 2012, 3, 191–202 CrossRef CAS.
- M. J. Banholzer, J. E. Millstone, L. D. Qin and C. A. Mirkin, Chem. Soc. Rev., 2008, 37, 885–897 RSC.
- M. E. Stewart, C. R. Anderton, L. B. Thompson, J. Maria, S. K. Gray, J. A. Rogers and R. G. Nuzzo, Chem. Rev., 2008, 108, 494–521 CrossRef CAS PubMed.
- S. Linic, P. Christopher and D. B. Ingram, Nat. Mater., 2011, 10, 911–921 CrossRef CAS PubMed.
- X. H. Huang, I. H. El-Sayed, W. Qian and M. A. El-Sayed, J. Am. Chem. Soc., 2006, 128, 2115–2120 CrossRef CAS PubMed.
- H. J. Chen, L. Shao, T. A. Ming, Z. H. Sun, C. M. Zhao, B. C. Yang and J. F. Wang, Small, 2010, 6, 2272–2280 CrossRef CAS PubMed.
- H. L. Jia, C. H. Fang, X. M. Zhu, Q. F. Ruan, Y. X. J. Wang and J. F. Wang, Langmuir, 2015, 31, 7418–7426 CrossRef CAS PubMed.
- B. Nikoobakht and M. A. El-Sayed, Chem. Mater., 2003, 15, 1957–1962 CrossRef CAS.
- N. R. Jana, L. Gearheart and C. J. Murphy, Adv. Mater., 2001, 13, 1389–1393 CrossRef CAS.
- S. Yoon, B. Lee, J. Yun, J. G. Han, J. S. Lee and J. H. Lee, Nanoscale, 2017, 9, 7114–7123 RSC.
- Y. Xu, L. Chen, X. C. Ye, X. C. Wang, J. Q. Yu, Y. Zhao, M. H. Cao, Z. H. Xia, B. Q. Sun and Q. Zhang, Nano Res., 2017, 10, 2146–2155 CrossRef CAS.
- X. W. Liu, J. W. Yao, J. J. Luo, X. S. Duan, Y. B. Yao and T. Liu, Langmuir, 2017, 33, 7479–7485 CrossRef CAS PubMed.
- N. D. Burrows, S. Harvey, F. A. Idesis and C. J. Murphy, Langmuir, 2017, 33, 1891–1907 CrossRef CAS PubMed.
- N. Almora-Barrios, G. Novell-Leruth, P. Whiting, L. M. Liz-Marzan and N. Lopez, Nano Lett., 2014, 14, 871–875 CrossRef CAS PubMed.
- N. Garg, C. Scholl, A. Mohanty and R. Jin, Langmuir, 2010, 26, 10271–10276 CrossRef CAS PubMed.
- D. K. Smith and B. A. Korgel, Langmuir, 2008, 24, 644–649 CrossRef CAS PubMed.
- M. Z. Liu and P. Guyot-Sionnest, J. Phys. Chem. B, 2005, 109, 22192–22200 CrossRef CAS PubMed.
- R. M. Pallares, X. Su, S. H. Lim and N. T. K. Thanh, J. Mater. Chem. C, 2016, 4, 53–61 RSC.
- L. Zhang, K. Xia, Z. Lu, G. Li, J. Chen, Y. Deng, S. Li, F. Zhou and N. He, Chem. Mater., 2014, 26, 1794–1798 CrossRef CAS.
- D. Xu, J. Mao, Y. He and E. S. Yeung, J. Mater. Chem. C, 2014, 2, 4989 RSC.
- K. Park, S. Biswas, S. Kanel, D. Nepal and R. A. Vaia, J. Phys. Chem. C, 2014, 118, 5918–5926 CrossRef CAS.
- C. K. Tsung, X. S. Kou, Q. H. Shi, J. P. Zhang, M. H. Yeung, J. F. Wang and G. D. Stucky, J. Am. Chem. Soc., 2006, 128, 5352–5353 CrossRef CAS PubMed.
- Q. Zhu, J. Wu, J. Zhao and W. Ni, Langmuir, 2015, 31, 4072–4077 CrossRef CAS PubMed.
- B. Szychowski, H. Leng, M. Pelton and M. C. Daniel, Nanoscale, 2018, 10, 16830–16838 RSC.
- W. H. Ni, X. S. Kou, Z. Yang and J. F. Wang, ACS Nano, 2008, 2, 677–686 CrossRef CAS.
- B. N. Khlebtsov, V. A. Khanadeev, J. Ye, G. B. Sukhorukov and N. G. Khlebtsov, Langmuir, 2014, 30, 1696–1703 CrossRef CAS PubMed.
- Y. Park and J. Kim, RSC Adv., 2015, 5, 52459–52465 RSC.
- X. Ye, Y. Gao, J. Chen, D. C. Reifsnyder, C. Zheng and C. B. Murray, Nano Lett., 2013, 13, 2163–2171 CrossRef CAS PubMed.
- X. Ye, C. Zheng, J. Chen, Y. Gao and C. B. Murray, Nano Lett., 2013, 13, 765–771 CrossRef CAS PubMed.
- X. C. Ye, L. H. Jin, H. Caglayan, J. Chen, G. Z. Xing, C. Zheng, D. N. Vicky, Y. J. Kang, N. Engheta, C. R. Kagan and C. B. Murray, ACS Nano, 2012, 6, 2804–2817 CrossRef CAS PubMed.
- L. Scarabelli, M. Grzelczak and L. M. Liz-Marzan, Chem. Mater., 2013, 25, 4232–4238 CrossRef CAS.
- X. S. Kou, S. Z. Zhang, Z. Yang, C. K. Tsung, G. D. Stucky, L. D. Sun, J. F. Wang and C. H. Yan, J. Am. Chem. Soc., 2007, 129, 6402–6404 CrossRef CAS PubMed.
- Z. Zheng, T. Tachikawa and T. Majima, J. Am. Chem. Soc., 2014, 136, 6870–6873 CrossRef CAS PubMed.
- B. Nikoobakht and M. A. El-Sayed, Langmuir, 2001, 17, 6368–6374 CrossRef CAS.
- H. Jia, X. M. Zhu, R. Jiang and J. Wang, ACS Appl. Mater. Interfaces, 2017, 9, 2560–2571 CrossRef CAS PubMed.
- L. S. Slaughter, W.-S. Chang, P. Swanglap, A. Tcherniak, B. P. Khanal, E. R. Zubarev and S. Link, J. Phys. Chem. C, 2010, 114, 4934–4938 CrossRef CAS.
- J. W. M. Osterrieth, D. Wright, H. Noh, C. W. Kung, D. Vulpe, A. Li, J. E. Park, R. P. Van Duyne, P. Z. Moghadam, J. J. Baumberg, O. K. Farha and D. Fairen-Jimenez, J. Am. Chem. Soc., 2019, 141, 3893–3900 CrossRef CAS PubMed.
- H. Kuwata, H. Tamaru, K. Esumi and K. Miyano, Appl. Phys. Lett., 2003, 83, 4625–4627 CrossRef CAS.
- L. Zhu, M. Gao, C. K. N. Peh and G. W. Ho, Mater. Horiz., 2018, 5, 323–343 RSC.
Footnote |
| † Electronic supplementary information (ESI) available: Length, width, and aspect ratio of AuNRs from statistical measurement. See DOI: 10.1039/c9ra02106j |
| This journal is © The Royal Society of Chemistry 2019 |