DOI:
10.1039/C9RA02647A
(Paper)
RSC Adv., 2019,
9, 16035-16039
Cytotoxic metabolites from the endophytic fungus Chaetomium globosum 7951†
Received
9th April 2019
, Accepted 12th May 2019
First published on 21st May 2019
Abstract
The following compounds were isolated from acetate extracts of Chaetomium globosum 7951 solid cultures: demethylchaetocochin C (1) and chaetoperazine A (3), two new epipolythiodioxopiperazine (ETP) alkaloids, a novel pyridine benzamide, 4-formyl-N-(3′-hydroxypyridin-2′-yl) benzamide (6), and three known ETP derivatives (2, 4, and 5). The structures of these compounds were determined using extensive spectroscopic data analysis. Compounds 1–3, and 6, inhibited the growth of MCF-7, MDA-MB-231, H460 and HCT-8 cells with an IC50 of 4.5 to 65.0 μM.
Introduction
Novel bioactive secondary metabolites have been identified in endophytic fungi.1–3 The Chaetomium genus, belonging to the Chaetomiaceae family, contains more than 100 species derived from terrestrial and marine habitats.4 Chaetomium globosum is a species of the Chaetomium genus. The isolation of the cytotoxic chaetoglobosins A and B was reported by Sekita and coworkers in 1973.5 Since then more than 200 metabolites including chaetoglobosins, diketopiperazines, tetramic acids, bis(3-indolyl)-benzoquinones, azaphilones, pyranones, xanthones, anthraquinones, orsellides, steroids, and terpenoids were identified in C. globosum cultures. Some of these metabolites exhibit cytotoxic, antibacterial, antimalarial, and antiviral activities.6
Epipolythiodioxopiperazine (ETP) alkaloids, with either polysulphide bridges or thiomethyl groups, represent an important family of bioactive secondary metabolites, which are toxic to cancer cell lines.7 About 20 ETPs have been identified in the Chaetomium genus.6 During our search for novel and bioactive compounds from microorganisms,8–10 we identified the endophytic fungus, Chaetomium globosum 7951, which has cytotoxic activity towards human breast cancer cell lines. Chaetomium globosum 7951 comes from the root of Panax notoginseng, a traditional Chinese medicine. Chemical investigations of the solid fermentation of the Chaetomium globosum 7951 strain led to the identification of 2 new ETP alkaloids, 3 known analogs, and a new pyridine benzamide. Herein, the isolation, structural determination, and cytotoxicity of these compounds are described.
Results and discussion
The molecular formula of compound 1, a white amorphous powder, is C32H34N6O6S4 according to the (+)-HRESIMS data, with 19 degrees of unsaturation. The IR spectrum displayed the hydroxy or amino (3359 cm−1), methyl (2921 cm−1), and carbonyl (1680 cm−1) functionalities. The 1H NMR spectrum (Table 1) showed two ortho-disubstituted benzene rings at δH 6.72 (1H, d), 6.77 (1H, t), 7.03 (1H, t), 7.08 (1H, t), 7.17 (1H, t), 7.22 (1H, d), 7.50 (1H, d) and 7.63 (1H, d), and a trisubstituted double bond at δH 7.07 (1H, s) in the lower field. In addition, four methylene groups (δH 3.61, 3.04, 4.04, 3.21, 4.21, 4.32, 3.73, and 3.43), one methine group (δH 6.07), and four isolated methyl groups (δH 2.12, 2.28, 2.77, and 3.11) were observed in the higher field. According to the 13C NMR and DEPT spectra analyses, in addition to the structural features above, there were also four carbonyls at δC 161.1, 164.3, 165.3, and 165.6, and five quaternary carbons at δC 65.0, 72.9, 73.2, 73.7, and 77.2. The spectral data, combined with the molecular formula, suggested that compound 1 is an analog of epipolythiodioxopiperazine. Extensive analysis of the NMR data indicates similarities in chemical shifts to chaetocochin C,11 including the absence of one methyl group in 1. HMBC correlations of NH-5′ with C-1′, C-3′, C-4′, C-5′, and C-6′, and of N-CH3-2′ with C-1′, and C-3′ indicated that N-CH3-5′ in chaetocochin C was replaced by NH in 1. The ROESY correlations of H-5 with H-9′, and of 3′-S-Me with 6′-S-Me, combined with the CD effects at λmax nm (Δε) 240 (+7.2), 274 (−0.89) and 305 (+3.6),11 and based on the similar biogenetic perspective of chaetocochin C, which revealed the absolute configuration of 1 was shown in Fig. 1.
Table 1 NMR spectroscopic data of 1 and 3a
| No. |
1 |
No. |
3 |
| δH |
δC, type |
δH |
δC, type |
| NMR data (δ) were measured at 600 MHz for 1H and at 150 MHz for 13C in DMSO-d6. The assignments were based on 1H–1H COSY, HSQC, and HMBC experiments. J-value was not determined due to overlapped signals. |
| 1 |
|
165.3, C |
1 |
|
162.7, C |
| 2-N-Me |
3.11, s |
27.7, CH3 |
2-N-OMe |
3.65, s |
61.0, CH3 |
| 3 |
|
77.2, C |
3 |
4.36, t (2.4) |
63.5, CH |
| 4 |
|
161.1, C |
4 |
|
165.1, C |
| 5 |
6.07, d (1.8) |
80.0, CH |
NH-5 |
8.58, s |
|
| 6a |
|
149.4, C |
6 |
|
66.5, C |
| 7 |
6.72, d (7.8) |
110.1, CH |
6-S-Me |
2.13, s |
12.5, C |
| 8 |
7.17, t (7.8) |
130.5, CH |
7 |
3.58, d (14.4) |
33.7, CH2 |
| 9 |
6.77, t (7.8) |
118.8, CH |
|
3.20, d (14.4) |
|
| 10 |
7.50, d (7.8) |
125.9, CH |
8 |
|
107.2, C |
| 10a |
|
126.9, C |
9 |
7.19, d (2.4) |
125.0, CH |
| 10b |
|
73.2, C |
NH-10 |
10.90, s |
|
| 11 |
4.04, d (15.6) |
42.1, CH2 |
10a |
|
135.6, C |
| |
3.21, d (15.6) |
|
11 |
7.28, d (7.8) |
111.1, CH |
| 12 |
|
73.7, C |
12 |
7.02, t (7.8) |
120.7, CH |
| 13 |
4.32, dd (12.6, 4.8) |
58.7, CH2 |
13 |
6.93, t (7.8) |
118.3, CH |
| |
4.21, dd (12.6, 6) |
|
14 |
7.58, d (7.8) |
118.9, CH |
| OH-13 |
5.93, t (6) |
|
14a |
|
127.9, C |
| 1′ |
|
165.6, C |
15 |
3.58, ovb |
58.5, CH2 |
| 2′-N-Me |
2.77, s |
28.4, CH3 |
OH-15 |
4.93, t (5.4) |
|
| 3′ |
|
72.9, C |
|
|
|
| 3′-S-Me |
2.12, s |
12.3, CH3 |
|
|
|
| 4′ |
|
164.3, C |
|
|
|
| NH-5′ |
9.06, s |
|
|
|
|
| 6′ |
|
65.0, C |
|
|
|
| 6′-S-Me |
2.28, s |
13.9, CH3 |
|
|
|
| 7′ |
3.61, d (15.4) |
33.9, CH2 |
|
|
|
| |
3.04, d (15.4) |
|
|
|
|
| 8′ |
|
107.4, C |
|
|
|
| 9′ |
7.07, s |
126.8, CH |
|
|
|
| 10′a |
|
133.3, C |
|
|
|
| 11′ |
7.22, d (7.8) |
110.6, CH |
|
|
|
| 12′ |
7.08, t (7.8) |
121.4, CH |
|
|
|
| 13′ |
7.03, t (7.8) |
119.1, CH |
|
|
|
| 14′ |
7.63, d (7.8) |
120.0, CH |
|
|
|
| 14′a |
|
130.3, C |
|
|
|
| 15′ |
3.73, dd (10.8, 6) |
62.8, CH2 |
|
|
|
| |
3.43, dd (10.8, 4.8) |
|
|
|
|
| OH-15′ |
4.90, t (6) |
|
|
|
|
 |
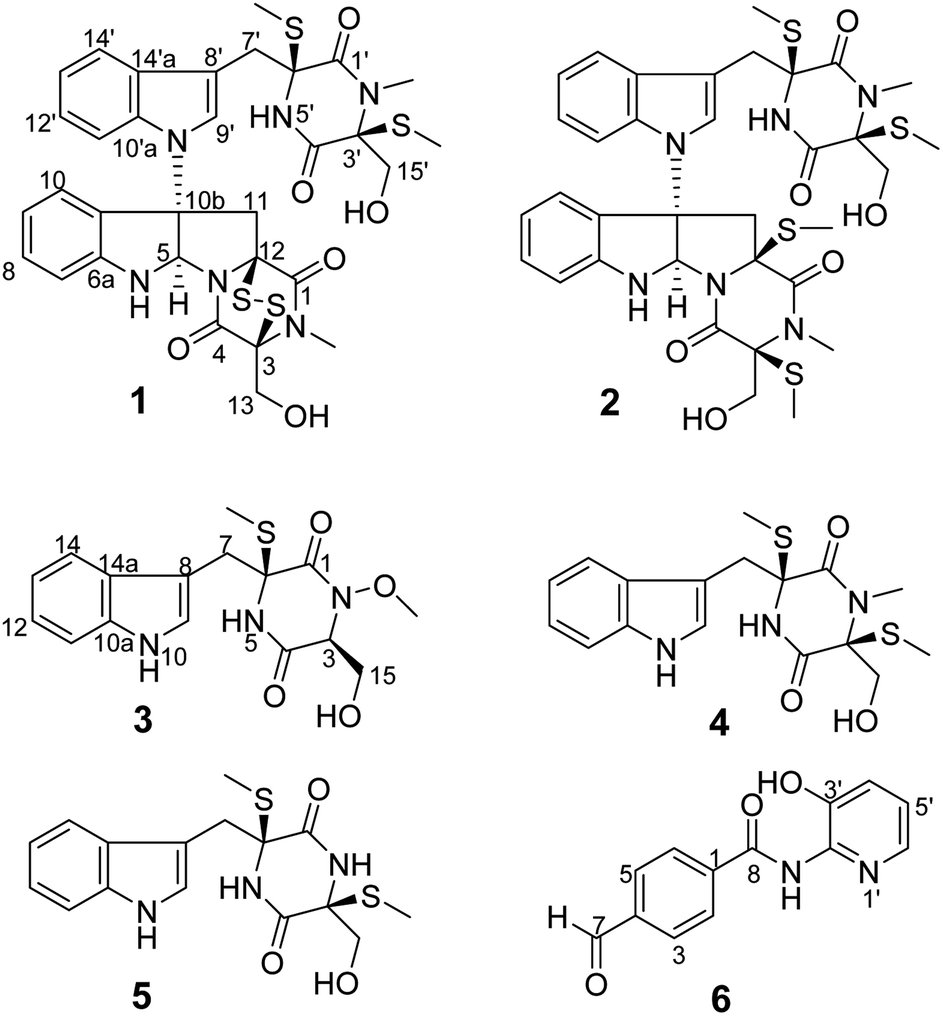
| | Fig. 1 The structures of compounds 1–6. | |
The molecular formula of compound 3 is C16H19N3O4S according to the HRESIMS data. The IR spectrum displayed absorptions bands at 3393, 3194, 2921, and 1675 cm−1, suggesting the presence of amino or hydroxyl, methyl, and carbonyl groups. The 1H-NMR spectrum (Table 1) showed 3-substituted indole moiety signals at δH 6.94 (1H, t), 7.02 (1H, t), 7.19 (1H, d), 7.29 (1H, d) and 7.58 (1H, d), two methylene groups at δH 3.58 (1H, d), 3.20 (1H, d), and 3.56 (2H, m), a methine group at δH 4.36 (1H, t), one isolated methyl at δH 2.13 (3H, s), and a methoxyl group at 3.65 (3H, s). In addition, two carbonyls at δC 162.7 and 165.1, and a quaternary carbon at δC 66.7 were identified via the 13C-NMR spectrum. HMBC correlations of H-7 with C-7, C-8, and C-10a; NH-5 (δH 8.58) with C-1, C-6, and C-7; and S-Me-6 with C-6, revealed an α-S-methyl-substituted tryptophan residue. In addition, 1H–1H COSY relationships between H-3/H2-15/OH-15, in combination with the HMBC relationships between H-3 and H-15 with C-16, indicate a serine residue. Meanwhile, the association of NH-5 with C-3 and H-3 with C-1 in the HMBC spectrum suggests that the serine and tryptophan residues form a diketopiperazine ring. Finally, the methoxyl group is located at N-3, as indicated by the molecular formula and the chemical shift at δC 61.0. Thus, compound 3 was proposed as shown in Fig. 2. DP4+ analysis of the 1H and 13C NMR data indicates 3S*,6S*-3 appeared agreement with the experimental NMR data with 100% probability (Tables S3–S7†).12,13 Based on the common biosynthetic origin, the absolute configuration at C-3 and C-6 is probably to be the same as cyclo-L-Trp-L-Ser.14 In addition, the calculated optical rotation (OR) value8 (+56.1) of (3S, 6S)-3 (Table S8†) is similar to the experiment OR value (+80.0), which supports the above speculation.
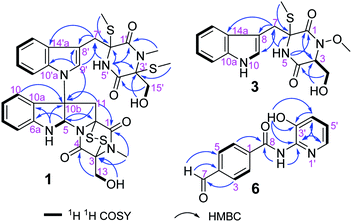 |
| | Fig. 2 Key 1H–1H COSY and HMBC correlations of 1, 3 and 6. | |
The molecular formula of compound 6, a white amorphous powder, is C13H10N2O3, in accordance with the HRESIMS at m/z 243.0769 [M + H]+ (calculated for C13H11N2O3, 243.0770). Amino or hydroxyl (3388, 3189 cm−1), conjugated carbonyl (1690 cm−1), and aromatic ring (1621, 1556, and 1453 cm−1) groups were observed in the IR spectrum. The 1H-NMR spectrum (Table 2) suggests a para-substituted phenyl at δH 8.03 (2H, d) and 8.17 (2H, d). Three aromatic proton signals at δH 7.21 (1H, dd), 7.33 (1H, dd), and 7.95 (1H, d) and three exchanged protons at δH 10.64 (1H, s), 10.10 (1H, s), and 9.88 (1H, s) are also observed in the 1H-NMR spectrum. HMBC relationships of H-7 with C-3 and C-5, H-2 and H-6 with C-10, and NH-8 with C-8 suggest a 4-formylbenzamide unit in 6. The 1H–1H COSY correlations display an isolated spin system as H-4′/H-5′/H-6′. Meanwhile, the HMBC relationships of H-6′ with C-2′ and OH-3′ with C-2′, C-3′, and C-4′, combined with the molecular composition and chemical shifts, revealed a 2-substituted pyridin-3-ol moiety. Finally, the correlation of NH-8 with C-2′ in the HMBC spectrum demonstrates that the above two units are linked via NH-8 to C-2′. Thus, compound 6 is 4-formyl-N-(3′-hydroxypyridin-2′-yl) benzamide.
Table 2 NMR spectroscopic data of 6a
| No. |
6 |
| δH |
δC, type |
| NMR data (δ) were measured at 600 MHz for 1H and at 150 MHz for 13C in DMSO-d6. The assignments were based on 1H–1H COSY, HSQC, and HMBC experiments. |
| 1 |
|
138.8, C |
| 2 |
8.17, d (8.4) |
128.7, CH |
| 3 |
8.03, d (8.4) |
129.4, CH |
| 4 |
|
138.1, C |
| 5 |
8.03, d (8.4) |
129.4, CH |
| 6 |
8.17, d (8.4) |
128.7, CH |
| 7 |
10.10, s |
193.0, CH |
| 8 |
|
165.2, C |
| NH-8 |
10.64, s |
|
| 2′ |
|
147.7, C |
| 3′ |
|
139.9, C |
| OH-3′ |
9.88, s |
|
| 4′ |
7.33, dd (8.4, 1.2) |
124.7, CH |
| 5′ |
7.21, dd (8.4, 4.2) |
123.2, CH |
| 6′ |
7.95, d (5.4) |
138.6, CH |
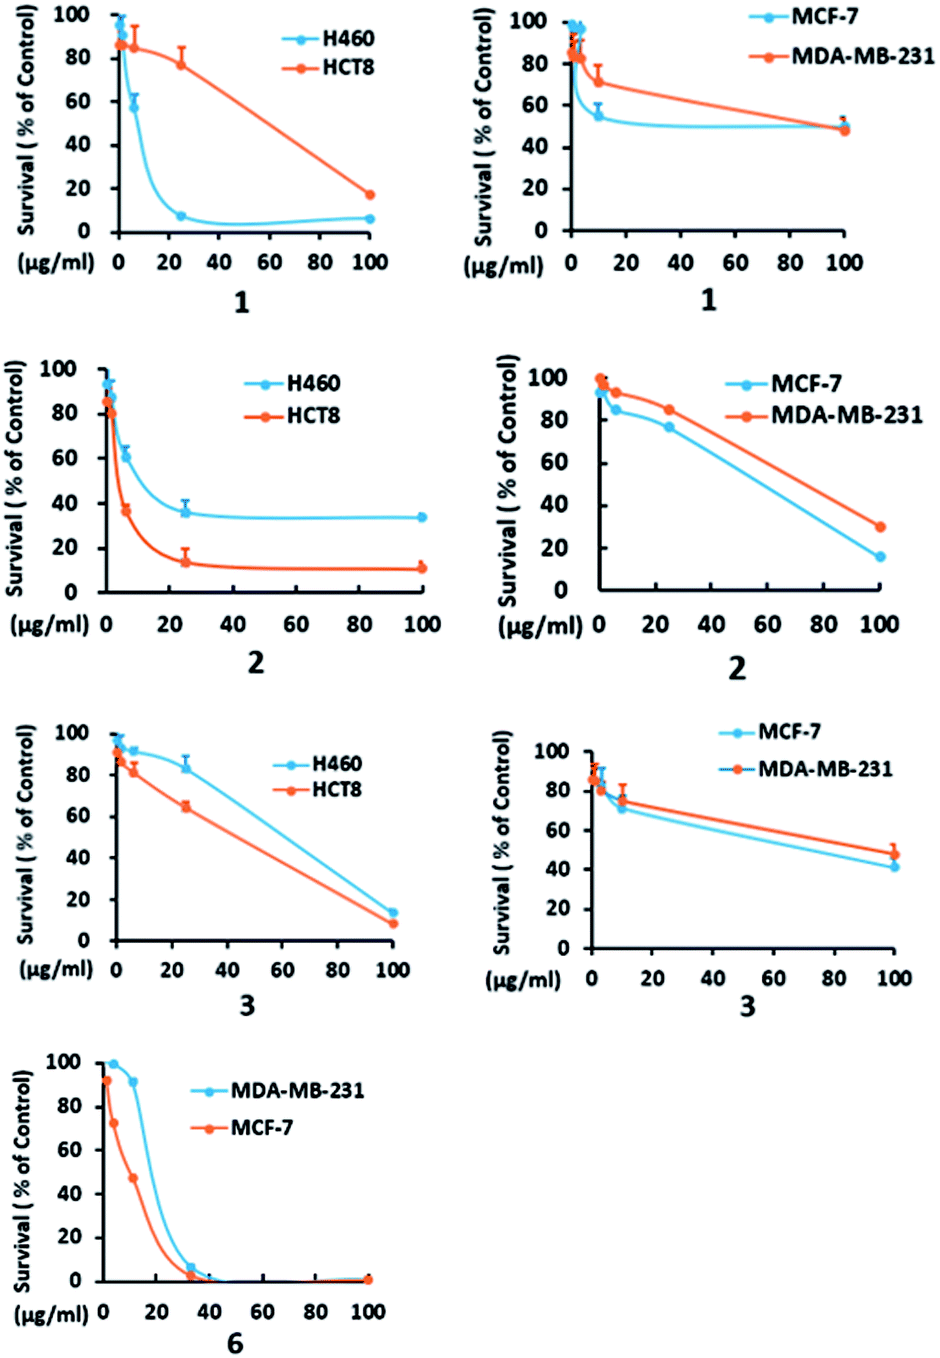
In addition to compounds 1, 3, and 6, the known dethio-tetra(methylthio)chetomin (2),15 chetoseminudin B (4),16 and chetoseminudin C (5),16 were also isolated from the Chaetomium globosum 7951. The cytotoxic effects of these compounds against human cancer cell lines were evaluated. Compounds 1–3 and 6 inhibited the growth of MCF-7, MDA-MB-231, H460, and HCT-8 cells (IC50 from 4.5 to 65.0 μM). Compounds 4 and 5 were inactive (IC50 > 100 μM) (Table 3, Fig. 3).
Table 3 Cytotoxicity against human cancer cell lines of 1–6
| Compd. |
IC50 (μM) |
| MCF-7 |
MDA-MB-231 |
H460 |
HCT-8 |
| 1 |
20.1 ± 2.5 |
50.3 ± 3.6 |
7.0 ± 0.8 |
30.3 ± 3.9 |
| 2 |
60.5 ± 7.0 |
61.2 ± 5.6 |
9.4 ± 0.7 |
4.5 ± 0.5 |
| 3 |
30.3 ± 2.8 |
50.4 ± 5.0 |
65.0 ± 6.0 |
41.9 ± 5.0 |
| 4 |
>100 |
>100 |
>100 |
>100 |
| 5 |
>100 |
>100 |
>100 |
>100 |
| 6 |
18.0 ± 1.5 |
25.2 ± 2.8 |
>100 |
>100 |
| Cisplatin |
36.0 ± 3.0 |
28.0 ± 3.0 |
9.0 ± 0.6 |
3.5 ± 0.2 |
| Doxorubicin |
0.5 ± 0.02 |
0.3 ± 0.03 |
6.2 ± 0.3 |
0.3 ± 0.02 |
 |
| | Fig. 3 H460, HCT8, MCF-7 and MDA-MB-231 cells were treated with the indicated concentrations of 1–3 and 6, and cell survival was detected by the CCK8 assay. A dose-dependent curve was depicted. | |
Experimental
General experimental procedures
See the ESI.†
Microorganism and fermentation
The fungus Chaetomium globosum 7951 was isolated from the fresh healthy roots of Panax notoginseng gathered in Wenshan, Yunnan Province, China, in 2015. The strain, which was assigned the accession no. SUB5310227, was identified using nuclear 18S rDNA sequences (GenBank: MK625020) and deposited in the Microbiology Laboratory at Shenyang Pharmaceutical University. C. globosum 7951, an endophytic fungus, was grown on PDA at 26 °C for 6 days, and then flushed (sterilized water) into 250 ml Erlenmeyer flasks containing 50 g rice and autoclaved (121 °C, 30 min). The fermentation was then incubated at 26 °C for 40 days.
Extraction and isolation
The cultures (10 kg) were extracted three times with methanol and then filtered. The filtrate was concentrated and three extractions were performed with equal volumes of EtOAc. The EtOAc layer was evaporated with reduced pressure resulting in a crude broth extract (12.2 g). The extract was separated into 15 fractions (A–O) using silica gel column chromatography with a CH2Cl2/MeOH gradient elution. Fraction H was purified using Sephadex LH-20 gel column chromatography with CH2Cl2/MeOH (1![[thin space (1/6-em)]](https://www.rsc.org/images/entities/char_2009.gif) :1), resulting in subfractions H1–H8. Subfraction H5 was subjected to semi-preparative HPLC with 50% acetonitrile elution into 0.1% trifluoroacetic acid to isolate compound 1. Fraction J was purified by ODS C18 with a gradient of methanol in water (10–100%) to give six subfractions (J1–J6). Subfraction J3 was subjected to preparative TLC using CH2Cl2/MeOH (20:1) and then subjected to semi-preparative HPLC with 30% acetonitrile/H2O (0.1% CF3COOH) as the mobile phase to generate compound 6. Fraction K was separated into fractions using silica gel CC with CH2Cl2/MeOH (50:1), resulting in fractions K1–K3. Fraction K1 was purified with semi-preparative HPLC with 19% acetonitrile into an aqueous 0.1% trifluoroacetic acid solution, resulting in compound 3.
:1), resulting in subfractions H1–H8. Subfraction H5 was subjected to semi-preparative HPLC with 50% acetonitrile elution into 0.1% trifluoroacetic acid to isolate compound 1. Fraction J was purified by ODS C18 with a gradient of methanol in water (10–100%) to give six subfractions (J1–J6). Subfraction J3 was subjected to preparative TLC using CH2Cl2/MeOH (20:1) and then subjected to semi-preparative HPLC with 30% acetonitrile/H2O (0.1% CF3COOH) as the mobile phase to generate compound 6. Fraction K was separated into fractions using silica gel CC with CH2Cl2/MeOH (50:1), resulting in fractions K1–K3. Fraction K1 was purified with semi-preparative HPLC with 19% acetonitrile into an aqueous 0.1% trifluoroacetic acid solution, resulting in compound 3.
Demethylchaetocochin C (1). White amorphous powder; [α]20D 61.0 (c 0.3, MeOH); UV (MeOH) λmax 219, 286 nm; IR νmax 3359, 3193, 2921, 2851, 1680, 1468, 1425, 1207, 1140, 1061, 1027, 722 cm−1; 1H NMR (DMSO-d6, 600 MHz) data and 13C NMR (DMSO-d6, 150 MHz) data, see Table 1. (+)-HR-ESIMS m/z 727.1499 [M + H]+ (calcd for C32H35N6O6S4, 727.1501).
Chaetoperazine A (3). White amorphous powder; [α]20D 80.0 (c 0.3, MeOH); UV (MeOH) λmax 199, 273 nm; IR νmax 3393, 3194, 2922, 2850, 1675, 1424, 1205, 1141, 801, 749, 723 cm−1; 1H NMR (DMSO-d6, 600 MHz) data and 13C NMR (DMSO-d6, 150 MHz) data, see Table 1. (+)-HR-ESIMS m/z 372.0994 [M + Na]+ (calcd for C16H19N3O4NaS, 372.0994).
4-Formyl-N-(3′-hydroxypyridin-2′-yl) benzamide (6). White amorphous powder; UV (MeOH) λmax 254, 325 nm; IR νmax 3388, 3189, 2921, 2850, 1690, 1621, 1556, 1453, 1387, 1320, 1210, 1142, 1052, 1029, 1011, 838, 724 cm−1; 1H NMR (DMSO-d6, 600 MHz) data and 13C NMR (DMSO-d6, 150 MHz) data, see Table 2. (+)-HR-ESIMS m/z 243.0769 [M + H]+ (calcd for C13H11N2O3, 243.0770).
ORs and NMR calculation of 3
See the ESI.†
Cytotoxicity assay
A CCK colorimetric assay was used to measure the cytotoxicity of compounds 1–6 was in human breast adenocarcinoma cell (MCF-7 and MDA-MB-231), human large cell lung cancer cell (H460) and human cecal adenocarcinoma cell (HCT-8). All of the cell lines were obtained from ATCC. Cells (5 × 10³ cells per mL) were added to 96-well culture dishes and grown for 24 h (5% CO2, 37 °C) followed by the addition of fresh medium (100 μL) and the test compound. After an additional 48 h, the media was removed and fresh media with 10% CCK solution was added. The cells were incubated for 1 h (37 °C) and then the optical density at 450 nm was determined. Each assay was replicated six times. IC50 values for each cell line were determined.
Conclusions
In conclusion, two new ETPs alkaloids (1, and 3), a new pyridine benzamide (6), and three known ETPs compounds were identified in the endophytic fungus Chaetomium globosum 7951. These new compounds moderately inhibit the human breast cancer cells (MCF-7 and MDA-MB-231) and human ileocecal adenocarcinoma (HCT-8) growth. The new compound 1 significantly exhibits cytotoxic against the human lung cancer cell (H460).
Conflicts of interest
There are no conflicts to declare.
Acknowledgements
Financial support from the National Natural Science Foundation of China (NNSFC, 81302675), CAMS Innovation Fund for Medical Sciences (CIFMS, 2016-I2M-2-002, and 2018-I2M-3-005), the Drug Innovation Major Project of China (Grant No. 2018ZX09735001-002 and 2018ZX09711001-007), PUMC Youth Fund and the Fundamental Research Funds for the Central Universities (3332015133), Natural Science Foundation of Beijing Municipality (7144224), and Tianshan Cedar Project in Xinjiang Uygur Autonomous Region (2017XS10).
Notes and references
- S. E. Helaly, B. Thongbai and M. Stadler, Nat. Prod. Rep., 2018, 35, 992–1014 RSC.
- L. Chen, Q. Y. Zhang, M. Jia, Q. L. Ming, W. Yue, K. Rahman, L. P. Qin and T. Han, Crit. Rev. Microbiol., 2016, 42, 454–473 CAS.
- H. Nisa, A. N. Kamili, I. A. Nawchoo, S. Shafi, N. Shameem and S. A. Bandh, Microb. Pathog., 2015, 82, 50–59 CrossRef CAS PubMed.
- N. Fatima, S. A. Muhammad, I. Khan, M. A. Qazi, I. Shahzadi, A. Mumtaz, M. A. Hashmi, A. K. Khan and T. Ismail, Acta Physiol. Plant., 2016, 38, 136 CrossRef.
- S. Sekita, K. Yoshihira, S. Natori and H. Kuwano, Tetrahedron Lett., 1973, 14, 2109–2112 CrossRef.
- Q. Zhang, H. Q. Li, S. C. Zong, J. M. Gao and A. L. Zhang, Mini Rev. Med. Chem., 2012, 12, 127–148 CrossRef PubMed.
- C. S. Jiang and Y. W. Guo, Mini Rev. Med. Chem., 2011, 11, 728–745 CrossRef CAS PubMed.
- M. Chen, R. Wang, W. Zhao, L. Yu, C. Zhang, S. Chang, Y. Li, T. Zhang, J. Xing, M. Gan, F. Feng and S. Si, Org. Lett., 2019, 21, 1530–1533 CrossRef CAS PubMed.
- M.-H. Chen, S.-S. Chang, B. Dong, L.-Y. Yu, Y.-X. Wu, R.-Z. Wang, W. Jiang, Z.-P. Gao and S.-Y. Si, RSC Adv., 2018, 8, 5138–5144 RSC.
- M. Chen, Y. Wu, Y. He, Y. Xu, Y. Li, D. Li, T. Feng, L. Yu, B. Hong, W. Jiang and S. Si, Bioorg. Med. Chem. Lett., 2015, 25, 562–565 CrossRef CAS PubMed.
- G. Y. Li, B. G. Li, T. Yang, J. F. Yan, G. Y. Liu and G. L. Zhang, J. Nat. Prod., 2006, 69, 1374–1376 CrossRef CAS PubMed.
- N. Grimblat, M. M. Zanardi and A. M. Sarotti, J. Org. Chem., 2015, 80, 12526–12534 CrossRef CAS PubMed.
- Y. N. Wang, G. Y. Xia, L. Y. Wang, G. B. Ge, H. W. Zhang, J. F. Zhang, Y. Z. Wu and S. Lin, Org. Lett., 2018, 20, 7341–7344 CrossRef CAS PubMed.
- L. Li, D. Li, Y. Luan, Q. Gu and T. Zhu, J. Nat. Prod., 2012, 75, 920–927 CrossRef CAS PubMed.
- I. Marmouzi, M. El Abbes Faouzi, N. Saidi, Y. Cherrah, N. Rehberg, S. S. Ebada, W. Ebrahim, R. Kalscheuer and P. Proksch, Chem. Nat. Compd., 2017, 53, 1208–1211 CrossRef CAS.
- H. Fujimoto, M. Sumino, E. Okuyama and M. Ishibashi, J. Nat. Prod., 2004, 67, 98–102 CrossRef CAS PubMed.
Footnotes |
| † Electronic supplementary information (ESI) available: 1D, 2D NMR, HRESIMS and IR spectra for compounds 1, 3, and 6. See DOI: 10.1039/c9ra02647a |
| ‡ These authors have contributed equally to this work. |
|
| This journal is © The Royal Society of Chemistry 2019 |
Click here to see how this site uses Cookies. View our privacy policy here. 
 Open Access Article
 This Open Access Article is licensed under a Creative Commons Attribution-Non Commercial 3.0 Unported Licence
 *bc,
Yixuan Zhang
*bc,
Yixuan Zhang