 Open Access Article
Bimetallic phosphide decorated Mo–BiVO4 for significantly improved photoelectrochemical activity and stability†
Jie Qi‡
ab,
Dechao Kong‡ab,
Danyang Liuc,
Lun Pan *ab,
Ying Chenab,
Xiangwen Zhangab and
Ji-Jun Zou
 *ab
*ab
aKey Laboratory for Green Chemical Technology of the Ministry of Education, School of Chemical Engineering and Technology, Tianjin University, Tianjin 300072, China. E-mail: panlun76@tju.edu.cn; jj_zou@tju.edu.cn
bCollaborative Innovative Center of Chemical Science and Engineering (Tianjin), Tianjin 300072, China
cPeople's Public Security University of China, Beijing 100038, China
First published on 20th May 2019
Abstract
Bismuth vanadate photoanode has shown great potential for photoelectrochemical (PEC) catalysis, but it needs to be further modified because of its relatively low charge-separation efficiency and poor stability. Herein, the bimetallic phosphide NiCoP decorated Mo–BiVO4 is fabricated through the electrodeposition and drop-casting method, which significantly improves the charge separation and surface oxidation reaction. Therefore, the fabricated NiCoP/Mo–BiVO4 photoanode exhibits a low onset potential of 0.21 V (vs. RHE) and high photocurrent of 3.21 mA cm−2 at 1.23 V (vs. RHE), which is 3.12 times higher than that of pure BiVO4. Importantly, the decoration of NiCoP significantly improve the stability of BiVO4 photoanode.
1. Introduction
Photoelectrochemical (PEC) water splitting is considered as one of the most promising strategies to convert solar energy to hydrogen energy, and meet the increasing demand for clean and renewable fuel technologies.1,2 In the past few decades, great efforts have been made to improve the activity of photoanodes.3 Up to now, various photoanodes have been developed, such as TiO2, ZnO, Fe2O3, WO3, BiVO4, etc.4–8 In particular, BiVO4 has shown great potential for water oxidation due to its narrow band gap for visible-light absorption, appropriate valence band (VB) position for water oxidation, plentiful abundance, low cost and so on.9 However, limited by rapid recombination of photogenerated charges and relatively slow oxidation kinetics, the practical activity of BiVO4 for PEC water splitting is much lower than its theoretical photocurrent density of 7.6 mA cm−2 (under solar light illumination).10Doping transition metal ions have been proved to be an effective way to overcome the limitation of charge separation and migration.11,12 Especially, among various metal ions, Mo is reported to be the better one to enhance the PEC activity of BiVO4.13 Moreover, in order to accelerate the surface reaction kinetics, decorating adequate oxygen evolution cocatalysts on semiconductors is well accepted, which can effectively lower the activation energy of water oxidation reaction and further decrease the rate of charge recombination.14,15 Actually, many electrocatalysts have been loaded on photoanodes as cocatalysts, such as FeOOH/NiOOH, Co3O4 and Co-Pi.8,16–18 Recently, transition metal phosphides have been paid great attention to be used as promising cocatalysts, for their good performance for oxygen evolution reaction (OER) in electrochemical water splitting.19 It is worth noting that the bimetallic phosphide presents higher activity for OER than the corresponding monometal phosphides due to the presence of the synergistic effect.20,21 However, there are few researches about the decoration of bimetallic phosphides on doped BiVO4 for PEC catalysis.
In this work, we combined the effect of Mo doping and decoration of bimetallic phosphide cocatalyst to fabricate NiCoP/Mo–BiVO4 photoanode for PEC water oxidation. With 1.57% Mo doping and 2% NiCoP decoration, NiCoP/Mo–BiVO4 photoanode demonstrates very high PEC performance, with the low onset potential of 0.21 V vs. RHE, and the photocurrent density of 3.21 mA cm−2 at 1.23 V vs. RHE. It is worth noting that the decoration of NiCoP on Mo–BiVO4 photoanode significantly improves the PEC stability.
2. Experimental
2.1 Materials
Bi(NO3)3·H2O, Ni(NO3)2·6H2O, KI, p-benzoquinone, KOH, Na2SO4, NaH2PO2, and absolute ethanol were all obtained from Aladdin Chemicals. VO(acac)2, NiCl2 and CoCl2 were gained from J&K Scientific Ltd. Dimethyl sulfoxide (DMSO), HCl and HNO3 were purchased from Tianjin GuangFu Fine Chemical Research Institute. Deionized water (>18 MΩ cm) supplied by a UP Water Purification System was used in all experiments. Fluorine doped tin oxide substrates (FTO, 1.1 mm thick, 14 Ω per square) were purchased from WuHan Jinge-solar Energy Technology Co., Ltd. Before using, the FTO substrates were cleaned under sonication in acetone, ethanol, and deionized water.2.2 Sample preparation
A drop-casting technique was used to prepare the NiCoP/Mo–BiVO4 photoanode. Firstly, 20 mg of NiCoP nanoparticles were dispersed in 10 mL absolute ethanol and ultrasonicated for 2 h to form a uniform suspension, and 30 μL above suspension was drop-casted onto the Mo–BiVO4 samples to prepare NiCoP/Mo–BiVO4 photoanodes.
For NiCoP/Mo–BiVO4, the Mo doped amount is ca. 1.57%, and the NiCoP deposition amount is chosen as ca. 2%, because it shows the highest PEC performance in water splitting (Fig. S1, ESI†).
2.3 Characterization
The crystalline phases were characterized by X-ray diffractometer (D/MAX-2500) with Cu Kα radiation (λ = 1.5416 Å) at 40 kV and 140 mA at a scanning rate of 5° min−1. X-ray photoelectron spectrum (XPS) was conducted with a PHI-1600 X-ray photoelectron spectroscope equipped with Al K radiation. The morphology and microstructure of the samples were observed by field-emission scanning electron microscopy (SEM) (Hitachi S-4800). And transmission electron microscopy (TEM) and high-resolution TEM (HRTEM) images were obtained using a JEOL JEM-2100F microscope at 200 kV. The energy dispersive spectrometer (EDS-mapping) characterization was carried out with an EDX system attached to TEM. Raman spectra were recorded with a Raman spectrometer (DXR Microscope), and a green semiconductor laser (532 nm) was used as the excitation source. The optical properties of the products were analyzed with UV-vis diffuse reflectance spectra (UV-vis DRS) obtained from a Hitachi U-3010 spectrometer equipped with a 60 mm diameter integrating sphere using BaSO4 as reflectance sample. The amount of NiCoP was measured by Inductively coupled plasma (ICAP6300 Duo).2.4 Photoelectrochemical (PEC) measurements
PEC performances of the photoanodes were evaluated by CHI 660E electrochemical workstation using a typical three-electrode electrochemical cell with the as-prepared electrodes as working electrode, a Pt wire as counter electrode, and saturated Ag/AgCl as reference electrode. The illumination source was a 300 W xenon arc lamp (100 mW cm−2, PLS-SXE300UV, Beijing Trusttech. Co. Ltd) equipped with an AM 1.5G filter. The tests were performed in the electrolyte of 0.5 M Na2SO4 solution (pH = 6.8) with or without 1 M Na2SO3 as a hole scavenger. The scan rate of the linear sweep voltammetry (LSV) test was 10 mV s−1. All measurements were carried out with Ag/AgCl reference electrode, and the potential vs. Ag/AgCl reference electrode was converted to the potential vs. RHE according to the equation:| E (vs. RHE) = E (vs. Ag/AgCl) + 0.059pH + 0.197 | (1) |
The incident-photo-to-current efficiency (IPCE) tests were performed at a bias of 1.23 V vs. RHE as the wavelength from 350 nm to 600 nm. And the IPCE was calculated according to the following equation:
 | (2) |
The applied-bias power efficiency (ABPE) for PEC water splitting was evaluated using the following equation:
 | (3) |
Electrochemical impedance spectra (EIS) measurements were carried out with a sinusoidal ac perturbation of 10 mV applied over the frequency range of 1–105 Hz.
2.5 Photoelectrochemical H2 and O2 evolution measurements
Using Ar as a carrier gas, H2 and O2 gases evolved from the PEC cell were analyzed using a gas chromatograph (450-GC, molecular sieve 5 L column) equipped with a thermal conductivity detector (TCD). The light source and electrolyte were the same as those used for the above PEC measurements, and the gas products were sampled at each 20 min.3. Result and discussion
3.1 Crystal structure
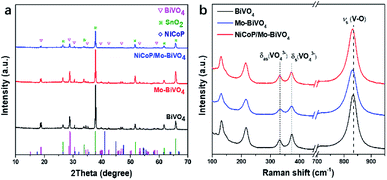
As shown in Fig. 1a (XRD patterns), BiVO4, Mo–BiVO4 (with 1.57% Mo doping) and NiCoP/Mo–BiVO4 (with 1.57% Mo doping and 2% NiCoP decoration) photoanodes all possess the typical diffraction peaks of monoclinic scheelite BiVO4 (JCPDS no. 14-0688)22 with high crystallinity, while the characteristic peaks of SnO2 (JCPDS no. 41-1445) are attributed to the FTO glass.8 No diffraction peaks of Mo species are detected for Mo–BiVO4, suggesting the absence of other Mo impurities.13 Meanwhile, there are no diffraction peaks of NiCoP observed for NiCoP/Mo–BiVO4, which should be owing to the small particle size and uniform dispersion of NiCoP on the surface of Mo–BiVO4.To further verify the crystal structure, the Raman spectra (Fig. 1b) was also measured. BiVO4 exhibits five main Raman peaks, respectively located at ca. 133, 216, 332, 374 and 834 cm−1, attributed to the active Raman scattering modes of monoclinic scheelite BiVO4.23,24 The peaks at 133 and 216 cm−1 correspond to the external modes of BiVO4, while the peaks at 332 and 374 cm−1 are attributed to the asymmetric and symmetric deformation modes of the VO43− tetrahedron (δas (VO3−) and δs (VO3−)), respectively.24 The peak at 834 cm−1 is related to the V–O stretching mode of pure BiVO4, and it shifts to lower frequencies (831 cm−1) for Mo–BiVO4 and NiCoP/Mo–BiVO4, which should be caused by the longer bond lengths of Mo–O bond (Mo6+, 0.41 Å) than V–O bond (V5+, 0.36 Å), proving Mo has been successfully doped into BiVO4.25
As shown in Fig. 2a, BiVO4 displays a porous crystal structure, with a film thickness of ca. 0.98 μm and the size of BiVO4 nanoparticles of 200–400 nm. From Fig. 2b, Mo doping has no influence on the morphology of BiVO4 and no Mo-related impurities can be observed, suggesting the effective Mo doping. However, the deposition of NiCoP on Mo–BiVO4 leads to a rough surface with many interconnected nanoparticles (NPs) decorated (Fig. 2c). According to TEM image (Fig. 2d and e), the NiCoP NPs, with the crystal size of 5–10 nm, uniformly disperse on Mo–BiVO4 surface. The lattice spacing distances of 0.26 nm and 0.230 nm are corresponding to the interplanar spacing of BiVO4 (020) plane and NiCoP (111) plane, respectively. The STEM elemental mapping images show that the elements of Bi, V, Mo, Ni, Co and P are uniformly dispersed in NiCoP/Mo–BiVO4 (Fig. 2f–k). All the above results suggest that Mo element has been doped in BiVO4 and the NiCoP NPs are uniformly decorated on Mo–BiVO4 surface.
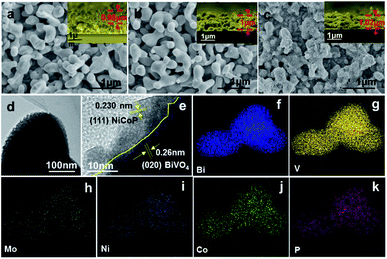 | ||
| Fig. 2 Top-view and cross-sectional-view (the inset figure) SEM images of pure BiVO4 (a), Mo–BiVO4 (b) and NiCoP/Mo–BiVO4 (c). TEM and STEM elemental mapping images of NiCoP/Mo–BiVO4 (d–k). | ||
3.2 Chemical states and optical absorption
The chemical composition and surface elemental states of as-prepared photoanodes were tested by X-ray photoelectron spectroscopy (XPS). In Fig. 3a, pure BiVO4 shows binding energies of Bi4f5/2 and Bi4f7/2 at ca. 164 eV and 159 eV, respectively, which are the characteristic peaks of Bi3+ species.12,18 The signals of V2p (Fig. 3b) are located at ca. 524 eV and 516.6 eV, corresponding to V2p1/2 and V2p3/2 respectively, referring to V5+ species.26 For Mo–BiVO4 and NiCoP/Mo–BiVO4, the peaks for Bi4f and V2p shift to higher binding energy compared to pure BiVO4, owing to the higher electronegativities of Mo6+ than V5+.13,27 Furthermore, Mo can be detected both in Mo–BiVO4 and NiCoP/Mo–BiVO4 samples (Fig. 3c), with two characteristic peaks located at ca. 232.1 eV and 235.4 eV, confirming the presence of Mo6+ species (substituting V atoms) in BiVO4.25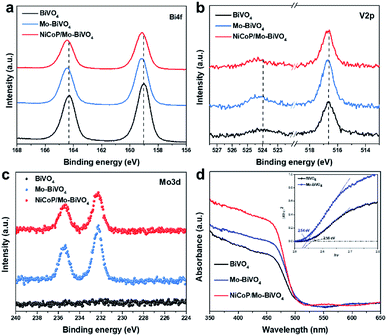 | ||
| Fig. 3 XPS spectra of Bi4f (a), V2p (b), Mo3d (c) and UV-vis DRS (d) for BiVO4, Mo–BiVO4 and NiCoP/Mo–BiVO4. | ||
Then, UV-visible diffuse reflectance spectra (DRS) were used to characterize the optical properties of the samples. In Fig. 3d, the absorption edge of BiVO4 appears at ca. 525 nm, consistent with its intrinsic band gap of 2.56 eV.8,28 After Mo doping in BiVO4, the absorption intensity of Mo–BiVO4 is slightly enhanced in visible-light region, and the band gap is slightly reduced to 2.54 eV.27 Moreover, NiCoP/Mo–BiVO4 shows an obvious increase in optical absorption intensity in the range below 525 nm, owing to the rough surface.29 Therefore, the Mo doping and NiCoP decoration strengthen the optical absorption of BiOV4 photoanode.
3.3 PEC performances
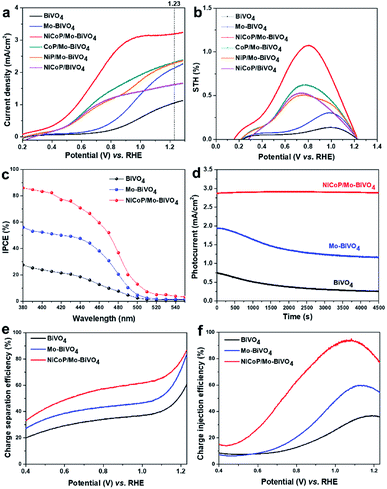
To identify the performances of BiVO4, Mo-doped BiVO4 and NiCoP/Mo–BiVO4 photoanodes, PEC water splitting was performed under simulated sun light illumination (100 mW cm−2). As shown in Fig. 4a, pure BiVO4 exhibits a photocurrent of 1.03 mA cm−2 at 1.23 V vs. RHE and an onset potential of 0.62 V vs. RHE. Upon Mo doping (1.57% Mo), Mo–BiVO4 has a higher photocurrent of 2.14 mA cm−2 (1.23 V vs. RHE) and a lower onset potential of 0.49 V (vs. RHE). Furthermore, after the decoration of NiCoP with the optimal amount of ca. 2% (Fig. S1, ESI†), NiCoP/Mo–BiVO4 shows the highest photocurrent density of 3.21 mA cm−2 at 1.23 V vs. RHE (almost 3.12 times higher than BiVO4) and lowest onset potential of 0.21 V vs. RHE. It is worth noting that, the NiCoP decoration exhibits much higher co-catalytic activity than the monometal phosphides (ca. 2%), CoP and NiP.Then, the applied bias photon-to-current conversion efficiency (ABPE) is calculated from the corresponding linear sweep voltammetry curve. Obviously, NiCoP/Mo–BiVO4 shows the highest ABPE of 1.08% at 0.80 V vs. RHE (Fig. 4b), which is about 8.31 times than BiVO4 photoanode (0.13% at 1.03 V) and 3.48 times higher than Mo–BiVO4 photoanode (0.31% at 0.99 V), corresponding to their PEC performances. Further for incident photon-to-electron conversion efficiency (IPCE, Fig. 4c), BiVO4 shows low IPCE of ca. 22% in the range of 380–450 nm, owing to the fast charge recombination, while the IPCEs of Mo–BiVO4 and NiCoP/Mo–BiVO4 are improved to 54% and >78%, respectively. The above results indicate the Mo doping and NiCoP deposition perform very high ability to significantly improve the PEC activity of BiVO4.
Furthermore, the PEC stabilities of the samples are tested at 1.1 V vs. RHE. As shown in Fig. 4d, BiVO4 shows very poor stability, with its photocurrent only maintaining 34.7% of the initial value after tested for 4500 s, which is caused by the dissolution of V5+ in electrolyte.9 As shown in Table S1 (ESI†), after Mo doping in BiVO4, the dissolved amounts of Bi and V in the used electrolyte after stability testing are slightly decreased compared with pure BiVO4, however, its stability is still poor. Specially, the decoration of NiCoP on Mo–BiVO4 greatly prevents the dissolution of V5+ in electrolyte and promotes the PEC stability, without obvious decrease of photocurrent for 4500 s, which should be attributed to its ability to rapidly capture and consume the photogenerated holes. In addition, after stability test (over 4500 s), NiCoP/Mo–BiVO4 shows the same X-ray diffraction peaks (XRD patterns in Fig. S3a, ESI†) and almost similar surface morphology of a rough porous crystal structure with many interconnected nanoparticles (SEM images in Fig. S3b, ESI†) with the samples before stability test, also confirming the high photostability of NiCoP/Mo–BiVO4 film.
In addition, to identify the effects of Mo doping and NiCoP decoration on the charge separation and transfer of BiVO4, the charge separation efficiency (ηsep) and charge injection efficiency (ηinj), are calculated by J–V curves measured without and with 0.1 M Na2SO3 as the hole scavenger in electrolyte.30 From the J–V curves for sulfite oxidation under light illumination (Fig. 4e, ESI†), the ηsep of BiVO4 is 59.5% at 1.23 V vs. RHE, which is much lower than those of Mo–BiVO4 (83.5% at 1.23 V vs. RHE) and NiCoP/Mo–BiVO4 (86%) photoanodes, clearly indicating the improvement of ηsep is mainly caused by Mo doping. The doped Mo enhances the charge separation and transfer, and further accelerates the photogenerated holes rapidly transferring to the interface of photoanodes/electrolyte.18,27 Moreover, the ηinj represents the yield of holes that are injected into the electrolyte to oxidize the water.31 As shown in Fig. 4f (Fig. S2, ESI†), the ηinj values of BiVO4 and Mo–BiVO4 are 36% and 55% at 1.23 V vs. RHE, respectively, while that of NiCoP/Mo–BiVO4 reaches as high as 78%, confirming that NiCoP can greatly enhance the surface charge oxidation kinetics to facilitate the process of surface water oxidation.
To further investigate the charge transportation and PEC water oxidation kinetics of the synthesized photoanodes, the electrochemical impedance spectroscopy (EIS) was measured at 0.9 V vs. RHE under light illumination (Fig. 5a). The arc radius of Nyquist plots reflects the charge-transfer behavior at the photoanode/electrolyte interface, and a smaller arc radius implies a lower charge-transfer resistance.32 Obviously, the arc radius of NiCoP/Mo–BiVO4 is the smallest among all photoanodes, suggesting the Mo doping and NiCoP decoration can lower the charge-transfer resistance and promote the charge transportation of BiVO4 photoanode. Actually, the main function of NiCoP decoration is the improvement of the PEC water oxidation kinetics of BiVO4, which further accelerate the hole-transfer process.14
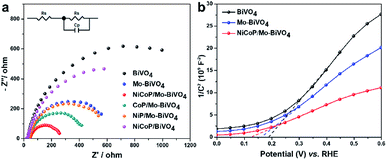 | ||
| Fig. 5 EIS of as-prepared samples (measured at 0.9 V vs. RHE under illumination) (a), the Mott–Schottky plots measured with a frequency of 100 Hz and amplitude of 10 mV (b). | ||
As shown in Mott–Schottky plots (Fig. 5b), all photoanodes are n-type semiconductors with the positive slope. But the Mo doping and NiCoP decoration cause the gradually slope decrease from BiVO4 to Mo–BiVO4, and NiCoP/Mo–BiVO4, indicating the increased density of charge carriers.33 When Mo6+ substitutes for V5+, it acts as an electron donor in the BiVO4 lattice. Besides, NiCoP, as an effective cocatalyst in PEC water splitting, can capture the photogenerated holes and change the distribution of semiconductor's charge carriers. The holes will transfer from the semiconductor surface to NiCoP nanoparticles, participating in the water oxidation reaction rather than accumulating on the surface of the semiconductors, which will accelerate the holes transfer rate and effectively suppress the recombination of photogenerated electrons and holes. In this way, the doping of Mo and the decoration of NiCoP can all increase the electron density of the photoanodes.
It is noteworthy that the more negative flatband potential leads to the easier generation of photoactive electron, making the whole PEC cell more efficient.34 From Fig. 5b, NiCoP/Mo–BiVO4 presents more negative flatband potential than Mo–BiVO4 and BiVO4, consistent with the trend of PEC performance. All the above results reveal that the synergistic influence of Mo doping and NiCoP decoration plays an important role to promote the PEC activity and stability of BiVO4 photoanode by increasing the charge carrier density and the surface oxidation kinetics.
3.4 Photoelectrochemical H2 and O2 evolution
As shown in Fig. 6, the practical volumes of H2 and O2 evolution are close to their theoretical value (at 1.1 V vs. RHE), and the practical volume of hydrogen is nearly twice of oxygen. Meanwhile, the faradaic efficiency of NiCoP/Mo–BiVO4 photoanode is calculated to be more than 95.4%, which can give the evidence that the photocurrent of NiCoP/Mo–BiVO4 photoanode is mainly caused by the water oxidation, excluding the contribution of the NiCoP oxidation.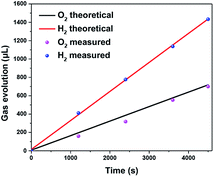 | ||
| Fig. 6 Gas evolution from the PEC water splitting under light irradiation at an applied bias of 1.1 V vs. RHE in 0.5 M Na2SO4 solution (pH = 6.8). | ||
4. Conclusions
In this work, the decoration of bimetallic phosphide NiCoP and Mo doping are adopted to realize the high activity and stability of BiVO4 for PEC water oxidation. With 1.57% Mo doping and 2% NiCoP decoration, NiCoP/Mo–BiVO4 photoanode demonstrates high PEC performance, with the low onset potential of 0.21 V vs. RHE, and the photocurrent density of 3.21 mA cm−2 at 1.23 V vs. RHE. Importantly, NiCoP/Mo–BiVO4 photoanode also exhibits excellent PEC stability, without crystal photocorrosion and PEC current decrease after tested at 1.1 V vs. RHE for 4500 s, owing to the rapid consumption of the photogenerated holes via NiCoP sites. This work provides the facile approach to fabricate highly active and stable photoanodes by doping and cocatalyst decoration for PEC water splitting.Conflicts of interest
There are no conflicts of interest to declare.Acknowledgements
The authors appreciate the supports from the National Natural Science Foundation of China (21676193, 21506156) and the Tianjin Municipal Natural Science Foundation (16JCQNJC05200, 15JCZDJC37300).Notes and references
- L. Pan, S. Wang, J. Xie, L. Wang, X. Zhang and J.-J. Zou, Nano Energy, 2016, 28, 296–303 CrossRef CAS
.
- S. Martha, P. C. Sahooa and K. M. Parida, RSC Adv., 2015, 5, 61535–61553 RSC
.
- Z. Li, W. Luo, M. Zhang, J. Feng and Z. Zou, Energy Environ. Sci., 2013, 6, 347–370 RSC
.
- A. Fujishima and K. Honda, Nature, 1972, 238, 37–38 CrossRef CAS PubMed
.
- X. Zhang, Y. Liu and Z. Kang, ACS Appl. Mater. Interfaces, 2014, 6, 4480–4489 CrossRef CAS PubMed
.
- P. Zhang, T. Wang, X. Chang and J. Gong, Acc. Chem. Res., 2016, 49, 911–921 CrossRef CAS PubMed
.
- Y. Cui, L. Pan, Y. Chen, N. Afzal, S. Ullah, D. Liu, L. Wang, X. Zhang and J.-J. Zou, RSC Adv., 2019, 9, 5492–5500 RSC
.
- T. W. Kim and K. S. Choi, Science, 2014, 343, 990–994 CrossRef CAS PubMed
.
- S. S. M. Bhat and H. W. Jang, ChemSusChem, 2017, 10, 3001–3018 CrossRef CAS PubMed
.
- C. Liu, J. Su, J. Zhou and L. Guo, ACS Sustainable Chem. Eng., 2016, 4, 4492–4497 CrossRef CAS
.
- B. Zhang, H. Zhang, Z. Wang, X. Zhang, X. Qin, Y. Dai, Y. Liu, P. Wang, Y. Li and B. Huang, Appl. Catal., B, 2017, 211, 258–265 CrossRef CAS
.
- L. Yang, Y. Xiong, W. Guo, J. Guo, D. Gao, Y. Zhang and P. Xiao, Electrochim. Acta, 2017, 256, 268–277 CrossRef CAS
.
- K. P. Parmar, H. J. Kang, A. Bist, P. Dua, J. S. Jang and J. S. Lee, ChemSusChem, 2012, 5, 1926–1934 CrossRef CAS PubMed
.
- X.-T. Xu, L. Pan, X. Zhang, L. Wang and J.-J. Zou, Adv. Sci., 2018, 1801505 Search PubMed
.
- C. Ding, J. Shi, Z. Wang and C. Li, ACS Catal., 2016, 7, 675–688 CrossRef
.
- D. K. Lee and K.-S. Choi, Nat. Energy, 2017, 3, 53–60 CrossRef
.
- P. Zhang, T. Wang, X.-X. Chang, L. Zhang and J.-L. Gong, Angew. Chem., Int. Ed., 2016, 55, 5851–5855 CrossRef CAS PubMed
.
- S. K. Pilli, T. E. Furtak, L. D. Brown, T. G. Deutsch, J. A. Turner and A. M. Herring, Energy Environ. Sci., 2011, 4, 5028–5034 RSC
.
- F. Yu, H. Zhou, Y. Huang, J. Sun, F. Qin, J. Bao, W. A. Goddard, S. Chen and Z. Ren, Nat. Commun., 2018, 9, 2551 CrossRef PubMed
.
- H. Liang, A. N. Gandi, D. H. Anjum, X. Wang, U. Schwingenschlogl and H. N. Alshareef, Nano Lett., 2016, 16, 7718–7725 CrossRef CAS PubMed
.
- Y. Li, H. Zhang, M. Jiang, Y. Kuang, X. Sun and X. Duan, Nano Res., 2016, 9, 2251–2259 CrossRef CAS
.
- J.-M. Wu, Y. Chen, L. Pan, P. Wang, Y. Cui, D. Kong, L. Wang, X. Zhang and J.-J. Zou, Appl. Catal., B, 2018, 221, 187–195 CrossRef CAS
.
- J. Yu and A. Kudo, Adv. Funct. Mater., 2006, 16, 2163–2169 CrossRef CAS
.
- H. Yoon, M. G. Mali, J. Y. Choi, M. W. Kim, S. K. Choi, H. Park, S. S. Al-Deyab, M. T. Swihart, A. L. Yarin and S. S. Yoon, Langmuir, 2015, 31, 3727–3737 CrossRef CAS PubMed
.
- H. Jung, S. Y. Chae, H. Kim, B. K. Min and Y. J. Hwang, Catal. Commun., 2016, 75, 18–22 CrossRef CAS
.
- L. Zhang, D. Chen and X. Jiao, J. Phys. Chem. B, 2006, 110, 2668–2673 CrossRef CAS PubMed
.
- Y. Shi, Y. Yu, Y. Yu, Y. Huang, B. Zhao and B. Zhang, ACS Energy Lett., 2018, 3, 1648–1654 CrossRef CAS
.
- Z. F. Huang, L. Pan, J. J. Zou, X. Zhang and L. Wang, Nanoscale, 2014, 6, 14044–14063 RSC
.
- L. Bi, X. Gao, L. Zhang, D. Wang, X. Zou and T. Xie, ChemSusChem, 2018, 11, 276–284 CrossRef CAS PubMed
.
- F. Yu, F. Li, T. Yao, J. Du, Y. Liang, Y. Wang, H. Han and L. Sun, ACS Catal., 2017, 7, 1868–1874 CrossRef CAS
.
- K. Dang, X. Chang, T. Wang and J. Gong, Nanoscale, 2017, 9, 16133–16137 RSC
.
- S. Wang, L. Pan, J. J. Song, W. Mi, J. J. Zou, L. Wang and X. Zhang, J. Am. Chem. Soc., 2105, 137, 2975–2983 CrossRef PubMed
.
- Y.-C. Wang, Y.-Y. Zhang, J. Tang, H.-Y. Wu, M. Xu, Z. Peng, X.-G. Gong and G.-F. Zheng, ACS Nano, 2013, 7, 9375–9383 CrossRef CAS PubMed
.
- Y. Park, K. J. McDonald and K. S. Choi, Chem. Soc. Rev., 2013, 42, 2321–2337 RSC
.
Footnotes |
| † Electronic supplementary information (ESI) available. See DOI: 10.1039/c9ra02105a |
| ‡ The authors contributed to this work equally. |
| This journal is © The Royal Society of Chemistry 2019 |

