
 Open Access Article
 This Open Access Article is licensed under a Creative Commons Attribution-Non Commercial 3.0 Unported Licence
Investigation on methane hydrate formation in silica gel particles below the freezing point
Jun Liuabcde and
Deqing Liang *abcd
*abcd
aGuangzhou Institute of Energy Conversion, Chinese Academy of Sciences, Guangzhou 510640, China
bCAS Key Laboratory of Gas Hydrate, Guangzhou 510640, China
cGuangdong Provincial Key Laboratory of New and Renewable Energy Research and Development, Guangzhou 510640, China
dGuangzhou Center for Gas Hydrate Research, Chinese Academy of Sciences, Guangzhou 510640, China
eUniversity of Chinese Academy of Sciences, Beijing 100049, China. E-mail: liangdq@ms.giec.ac.cn
First published on 14th May 2019
Abstract
Herein, methane hydrate formation in silica gel was studied in the temperature and pressure range of 253.1–268.1 K and 4.0–6.0 MPa, respectively. The stability of the hydrate and the morphology of methane hydrate formed in silica gel were analyzed by P-XRD and cryo-SEM technology. An NGt of 0.150 mol mol−1 and the conversion of water to hydrate completely were realized at 253.1 K and 6 MPa. But the fastest NR120 of 52.96 mol min−1 m−3 and shortest T90 of 160 min were achieved at 263.1 K and 6 MPa. The NGt of 0.136 and 90.93% water conversion to hydrate were realized at 263.1 K and 6 MPa. The temperature range of 263.1–268.1 K was the optimal temperature for methane hydrate formation and dissolution. From P-XRD patterns and cryo-SEM images, it was confirmed that most of the cubic ice was formed on the silica gel surface and it was metastable. All the silica gel spherical surfaces were covered with intermittent ice particles. Most of the methane hydrate was formed on the interconnection surface between silica gel particles rather than on the single silica gel spherical surface. The methane hydrate formed on the silica gel surface decomposed faster than pure water methane hydrate.
1. Introduction
Natural gas, compared to coal and oil, is the most effective fossil fuel for use as a fuel to generate power due to its cleanness. In recent years, legislative measures in many countries to reduce the emission of carbon dioxide from coal and oil have been recommended, which further accelerates the utilization of natural gas.1–4 In addition, the rapid growth of economy and population leads to an increase in energy demand to more than 71% from 2012 to 2040 in non-OECD (Organisation for Economic Co-operation and Development) nations, and to around 18% in OECD nations.5 In view of the actual oil consumption and the uncertainty of renewable sources, there is an urgent need to find alternative energy sources which are able to meet these harsh requirements in the next decades.6 Methane, regarded as a prospective fossil fuel, increases the specific combustion enthalpy and decreases the emission of carbon dioxide upon combustion compared to petroleum, and exists extensively in nature especially the natural gas hydrate.7 There are two major methods to transport natural gas – via high-pressure pipelines and liquefied natural gas (LNG) vessels.8 LNG is more economically feasible than pipeline transport for long-distance transport. The non-OECD nations like India, Singapore, South Korea, Japan etc. mainly import natural gas via LNG vessel. It is necessary for them to develop storage technologies for long-term storage. However, LNG is not a good idea for the storage of natural gas in the long term due to the climatic conditions in these nations.Another large-scale natural gas storage method that stores natural gas as the hydrate has recently been gaining significant attention.9 Takeya et al.10–14 have found that the methane hydrate could be preserved for one week at 248 K and 0.1 MPa because of the ice sheet formed around the methane hydrate particles. So the preservation time is longer than that of LNG at 248 K and 0.1 MPa. Natural gas hydrates have another name – “flammable ice”, which are ice-like crystalline compounds formed by water molecules and natural gas (mainly CH4) under high pressure and low temperature (e.g. 273.15 K and 2 MPa).2 The cage frameworks formed from water molecules by hydrogen bonds are filled with the CH4 molecules under intermolecular forces.11 Natural gas hydrate could become a potential natural gas storage and transportation method due to its high gas storage value (about 170 v/v0) at moderate storage conditions.12 In addition, using the hydrate to store and transport natural gas (NGH) is also superior to the other normal technologies, such as compressed natural gas (CNG) and liquefied natural gas (LNG). In general, they demand extremely high pressure and low temperature, respectively. Finally, an increasing number of works have concentrated on how to enhance the rate of natural gas hydrate formation, which is essential to practically make use of NGH.13,14 Mandal et al.15,16 studied the effect of anionic surfactant on methane hydrate formation. It was found that even though the anionic surfactant could improve the gas uptake, the maximum water conversion to hydrate was only 15.91% and the magnetic stirrer consumed a large amount of energy. The main restrictions of using hydrate to store and transport natural gas are (i) low rate of hydrate formation, (ii) low gas consumed due to the formation of the hydrate on the gas–liquid interface, and (iii) high energy consumption due to stirring. Recently, silica gel as one kind of porous medium has been utilized to enhance the methane hydrate formation rate and to reduce energy consumption, because its high specific pore volume could accommodate a large number of water molecules in the silica gel pore and its huge specific surface area could make water and natural gas have sufficient contact with each other.17–20
Silica gels with different pore and grain diameters have been studied due to their high porosity which can strengthen the kinetics of hydrate formation at the temperature above 273.1 K.21–24 Herein, the contact surface of gas and water molecules increased considerably when the unstirred vessel was used as the crystallizer loaded up with saturated silica gel.21,23,25 Kang et al.26 studied the kinetics of methane and carbon dioxide hydrate formation in silica gel pores. The fact that the rates of hydrate formation have a positive correlation with the driving force and little correlation with the pore dimension of the silica gel above 273.1 K has been found.27–29 Linga et al.30 studied the potential dependency of the kinetics of hydrate formation on the size of the silica sand bed. They concluded that the size of the silica sand bed should be taken into consideration for modeling the rate of hydrate formation in the silica sand bed. Bagherzadeh et al.31 investigated the dependency of methane hydrate formation on particle size and initial water saturation in an incompact silica sand bed by using the magnetic resonance imaging technique. They found that the methane hydrate formation in an incompact silica sand bed was heterogeneous, and the nucleation of the hydrate crystals inside the silica sand bed took place at different times and points. Also, the low water content or small particle size would lead to fast hydrate formation in the silica sand bed. Kumar et al.24 studied the potential dependency of the kinetics of CO2 gas hydrate formation on the particle sizes of silica gel and the types of surfactants. They found that the higher specific surface area of silica gel resulted in higher normalized rate of hydrate formation and water conversion to hydrate.24,32,33 They also concluded that higher water conversion resulted from better movement of guest molecules in the larger pores of silica gel. Kumar et al.34 also studied the potential dependency of the kinetics of methane gas hydrate formation on water saturation by using different proportions of clay and silica sand. They concluded that clay decreased the hydrate formation kinetics sharply. The higher water conversion resulted from the lower water content in a single porous medium and its double mixture. Mandal et al.35 also studied methane hydrate formation and dissociation in the presence of silica sand and bentonite clay. It was found that methane hydrate formation was delayed by the mixture and the induction time was more than 6 hour.
Recently, Liang et al.36 studied the effect of subcooling on the formation and separation of biogas hydrate at the temperature below ice point in silica gel. They found that the unstable ice contributed to the formation of biogas hydrate, and all the water converted to the hydrate. But the reason why the ice was unstable is unknown. The effect of unstable ice is attractive, because if the bulk ice or ice particles, just like ice in the silica gel, can convert to hydrate completely, the limitations of the hydrate-based technology may be overcome. The diameter of a large cage of sI hydrate was about 0.5 nm.1 The pore diameter of silica gel was 10 nm, which is a disadvantage for expending cage frameworks in all directions. The position of hydrate formation is unknown in the silica gel. The stability of the hydrate is also unknown in the silica gel. However, it is important for hydrate storage and transport of natural gas. The silica gel was found to increase the hydrate formation equilibrium pressure.37 Duc et al.38 had reported that the compressor cost occupied 50–80% of the hydrate-based CO2 capture in the industry. In order to reduce the operating pressure to medium pressure, the thermodynamic promoters (THF and TBAB) were added in the solution.22,39,40 Though the use of thermodynamic promoters could significantly reduce the energy arising from the compression of methane, it also sharply reduced the total amount of gas uptake.22,39,40 So we would reduce the temperature below ice point to reduce the energy arising from the compression of methane.
With these questions in mind, herein, to study the effect of unstable ice in silica gel on the kinetics of methane hydrate formation, firstly the pore of silica gel was filled with water and then analyzed by using cryo-SEM at 153 K and room temperature. Then it was analyzed by using P-XRD as the temperature went down from 273.1 to 223.1 K and went up to 273.1 K. After that, methane hydrate formation experiment was conducted at different constant temperatures, and the methane hydrate dissolution was carried out through warming the reactor to different temperatures, then methane hydrate formation was carried out through cooling the reactor to 253.1, 258.1 and 263.1 K, respectively. Finally, the methane hydrate dissolution was analyzed by utilizing P-XRD as the temperature went up from 223.1 to 271.1 K to analyze the stability of the methane hydrate. The methane hydrate was also analyzed by utilizing cryo-SEM at a temperature of 153 K to observe the morphology of methane hydrate formed.
2. Experimental investigation
2.1. Materials
The methane gas (99.99%) used in this study was purchased from Shiyuan Gases Co. Ltd. The silica gel particle used in this study was spherical. Its pore diameter was 10 nm and its particle distribution was 40–75 μm. It was supplied by Silicycle Co. (Canada). An elaborate description of the intrinsic properties of the spherical silica gel has been explained in our previous work.36 Ultrapure water made in our laboratory had a resistivity of 18 mΩ cm−1.2.2. Apparatus
An elaborate description of the apparatus used to perform the experiments in this study has been explained in our previous work.36 Briefly, the two main parts of the apparatus were a piston container and a reactor. The volumes of the piston container and reactor were 1165 ml and 505 ml, respectively. The two PT100 temperature sensors with an uncertainty of 0.1 K installed in the reactor were used to measure the gaseous phase and silica gel temperature. One CYB-20S pressure sensor with an uncertainty of 0.02 MPa was installed in the reactor. One temperature sensor and one pressure sensor were installed in the piston container. The pipeline used to connect the reactor and piston container had a tiny volume. All the data were collected 6 times per minute by connecting sensors to the Agilent data acquisition equipment.2.3. Procedures
Silica gel is regarded as a porous medium which not only has huge internal pore spaces but also interstitial pore spaces. It seriously affects the gas uptake calculation. The silica gel has a huge specific surface area, which might affect the water distribution and ice structure. All the problems should be solved before conducting methane hydrate formation.An elaborate description of X'pert Highscore Plus (PANalytical) diffractometer used in this study has been explained in our previous work.36 To explore the ice structure, the silica gel layer with a thickness of 0.3 mm was measured by utilizing P-XRD at temperatures of 223.1, 233.1, 243.1, 248.1, 253.1, 258.1, 263.1, 268.1, 271.1 and 273.1 K through temperature-fall and temperature-rise periods. To analyze the methane hydrate dissolution character, the methane hydrate was measured by utilizing P-XRD at temperatures of 223.1, 243.1, 248.1, 253.1, 258.1, 263.1, 268.1 and 271.1 K through temperature-rise period. All the observations were made over an interval of 6 min.
2.4. Methodology
The initial moles of methane gas in the reactor (n0) were determined by eqn (1):
| n0 = ncB − ncE | (1) |
 | (2) |
zcE, the gas compressibility factor, was calculated by the Pitzer correlations.41
 | (3) |
At time t, the normalized methane gas uptake (NGt) was determined by eqn (4):31,45–47
 | (4) |
 | (5) |
 | (6) |
 | (7) |
 | (8) |
Gas storage capacity with respect to water volume in the system was determined by eqn (9):52,53
 | (9) |
3. Results and discussion
3.1. The methane hydrate formation through a constant temperature period
Herein, the CH4 hydrate formation experiments were carried out in the temperature and pressure range of 253.1–268.1 K and 4.0–6.0 MPa, respectively. Water content in the silica gel pore was 100%, and the water contained was 3.02 mol. The methane gas uptake was 0.448 mol at 5 MPa and 253.1 K. The methane gas uptake was still 0.453 mol when the pressure went up from 5 to 6 MPa at 253.1 K. There was no more methane gas uptake when the pressure went further up or temperature went down, which is not displayed in this article. The maximum biogas uptake was 0.456 mol in our previous work.36 The hydration number was 6.68. So all the water converted to hydrate at 253.1 K and different original pressures of 6 and 5 MPa. Fig. 1 exhibits the entire P/T–t lines of methane hydrate formation under the two situations mentioned above. The stages of hydrate nucleation and hydrate growth could not be divided. The hydrate was formed immediately when the pressure was higher than equilibrium pressure and the induction time was less than 1 min. The gaseous-phase temperatures rose obviously when the pressurization procedure was completed and dropped rapidly to the desired experimental temperature. The temperature of the silica gel bed rose obviously as well when the pressurization procedure was over. However it declined quickly in the first 120 min and then slowly down to the desired experimental temperature in the following time due to the heat released during hydrate formation.49 The pressures declined quickly in the first 120 min and then slowly reached a plateau after the temperature curve of the silica gel bed became horizontal, as shown in Fig. 1. | ||
| Fig. 1 Entire P/T curves of methane hydrate formation at 253.1 K and different original pressures of 5 and 6 MPa. | ||
Fig. 2 exhibits the gas uptake curves during methane hydrate formation through constant temperature period. It can be seen from Fig. 2 that the gas uptake at 253.1 K and 5 MPa was equal to that at 253.1 K and 6 MPa. The water conversion to hydrate of 100% was achieved, because the normalized gas uptake approached the ultimate value of 0.174 mol mol−1 in Table 1 and in Fig. 3 at 6 MPa and 253.1 K.54 It can be seen from Fig. 3 that the gas storage capacity with respect to water of 186.12 (V/V0) also approached the ultimate value of 208 (V/V0).54 Water conversion was improved sharply when the temperature was below the ice point in the silica gel. However, the gas storage capacity with respect to silica gel of 67.50 (V/V0) was relatively low, so the volume of water in the silica gel should be increased to improve the gas storage capacity. It can be seen from Fig. 3 that the more normalized gas uptake, water conversion and gas storage capacity were obtained at lower temperature or higher pressure in advance as the gas uptake went up to the maximum ultimate value.
 | ||
| Fig. 2 The gas uptake curves during hydrate formation through constant temperature period. | ||
| Exp. no. | T (K) | P (MPa) | Subcooling (K) | Normalized rate of gas consumed, NR120b (mol min−1 m−3) | T90c (min) | End of experiment | Gas storage capacity | ||
|---|---|---|---|---|---|---|---|---|---|
| Normalized gas uptake, NGtd (mol mol−1) | Water conversion to hydratee (mol%) | GSSif (V/VSi) | GSH2Og (V/Vw) | ||||||
| a The amount of water used for all of the experiments was 54.4 ± 0.1 ml. Standard uncertainties u are u(T) = 0.1 K and u(P) = 4 kPa.b NR120 is the normalized rate of gas consumed for the first 120 min.c T90 is the time required to reach 90 mol% of final gas uptake.d NGt is the normalized methane gas uptake.e A hydration number of 6.6814 calculated by Exp. no. 12 was used for the calculation.f GSSi is the gas storage capacity with respect to silica gel volume.g GSH2O is the gas storage capacity with respect to water volume. | |||||||||
| 1 | 268.1 | 4 | 9.35 | 0 | — | 0 | 0 | 0 | 0 |
| 2 | 268.1 | 5 | 11.85 | 12.22 | 207 | 0.033 | 22.35 | 15.08 | 41.59 |
| 3 | 268.1 | 6 | 13.65 | 19.60 | 699 | 0.100 | 66.81 | 45.10 | 124.35 |
| 4 | 263.1 | 4 | 14.35 | 28.13 | 347 | 0.085 | 56.86 | 38.38 | 105.82 |
| 5 | 263.1 | 5 | 16.85 | 37.29 | 354 | 0.116 | 77.43 | 52.27 | 144.12 |
| 6 | 263.1 | 6 | 18.65 | 52.96 | 160 | 0.136 | 90.93 | 61.38 | 169.24 |
| 7 | 258.1 | 4 | 19.35 | 36.06 | 203 | 0.096 | 64.38 | 43.46 | 119.82 |
| 8 | 258.1 | 5 | 21.85 | 47.00 | 371 | 0.130 | 86.95 | 58.69 | 161.82 |
| 9 | 258.1 | 6 | 23.65 | 51.05 | 222 | 0.132 | 88.50 | 59.73 | 164.71 |
| 10 | 253.1 | 4 | 24.35 | 31.10 | 625 | 0.107 | 71.68 | 48.38 | 133.41 |
| 11 | 253.1 | 5 | 26.85 | 42.94 | 737 | 0.149 | 99.55 | 67.20 | 185.29 |
| 12 | 253.1 | 6 | 28.65 | 44.12 | 732 | 0.150 | 100.00 | 67.50 | 186.12 |
 | ||
| Fig. 3 The effect of temperature and pressure on water conversion, NGt, GSH2O and GSSi. | ||
However, the final gas uptake at 253.1 K was higher than that at 258.1 K. It was interesting to find from Fig. 2 and 4 that the rates of gas consumed in the first 120 min at 253.1 K were slower than that at 258.1 K at the same pressure. The fastest NR120 of 52.96 mol min−1 m−3 was found at 6 MPa and 263.1 K in Fig. 4. The following study found that the cubic ice at 258.1 K was more unstable than the one at 253.1 K. So it may be easier for the metastable cubic ice to transform into the hydrate as the temperature went up from 253.1 to 258.1 K. It can be seen from Fig. 3 that the faster NR120 was obtained at a higher pressure due to the higher driving force for hydrate formation.
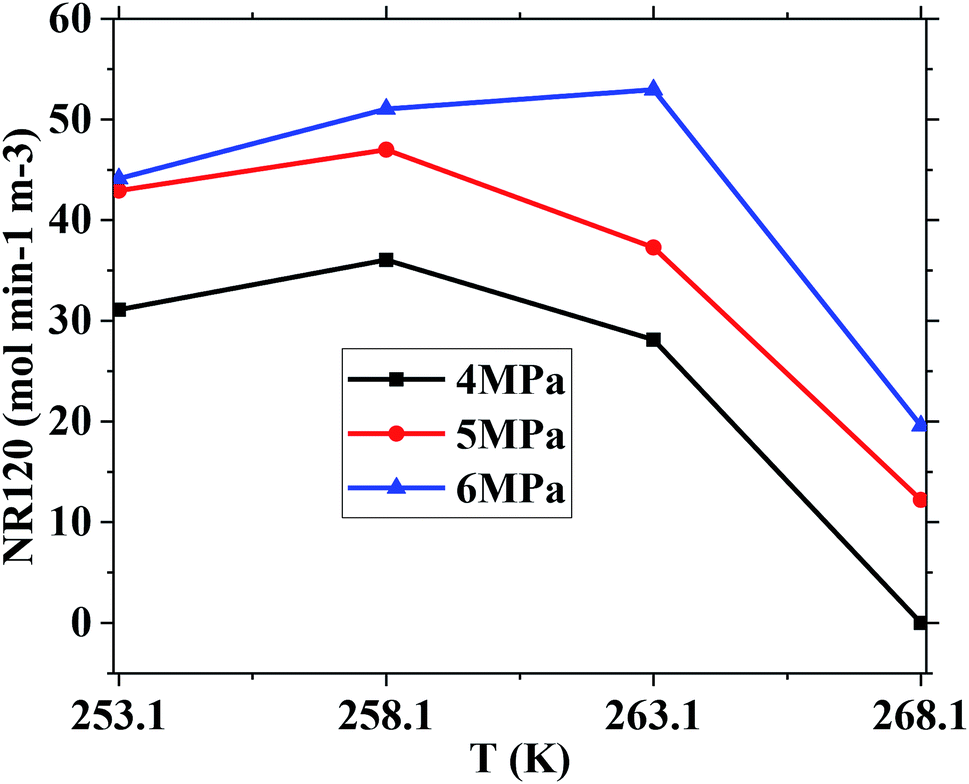 | ||
| Fig. 4 The effect of temperature and pressure on NR120. | ||
Another interesting thing is that the normalized gas consumption difference between the experiments conducted at 263.1 and 268.1 K was huge at the same pressure, as seen in Fig. 2 and 3. The normalized gas consumption difference was up to 0.085 mol mol−1. The fact that the NR120 difference between the experiments conducted at 263.1 and 268.1 K was also huge at the same pressure is found from Fig. 4. The NR120 difference was up to 33.36 mol min−1 m−3. There may be a prerequisite of low temperature for the quick formation of methane hydrate on the silica gel surface. To verify the existence of a prerequisite low temperature, the temperature-fall methane hydrate formation experiments were conducted at different initial pressures and different initial and terminative temperatures and then the hydrates were dissolved by raising the temperature.
Table 1 exhibits the influence of temperature and pressure on water conversion, normalized gas uptake, normalized rate of gas consumed and gas storage capacity. It can be found from Table 1 that the normalized rates of gas uptake for the first 120 min in Exp. no. 7, 8 and 9 were higher than those in Exp. no. 10, 11 and 12, respectively. The fastest NR120 of 52.96 mol min−1 m−3 and shortest T90 of 160 min defined as the time needed for the gas consumed to reach 90% of the total gas consumption were found in Exp. no. 6. It could explain why the gas consumption at 6 MPa and 263.1 K was slightly higher than that at 6 MPa and 258.1 K in Fig. 3. The faster rate of methane hydrate formation was found at higher temperature and constant pressure. The following study found that the cubic ice at 258.1 K was more unstable than that at 253.1 K. So it may be easier for the metastable cubic ice to transform into hydrate as the temperature went up from 253.1 to 258.1 K. It was noted that the rate of hydrate formation increased apparently and the finish time reduced apparently due to the sufficient gas–liquid contact surface formed without stirring.
The equilibrium temperature of the pure water methane hydrate was used to calculate the subcooling because the H–LW–V curves for methane hydrate were transferred to low temperature with almost equal temperature at fixed pressure in the silica gel and the equilibrium data was insufficient for the 10 nm silica gel saturated with pure water as the temperature went down to ice point in papers in Table 1.55–57 It is found from Table 1 that the lower subcooling resulted in higher normalized gas consumption when the temperature was higher, which was different from the normal rules. For example, even though the subcooling of 14.35 K in Exp. no. 4 was higher than that of 13.65 K in Exp. no. 3, the normalized gas uptake of 0.085 mol mol−1 in Exp. no. 4 was less than that of 0.100 mol mol−1 in Exp. no. 3. The same rule was discovered when comparing Exp. no. 6 and 9 to Exp. no. 7 and 10, respectively. The reason why the cubic ice became more unstable, which was in favour of hydrate formation as the temperature went up from 253.1 to 268.1 K, could explain the unusual result.
3.2. The temperature-fall methane hydrate formation and the temperature-rise hydrate dissolution
Fig. 5 exhibits the curves of gas uptake and gas dissolution relative to temperature during hydrate formation and dissolution, respectively. It can be seen from Fig. 5 that all the hydrate was formed quickly after the temperature fell down to 263.1 K. But it should also be noted that the hydrate hardly formed before the temperature fell down to 271.1 K. So there must be an optimal temperature depending on the initial pressure between 263.1 and 271.1 K for methane hydrate formation. The temperature range from 263.1 to 268.1 K was the optimal temperature for methane hydrate formation in consideration of gas consumption, which may also be caused by the unstable ice. It was also found from Fig. 5 that the temperature range from 263.1 to 268.1 K was the optimal temperature for methane hydrate dissolution.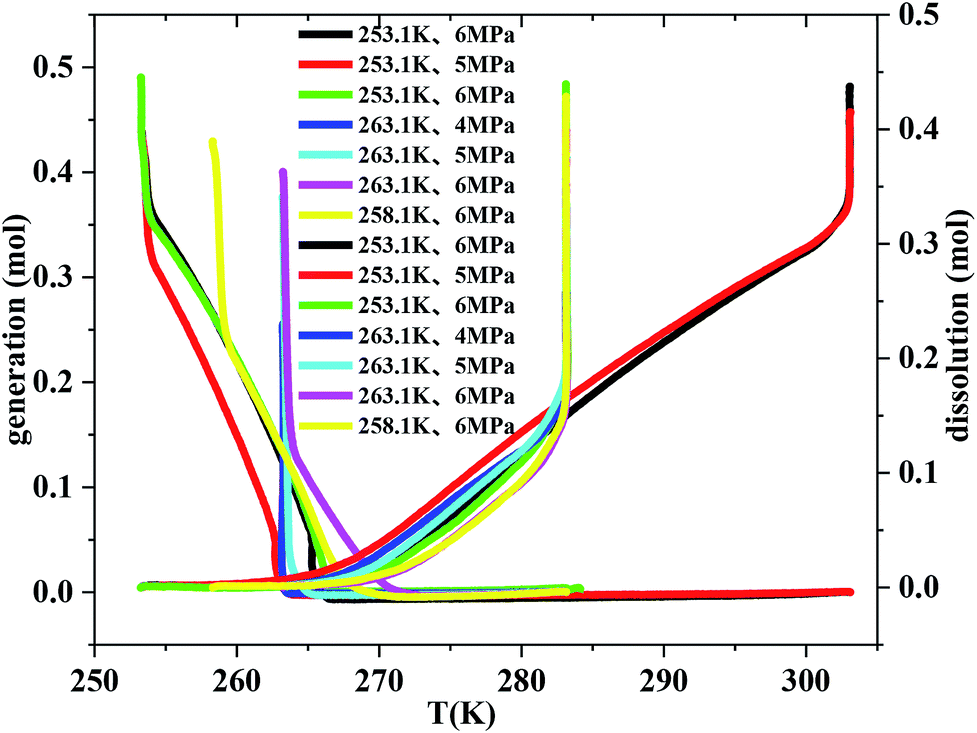 | ||
| Fig. 5 The curves of gas consumption and gas dissolution relative to temperature through temperature-fall and temperature-rise periods, respectively. | ||
3.3. Observing metastable ice and methane hydrate
The surfaces of the saturated silica gel and the hydrate formed in the silica gel were observed by using the SEM technique. Fig. 6A and B exhibit the pictures observed by SEM for the pore-saturated silica gel at ambient temperature and at 153 K, respectively. It can be seen from Fig. 6A that no free water was found on the silica gel spherical surface and there was nothing on the interconnection surface. It can be seen from Fig. 6B that the ice particles were not continuous on the silica gel spherical surface and there was nothing on the interconnection surface either. There's a possibility that the number of water molecules was too little to freeze bulk ice on the silica gel spherical surface. Perhaps, the ice particles were formed from the adjacent water. Finally there were many intermittent ice particles on the surface. | ||
| Fig. 6 The pictures observed by SEM for pore-saturated silica gel. | ||
In the experimental procedure, 69.9 ± 0.1 g of silica gel without water had the macroscopic volume of 150 ± 2 ml and interstitial volume of 64 ± 2 ml. A total of, 54.4 ± 0.1 ml of water spread homogeneously into 69.9 ± 0.1 g of silica gel. The silica gel particle diameter distribution was 40–75 μm. So 1 g silica gel had about 10.7 million spherical silica gel particles and the silica gel spherical surface was about 1214 cm2. Also, 1 g silica gel absorbed 0.78 ml water. The 0.78 ml of water was distributed homogeneously on the 1214 cm2 silica gel spherical surface. The surface area of 1 ml water was 4.836 cm2 when the water drop was spherical under the normal circumstances. The 0.78 ml of water could not distribute on the silica gel spherical surface of 1214 cm2 by itself. So the silica gel spherical surface might destroy the water drop interfacial tension. The distance of water molecules might be extended as the water diffuses on the silica gel spherical surface. The water film cannot be observed on the silica gel surface in the picture in Fig. 6A, because the state of water maybe near to gas phase. Meanwhile, it is found from Fig. 6B that all silica gel spherical surfaces were covered with intermittent ice particles. It was obviously different from the silica gel spherical surface at ambient temperature. There were so many intermittent ice particles on the surface, which may mean that there was not enough free water on the silica gel surface to freeze bulk ice, so adjacent water molecules gathered together to form ice crystals. It was estimated that the thickness of the water film will be about 6 μm if all water covered on the silica gel spherical surface. It is found from Fig. 6B that the diameter of an ice particle was about 4 μm. So most of the ice was on the silica gel spherical surface.
Fig. 7 exhibits the pictures observed by SEM for methane hydrate generated on the interconnection surface between silica gel particles at 153 K. The hydrate was formed at 5 MPa and 253.1 K. It can be seen from Fig. 7A that most of the silica gel spherical surface was the same as that in Fig. 6A, and there was a lot of solid in the space between the silica gel particles. It was obviously different from Fig. 6B after forming methane hydrate. Most of the hydrate was formed on the interconnection surface between silica gel particles rather than being spread evenly on the spherical surface, which may also prove that the number of water molecules was too little to form hydrate on the silica gel spherical surface. The number of water molecules on the interconnection surface between silica gel particles may be more than that on the single silica gel surface due to the water distributing homogeneously on the surface. So the interconnection surface between silica gel particles would be an easier place to form hydrate than the single silica gel surface. The rate of methane hydrate formation was slower than that of ice formation. So the methane hydrate firstly formed on the interconnection surface between silica gel particles. Then, most of the metastable ice transferred from the single silica gel surface to the interconnection surface between silica gel particles. Finally, only a little hydrate was formed on the single silica gel surface. It can be seen from Fig. 7B that the methane showed a typical honeycomb network morphology.
 | ||
| Fig. 7 The pictures observed by SEM for methane hydrate. | ||
The P-XRD facility was utilized to survey and analyze the metastable ice structures and hydrate dissolution characteristics below ice point. Fig. 8 presents the typical P-XRD patterns of a metastable ice crystal at 271.1, 268.1, 263.1, 258.1, 253.1, 248.1, 243.1, 238.1, 233.1, 228.1 and 223.1 K through temperature-fall and then temperature-rise periods. Typically, the reflections at about 22.7°, 24.2°, 25.9°,33.6°, 40.1° and 47.5° 2θ were assigned to the (100), (002), (101), (102), (110) and (112) crystal planes of hexagonal ice, respectively.58–60 We had to note that there was not only one ice structure of Ih formed on the silica gel surface but also ice of Ic. It is found from Fig. 8A that the intensity of the (002) crystal plane was several times higher than that of the (101) crystal plane, which was different from that of the pure hexagonal ice. The intensity of the (002) crystal plane of Ih was less than that of the (101) crystal plane.59,61 So the metastable cubic ice was also formed because the reflections at about 24.2°, 40.1° and 47.5° 2θ were also assigned to the (111), (220) and (311) crystal planes of cubic ice.58–60,62–64 The ratio of the height of the reflection peaks (Ic111) to the height of the reflection peaks (Ih101) was near to 1 when there was only hexagonal ice.9,13 Efimov et al.60 had calculated that the mass percent range of cubic ice was 50–90 wt% when the ratio range of the height of the reflection peaks (Ic111) to the height of the reflection peaks (Ih101) was 4–6 by using the POWDER CELL program. The ratio of the height of the reflection peaks (Ic111) to the height of the reflection peaks (Ih101) was about 9.3 in Fig. 8A, so it could be noted that most of the ice was cubic. The ratio of the height of the reflection peaks (Ic111) to the height of the reflection peaks (Ih101) changed obviously when the temperature changed. It meant that the mass ratio of cubic ice and hexagonal ice was temperature dependent.
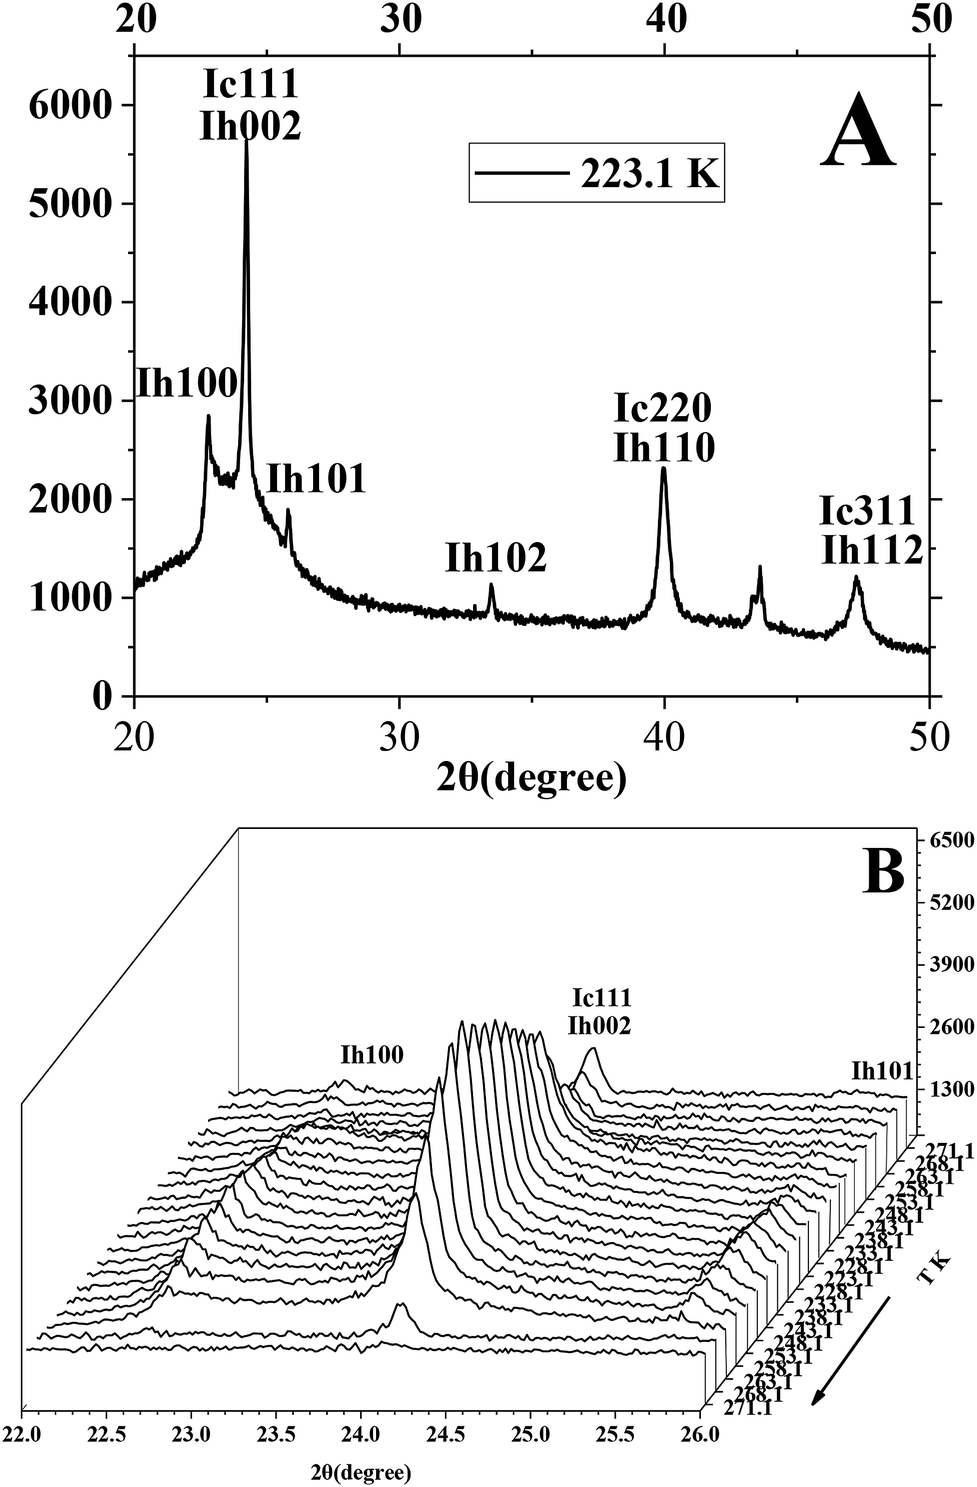 | ||
| Fig. 8 The typical P-XRD profiles of metastable ice formed in silica gel through temperature-rise and temperature-fall periods. | ||
It is found from Fig. 8B that the (002)/(111) crystal planes of ice were little and reduced gradually as the temperature went down from 271.1 to 258.1 K because the ice was unstable in the temperature range from 258.1 to 271.1 K. Then the reflection of (002)/(111) crystal planes set about strengthening as the temperature went down from 258.1 to 223.1 K and continued to strengthen as the temperature went up from 223.1 to 243.1 K. It meant that the generated ice was more stable at temperature below 253.1 K than at temperature above 258.1 K. Finally, the (002)/(111) crystal planes started reducing because ice became more unstable as the temperature went up from 248.1 to 271.1 K. It was known that the cubic ice was more unstable than hexagonal ice because the hydrogen atoms in each hydrogen bond were not topologically ordered.65,66 So the hydrogen bonding between water molecules may become more and more weakened as the temperature went up from 248.1 to 271.1 K. It is known that the crystalline patterns of Ih, Ic and hydrate are different from each other.58–60 So the hydrogen bonding of unstable cubic ice may be broken easily for generating the hydrogen bonding of methane hydrate as the ice is transformed into hydrate. So it may be easier for the metastable cubic ice to transform into hydrate as the temperature went up from 253.1 to 271.1 K.
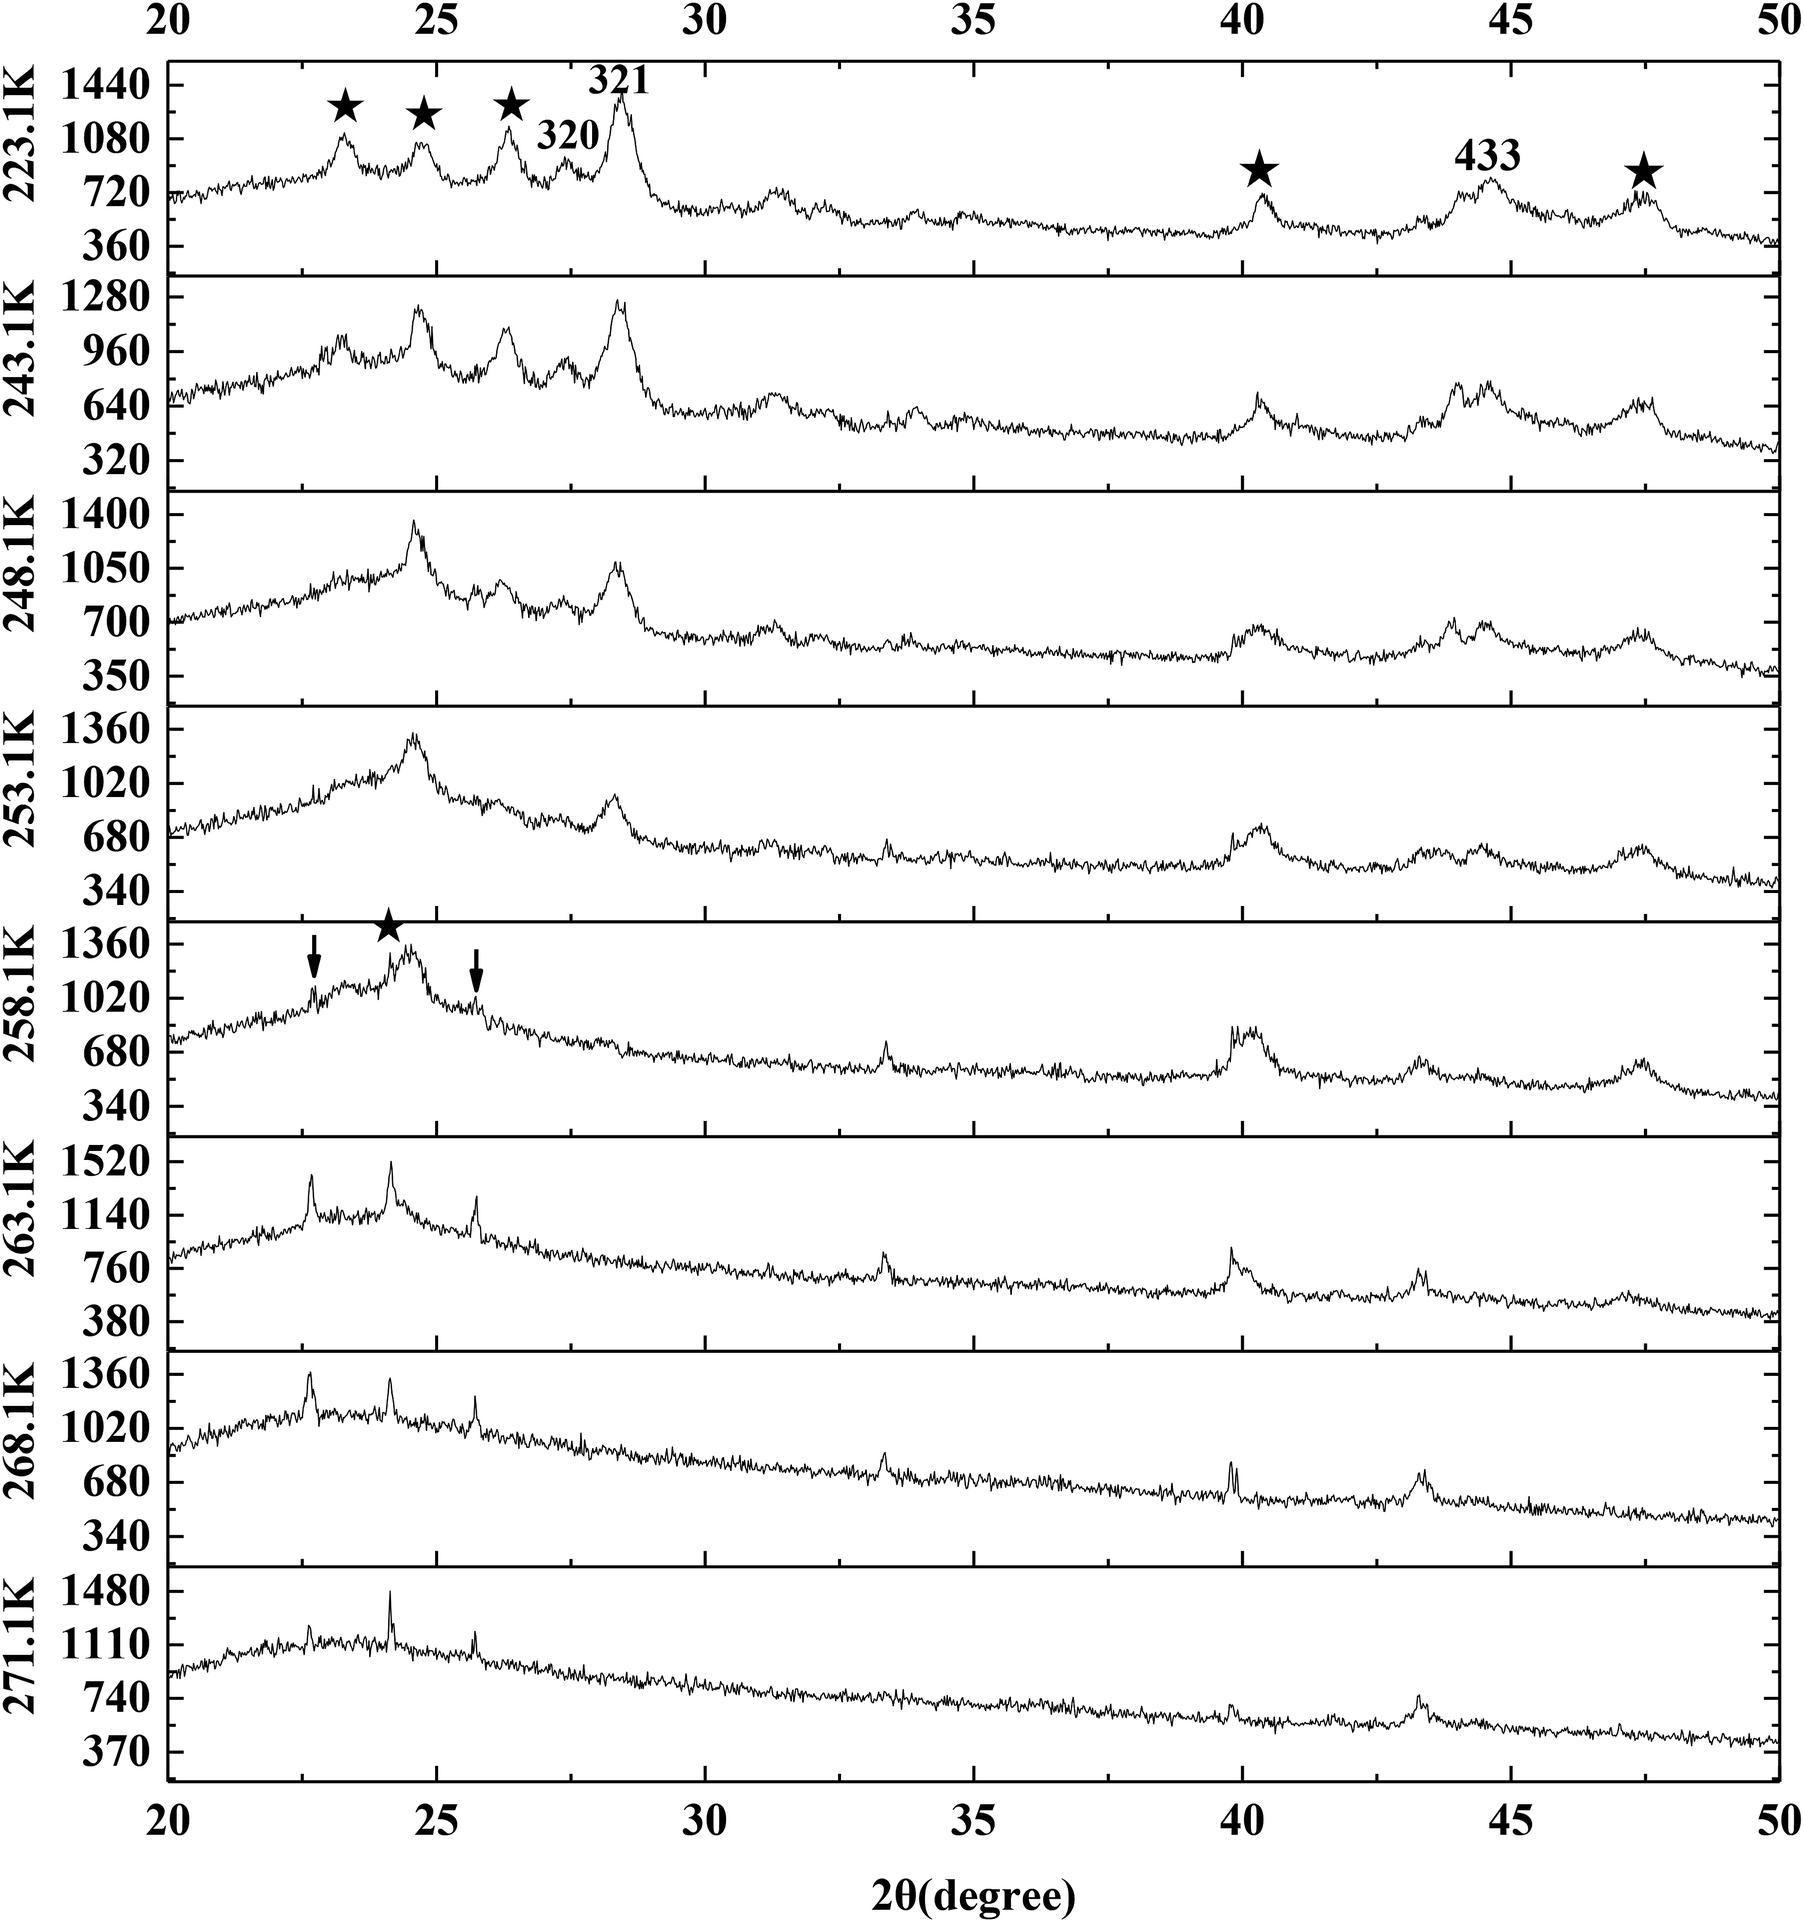
Fig. 9 exhibits the typical P-XRD patterns of methane hydrate at 223.1, 243.1, 248.1, 253.1, 258.1, 263.1, 268.1 and 271.1 K through temperature-rise period. The reflections at about 27.0°, 28.0° and 44.4° 2θ were assigned to the (320), (321) and (443) crystal planes of sI hydrate.9,13,67 So the silica gel did not change the structure of methane hydrate. It can be seen from Fig. 9 that the sI hydrate hardly dissolved as the temperature went up from 223.1 to 243.1 K. The (321) crystal plane set about reducing as the temperature went up from 243.1 to 253.1 K and disappeared at 258.1 K. It meant that the methane hydrate on the silica gel surface decomposed faster than pure water methane hydrate which decomposed slowly at 263.1 K.14,58,61,68,69 It should also be noted that the (002)/(111) crystals of ice did not strengthen when the methane hydrate began to dissolve in the temperature range from 243.1 to 258.1 K. So there was no ice sheet formed around the methane hydrate particles during the process of hydrate decomposition. The ice set about melting as the temperature went up from 258.1 to 271.1 K, which was similar to the result found in Fig. 8.
 | ||
| Fig. 9 The typical P-XRD profiles of hydrate formed on the silica gel surface through temperature-rise period. | ||
However, we had to note that there was a tiny difference between the angles of (002) and (111) crystal planes. It is found from Fig. 9 that the (002) crystal plane at 263.1 K was narrower than that at 258.1 K and also was at the low angle side. A non-cubic Bragg peak at 24.2° marked by an asterisk at 258.1 K was associated with the (002) reflection of ice Ih. This peak together with the skewness of cubic (111) reflection at its higher angle side and of the (220) reflection and (311) reflection at both sides were indications of deformation faults in the stacking sequence of the ice Ic. The phenomenon above was believed to be an intrinsic property of ice Ic.59,60,62–64 Kohl et al.63 also pointed out that amorphous ice was hardly detected, which resulted in the broad (111) reflection. But Kohl et al.63 found that the non-cubic Bragg peak at 23° was associated with the (100) reflection of ice Ih in the hexagonal-like stacking faults, which was different from our result. The (100) reflection and (101) reflection of ice Ih marked by arrows in Fig. 9 were also found at 258.1 K even though they were tiny. So this difference may be caused by the weak reflection.
In this section, cubic ice was firstly found in the silica gel and it became more unstable as the temperature went up from 253.1 to 271.1 K, which may make methane hydrate being formed easily. The methane hydrate in the silica gel was firstly found to be more unstable than pure water methane hydrate. It was found that there were many intermittent ice particles on the single silica gel surface and there was nothing on the interconnection surface and most of the methane hydrate was formed on the interconnection surface between silica gel particles. After comparing the specific surface area of free water drop to the silica gel spherical specific surface area, we derived that the number of water molecules on the single silica gel spherical surface was less than that on the interconnection surface between silica gel particles where the methane hydrate was preferentially formed.
4. Conclusions
In this work, methane hydrate formation experiments were carried out at the different constant temperatures of 253.1, 258.1, 263.1 and 268.1 K and the different initial pressure of 4.0, 5.0 and 6.0 MPa, respectively. And then the methane hydrate dissolution was carried out through warming the reactor to 283.1 or 303.1 K. After that methane hydrate formation was carried out through cooling the reactor to 253.1, 258.1 and 263.1 K, respectively. Water conversion to hydrate went up from 66.81 to 100 mol% when the temperature went down from 268.1 to 253.1 K at 6 MPa. The fastest NR120 of 52.96 mol min−1 m−3 and shortest T90 of 160 min were achieved at 6 MPa and 263.1 K and the water conversion was 90.93 mol%. But there was also a prerequisite low temperature range from 263.1 to 268.1 K for the quick and abundant formation of methane hydrate on the silica gel surface. The methane hydrate dissolved quickly while the temperature was between 263.1 and 268.1 K on the silica gel surface. So the temperature range from 263.1 to 268.1 K was the optimal temperature for methane hydrate formation and dissolution in the 10 nm silica gel. The gas storage capacity with respect to water of 186.12 (V/V0) also approached the ultimate value. It would be practical to use the hydrate-based technology to store and transport natural gas.The hexagonal and cubic ice was formed in the temperature range from 253.1 to 268.1 K on the silica gel surface. The hexagonal and cubic ice became more unstable as the temperature went up from 253.1 to 268.1 K. It may be easier for the metastable cubic ice to convert to methane hydrate, which was more unstable than the pure water methane hydrate. So the normalized rates of gas consumed for the first 120 min at 258.1 K were higher than those at 253.1 K at the same pressure. The normalized gas consumption was higher at higher temperature at the same or less subcooling due to the more unstable ice at higher temperature.
The entire silica gel spherical surface was covered with intermittent ice particles. There's a possibility that the number of water molecules was too little to freeze bulk ice on the silica gel spherical surface. Most of the hydrate was formed on the interconnection surface between silica gel particles rather than being spread evenly on the single silica gel spherical surface. The number of water molecules on the interconnection surface between silica gel particles may be more than that on the single silica gel surface. So the interconnection surface between silica gel particles was an easier spot to form hydrate than the single silica gel surface. The rate of methane hydrate formation was slower than that of ice formation. So the methane hydrate firstly formed on the interconnection surface between silica gel particles. Then most of the metastable ice transferred from the single silica gel surface to the interconnection surface between silica gel particles. Finally, only a little hydrate formed on the single silica gel surface. The methane hydrate on the silica gel surface decomposed faster than pure water methane hydrate.
Conflicts of interest
There are no conflicts to declare.Acknowledgements
This work was supported by the National Key Research and Development Plan of China (2017YFC0307306), National Natural Science Foundation of China (41603062).References
- E. D. Sloan, Nature, 2003, 426, 353–359 CrossRef CAS PubMed.
- E. D. Sloan and C. A. Koh, Clathrate Hydrates of Natural Gases, CRC Press, 2007 Search PubMed.
- A. Bahadori, Chapter 13 - Liquefied Natural Gas (LNG), Elsevier Inc., 2014 Search PubMed.
- Z. R. Chong, S. H. B. Yang, P. Babu, P. Linga and X.-S. Li, Appl. Energy, 2016, 162, 1633–1652 CrossRef.
- J. Conti, P. Holtberg, J. Diefenderfer, A. Larose, J. T. Turnure and L. Westfall, International Energy Outlook 2016 With Projections to 2040, 2016 Search PubMed.
- L. Zhan, Y. Wang and X.-S. Li, Fuel, 2018, 230, 37–44 CrossRef CAS.
- K. V. Kumar, K. Preuss, M.-M. Titirici and F. Rodriguez-Reinoso, Chem. Rev., 2017, 117, 1796–1825 CrossRef CAS PubMed.
- W. C. Ikealumba and H. Wu, Fuel, 2017, 197, 8–19 CrossRef CAS.
- S. Takeya, H. Fujihisa, Y. Gotoh, V. Istomin, E. Chuvilin, H. Sakagami and A. Hachikubo, J. Phys. Chem. C, 2013, 117, 7081–7085 CrossRef CAS.
- K.-Y. Kang, K.-H. Choi, J. Choi, Y. Ryu and J.-M. Lee, Ocean Eng., 2016, 113, 174–190 CrossRef.
- H. Mimachi, M. Takahashi, S. Takeya, Y. Gotoh, A. Yoneyama, K. Hyodo, T. Takeda and T. Murayama, Energy Fuels, 2015, 29, 4827–4834 CrossRef CAS.
- S. Takeya, A. Yoneyama, K. Ueda, K. Hyodo, T. Takeda, H. Mimachi, M. Takahashi, T. Iwasaki, K. Sano, H. Yamawaki and Y. Gotoh, J. Phys. Chem. C, 2011, 115, 16193–16199 CrossRef CAS.
- S.-H. Yeon, J. Seol, Y.-j. Seo, Y. Park, D.-Y. Koh, K.-P. Park, D.-G. Huh, J. Lee and H. Lee, J. Phys. Chem. B, 2009, 113, 1245–1248 CrossRef CAS PubMed.
- S. Takeya, H. Mimachi and T. Murayama, Appl. Energy, 2018, 230, 86–93 CrossRef CAS.
- E. Chaturvedi, K. Patidar, M. Srungavarapu, S. Laik and A. Mandal, Adv. Powder Technol., 2018, 29, 1025–1034 CrossRef CAS.
- E. Chaturvedi, N. Prasad and A. Mandal, J. Nat. Gas Sci. Eng., 2018, 56, 246–257 CrossRef CAS.
- L.-T. Chen, N. Li, C.-Y. Sun, G.-J. Chen, C. A. Koh and B.-J. Sun, Fuel, 2017, 197, 298–309 CrossRef CAS.
- J. Du, H. Li and L. Wang, Fuel, 2018, 230, 134–137 CrossRef CAS.
- B.-H. Shi, L. Yang, S.-S. Fan and X. Lou, Fuel, 2017, 194, 395–405 CrossRef CAS.
- W. Wang, K. Jiang, Y. Li, Z. Shi, G. Song and R. Duan, Fuel, 2017, 209, 85–95 CrossRef CAS.
- Y. T. Seo, I. L. Moudrakovski, J. A. Ripmeester, J. W. Lee and H. Lee, Environ. Sci. Technol., 2005, 39, 2315–2319 CrossRef CAS PubMed.
- A. Adeyemo, R. Kumar, P. Linga, J. Ripmeester and P. Englezos, Int. J. Greenhouse Gas Control, 2010, 4, 478–485 CrossRef CAS.
- Y. Seo and S. P. Kang, Chem. Eng. J., 2010, 161, 308–312 CrossRef CAS.
- A. Kumar, T. Sakpal, P. Linga and R. Kumar, Fuel, 2013, 105, 664–671 CrossRef CAS.
- S.-P. Kang and J.-W. Lee, Chem. Eng. Sci., 2010, 65, 1840–1845 CrossRef CAS.
- S. P. Kang, Y. Seo and W. Jang, Energy Fuels, 2009, 23, 3711–3715 CrossRef CAS.
- S. P. Kang and J. W. Lee, J. Phys. Chem. B, 2010, 114, 6973–6978 CrossRef CAS PubMed.
- S. P. Kang and J. W. Lee, Chem. Eng. Sci., 2010, 65, 1840–1845 CrossRef CAS.
- Y. Seo, S. Lee, I. Cha, J. D. Lee and S.-P. Kang, Abstracts of Papers of the American Chemical Society, 2010, 239 Search PubMed.
- P. Linga, C. Haligva, S. C. Nam, J. A. Ripmeester and P. Englezos, Energy Fuels, 2009, 23, 5496–5507 CrossRef CAS.
- S. A. Bagherzadeh, I. L. Moudrakovski, J. A. Ripmeester and P. Englezos, Energy Fuels, 2011, 25, 3083–3092 CrossRef CAS.
- P. Babu, R. Kumar and P. Linga, Energy, 2013, 50, 364–373 CrossRef CAS.
- A. Kumar, T. Sakpal, P. Linga and R. Kumar, Chem. Eng. Sci., 2015, 122, 78–85 CrossRef CAS.
- A. S. Kumar, J. Coralic, R. Vegeler, K. Kolli, J. Liang, A. Estep, A. P. Chudzinski and J. D. McFadden, Case Rep. Gastrointest Med., 2015, 2015, 206469 Search PubMed.
- V. K. Saw, G. Udayabhanu, A. Mandal and S. Laik, Oil Gas Sci. Technol., 2015, 70, 1087–1099 CrossRef CAS.
- J. Liu, J.-X. Ding and D.-Q. Liang, Energy, 2018, 157, 54–64 CrossRef CAS.
- M. Zarifi, J. Javanmardi, H. Hashemi, A. Eslamimanesh and A. H. Mohammadi, Fluid Phase Equilib., 2016, 423, 17–24 CrossRef CAS.
- N. H. Duc, F. Chauvy and J.-M. Herri, Energy Convers. Manage., 2007, 48, 1313–1322 CrossRef CAS.
- S. Park, S. Lee, Y. Lee, Y. Lee and Y. Seo, Int. J. Greenhouse Gas Control, 2013, 14, 193–199 CrossRef CAS.
- W. Lee, Y.-S. Kim and S.-P. Kang, Chem. Eng. J., 2018, 331, 1–7 CrossRef CAS.
- J. M. Smith, V. Ness and M. M. Abbott, J. Chem. Educ., 2000, 27, e62–e70 Search PubMed.
- S. Fan, X. Long, X. Lang, Y. Wang and J. Chen, Energy Fuels, 2016, 30, 8529–8534 CrossRef CAS.
- B. Castellani, E. Morini, E. Bonamente and F. Rossi, Biomass Bioenerg, 2017, 105, 364–372 CrossRef CAS.
- P. Di Profio, V. Canale, N. D'Alessandro, R. Germani, A. Di Crescenzo and A. Fontana, ACS Sustain. Chem. Eng., 2017, 5, 1990–1997 CrossRef CAS.
- C. Haligva, P. Linga, J. A. Ripmeester and P. Englezos, Energy Fuels, 2010, 24, 2947–2955 CrossRef CAS.
- D.-L. Zhong, N. Daraboina and P. Englezos, Energy Fuels, 2013, 27, 4581–4588 CrossRef CAS.
- D. Sun and P. Englezos, Int. J. Greenhouse Gas Control, 2014, 25, 1–8 CrossRef CAS.
- P. Babu, C. Y. Ho, R. Kumar and P. Linga, Energy, 2014, 70, 664–673 CrossRef CAS.
- A. Kumar and R. Kumar, Energy Fuels, 2015, 29, 4463–4471 CrossRef CAS.
- P. Linga, C. Haligva, S. C. Nam, J. A. Ripmeester and P. Englezos, Energy Fuels, 2009, 23, 5508–5516 CrossRef CAS.
- P. Linga, R. Kumar, J. D. Lee, J. Ripmeester and P. Englezos, Int. J. Greenhouse Gas Control, 2010, 4, 630–637 CrossRef CAS.
- P. Linga, N. Daraboina, J. A. Ripmeester and P. Englezos, Chem. Eng. Sci., 2012, 68, 617–623 CrossRef CAS.
- M. J. Cha, K. Shin, H. Lee, I. L. Moudrakovski, J. A. Ripmeester and Y. Seo, Environ. Sci. Technol., 2015, 49, 1964–1971 CrossRef CAS PubMed.
- E. D. Sloan and C. A. Koh, 2008.
- Y. Seo, H. Lee and T. Uchida, Langmuir, 2002, 18, 9164–9170 CrossRef CAS.
- Y. Seo and H. Lee, J. Phys. Chem. B, 2003, 107, 889–894 CrossRef CAS.
- Y. Seo, S. Lee, I. Cha, J. D. Lee and H. Lee, J. Phys. Chem. B, 2009, 113, 5487–5492 CrossRef CAS PubMed.
- S. Takeya and J. A. Ripmeester, Angew. Chem. Int. Ed., 2008, 47, 1276–1279 CrossRef CAS PubMed.
- B. J. Murray, D. A. Knopf and A. K. Bertram, Nature, 2005, 434, 202–205 CrossRef CAS PubMed.
- V. B. Efimov, A. N. Izotov, A. A. Levchenko, L. P. Mezhov-Deglin and S. S. Khasanov, JETP Lett., 2011, 94, 621–625 CrossRef CAS.
- X. B. Zhou, Z. Long, S. Liang, Y. He, L. Z. Yi, D. L. Li and D. Q. Liang, Energy Fuels, 2016, 30, 1279–1286 CAS.
- E. Mayer and A. Hallbrucker, Nature, 1987, 325, 601–602 CrossRef CAS.
- I. Kohl, E. Mayer and A. Hallbrucker, Phys. Chem. Chem. Phys., 2000, 2, 1579–1586 RSC.
- P. Jenniskens and D. F. Blake, Science, 1994, 265, 753–756 CrossRef CAS PubMed.
- T. Bartelsrausch, V. Bergeron, J. H. E. Cartwright, R. Escribano, J. L. Finney, H. Grothe, P. J. Gutiérrez, J. Haapala, W. F. Kuhs and J. B. C. Pettersson, Rev. Mod. Phys., 2012, 84, 885–944 CrossRef CAS.
- T. L. Malkin, B. J. Murray, C. G. Salzmann, V. Molinero, S. J. Pickering and T. F. Whale, Phys. Chem. Chem. Phys., 2015, 17, 60–76 RSC.
- X. Zhou, Z. Long, C. Tang and D. Liang, Energy Fuels, 2018, 32, 9683–9691 CrossRef CAS.
- C. Tang, X. Zhou, D. Li, X. Zhao and D. Liang, Fuel, 2018, 214, 505–511 CrossRef CAS.
- Z. X. Huo, M. D. Jager, K. T. Miller and E. D. Sloan, Chem. Eng. Sci., 2002, 57, 705–713 CrossRef CAS.
| This journal is © The Royal Society of Chemistry 2019 |