 Open Access Article
Hyper-branched structure—an active carrier for copolymer with surface activity, anti-polyelectrolyte effect and hydrophobic association in enhanced oil recovery†
Qi Wuac,
Shaohua Gou *ab,
Jinglun Huang*c,
Guijuan Fanc,
Shiwei Lia and
Mengyu Liua
aCollege of Chemistry and Chemical Engineering, Southwest Petroleum University, Chengdu 610500, P. R. China. E-mail: shaohuagou@swpu.edu.cn
bState Key Laboratory of Oil and Gas Reservoir Geology and Exploitation, Southwest Petroleum University, Chengdu 610500, P. R. China
cInstitute of Chemical Materials, China Academy of Engineering Physics, Mianyang 621900, China. E-mail: jinglunhuang@163.com
First published on 24th May 2019
Abstract
Herein, a hyper-branched polymer h-PMAD with, simultaneously, surface activity, an anti-polyelectrolyte effect and a hydrophobic association was prepared via aqueous solution free radical polymerization, and characterized by IR, NMR, TG–DTG and SEM. The polymer h-PMAD provided excellent comprehensive properties in terms of surface activity, thickening, water solubility, rheology and aging, which were compared with studies of HPAM and the homologous linear polymer PMAD. Specifically, the IFT value was 55.40 mN m−1, 789.24 mPa s apparent viscosity with a dissolution time of 72 min, 97.72, 90.77 and 105.81 mPa s with Na+, Ca2+ and Mg2+ of 20![[thin space (1/6-em)]](https://www.rsc.org/images/entities/char_2009.gif) 000, 2000 and 2000 mg L−1, respectively. Meanwhile, the non-Newtonian shear thinning behavior had a 96.33% viscosity retention while the shear rate went from 170 s−1 to 510 s−1 and then returned to 170 s−1 again and 0.12 Hz curve, with an intersection frequency of G′ and G′′. Also, it had 33.51% and 50.96% viscosity retention in formation and deionized water at 100 °C and a low viscosity loss in formation water at 80 °C over 4 weeks. Moreover, the h-PMAD had an EOR of 11.61%, was obviously higher than PMAD with 8.19% and HPAM with 5.88%. Most importantly, the better EOR of h-PMAD over that of PMAD testified that the hyper-branched structure provided an active carrier for copolymers with functionalized monomers to exert greater effects in displacement systems, which is of an extraordinary meaning.
000, 2000 and 2000 mg L−1, respectively. Meanwhile, the non-Newtonian shear thinning behavior had a 96.33% viscosity retention while the shear rate went from 170 s−1 to 510 s−1 and then returned to 170 s−1 again and 0.12 Hz curve, with an intersection frequency of G′ and G′′. Also, it had 33.51% and 50.96% viscosity retention in formation and deionized water at 100 °C and a low viscosity loss in formation water at 80 °C over 4 weeks. Moreover, the h-PMAD had an EOR of 11.61%, was obviously higher than PMAD with 8.19% and HPAM with 5.88%. Most importantly, the better EOR of h-PMAD over that of PMAD testified that the hyper-branched structure provided an active carrier for copolymers with functionalized monomers to exert greater effects in displacement systems, which is of an extraordinary meaning.
1. Introduction
As the challenge of residual oil displacement in tertiary recovery continues to escalate, polymer flooding plays an integral role in enhanced oil recovery.1,2 With the development of reservoirs tending to low permeability, high temperature and high salinity, the disadvantages of PAM and HPAM were magnified, although they had achieved remarkable results in enhancing oil displacement.3,4 For specific performances, (a) poor solubility didn't match the microscopic pore throat during the flooding process, which caused it to easily block the pores of the formation, reduce the permeability of oil and gas, damage the formation, and increase the difficulty of returning to the discharge;5,6 (b) the high salinity led to an increase in the power law index of the HPAM solution and a decrease of the consistency coefficient, and a bridge effect occurred between carboxylate ions and metal cations, and also phase separation and precipitation by flocculation destroyed the displacement and profile control performance;7–9 (c) a high temperature resulted in the conversion of amide into carboxylic acid groups, hydrolysis and thermal oxidative degradation, which caused the disruption of polymer backbones, and, moreover, shearing weakened the hydrogen bond and so increased the sensitivity to formation water, resulting in a significant drop in viscosity, which greatly affected the stability of its fluidity.10–12In response to above shortcomings in HPAM, many oilfield researchers carried out many works to find excellent performance alternatives for the new reservoir environment, including the introduction of functional groups and new molecular structures. On the one hand, hydrophobically associated acrylamide copolymers had gained extensive focus due to their unique rheological properties.13–15 Liu et al.16 reported a hydrophobically-associated poly(acrylic acid-co-acrylamide) gel prepared via micellar polymerization, which showed a superior mechanical stability and convincing phase transition behavior. Also, a star-shaped nano-silica core–shell twin-tailed hydrophobic association copolymer, SHPAM, with a strong core compatibility and fluidity control ability for polymer flooding in harsh environments, was synthesized by Pu et al.,17 enhancing the oil recovery to reach 20%. On the other hand, the zwitterionic polymers are also widely used in oilfield development due to their remarkable hydration ability, salt resistance, high mechanical stability and temperature responsiveness, thanks to their anti-polyelectrolyte effect.18–20 The presence of free ions shielded the mutual attraction between inner chains in molecules and enhanced the bonding of molecules to each other, so that with an increasing hydrodynamic volume, the molecular conformation became more stretched, resulting in an increase in viscosity instead of falling.21,22 Zuniga C. A. et al.23 obtained a novel system, I–prGO, on the partially reduced graphene oxide functionalized sulfonate-based zwitterionic polymer poly(vinylimidazole)-co-poly(aminostyrene), which could be used as a carrier for molecular delivery and as a protective inclusion of nanomaterials, and also for reservoir mapping and enhanced oil recovery. For example, the copolymer exhibited a highly stable dispersion after 140 days at 90 °C in high concentrations of Arab-D and API from deep reservoirs. Holtmyer M. D. et al.24 synthesized a ternary zwitterionic polymer AM-AMPS-MAPDMDHPAS as a fracturing fluid thickener by inverse emulsion polymerization with a better temperature resistance (>176.7 °C) and salt resistance (3000 mg L−1) than HPAM, suitable for operation in high temperature and high salinity acidified fracturing formations. In addition, the zwitterionic polymers also acted as a surfactant, which could reduce the interfacial tension and increase the sweep coefficient to improve the oil displacement efficiency.
For several years, dendritic highly branched macromolecules had shown a series of unique physical and chemical properties, such as excellent solubility, high rheology, low viscosity, and a large number of modifiable terminal functional groups that are not possessed by linear polymers due to their three-dimensional spherical and highly branched structures.25 Among these are the hyper-branched polymers that performed several unique application prospects in the fields of controllable macroscopic materials, sustained release drug carriers, information storage materials, high-efficiency catalysts, nonlinear optical materials, nanomaterials, water treatment, separation membranes, rheology modifiers, etc.26–29 Meanwhile, the application to research in oil fields has also gradually become active. Wever D. A. Z. et al.30 reported that the linear, star and comb polyacrylamides (PAMs) prepared via atom transfer radical polymerization (ATRP) in an aqueous medium at room temperature, investigated the effects of molecular structure on aqueous rheology, including viscosity and elasticity, paving the way for the application of these polymeric materials in enhanced oil recovery. Pu et al.31 synthesized amphiphilic hyper-branched polymers AMHPM that respond to shear, temperature, salt and pH by effectively controlling the hydrodynamic size of the terminal functional groups of monomers. More, novel star-like polymers (SLPs) with a four-gradient molecular weight, consisting of nano-silica as the core and a layer of hydrophilic chains as the shell, were made via mild water free-radical polymerization. The study showed that rigid nuclei with the three-dimensional microstructures of SLPs had ideal performances in thickening and long-term stability together, which were instructive for the use of hyper-branched polymers for oil recovery.32 Klemm B. J. et al.33 probed the suitability of a series of star-branched polyacrylamides (SB-PAMs) in EOR. The comparison demonstrated that the SB-PAMs presented a higher robustness under shear and a higher salt tolerance; contrary to HPAM, the salinity did not influence the solution viscosity of the SB-PAMs. Moreover, they were approximately 3–5 times better than their linear analogues with similar molecular weights at EOR tests and showed more resilience under harsh reservoir conditions, which made them attractive for EOR applications.
Based on the above research, it can be concluded that the introduction of special groups, such as hydrophobic groups and ionic groups, and the construction of special molecular structures, such as core shells and branch in polymer molecules, are both effective ways to improve the performance of HPAM, which achieved significant results. However, the problem was generally that the molecules which introduced excellent groups had normal structures, and the intra-molecular functional groups of the good structures were monotonous. Obviously, it is undoubtedly a good choice to combine the advantages of the two parts with the same polymer molecule so as to further improve the overall performance, but the related research was relatively rare.
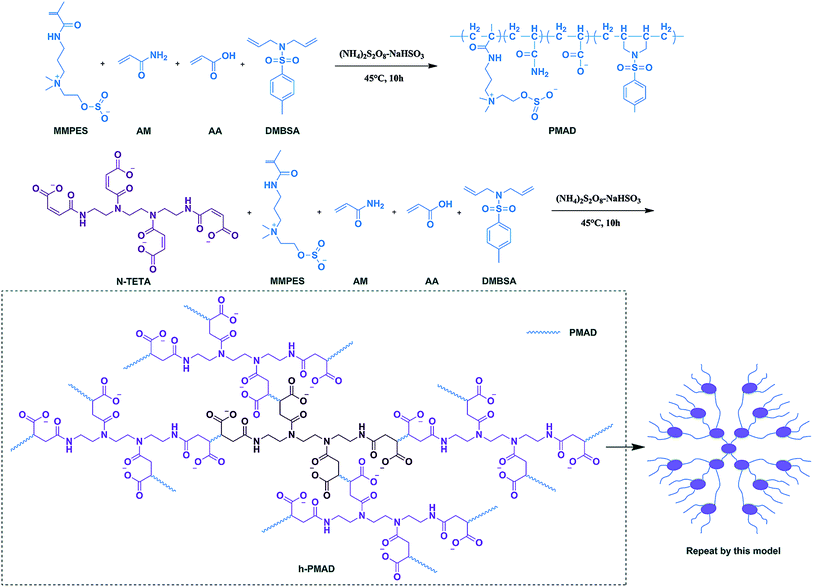
In our previous works, we prepared a hydrophobically associating polyacrylamide based on oleic imidazoline and sulfonate,34 an anti-biodegradable hydrophobic sulfonate-based acrylamide copolymer containing 2,4-dichlorophenoxy,35 an ɑ-aminophosphonic acid-modified acrylamide-based hydrophobic-associating copolymer36 and complexes of hydrophobically modified polymer and surface active imidazolium-based ionic liquids,37 which all showed gratifying results in enhanced oil recovery, providing strong evidence for the excellent properties of hydrophobic associations and ionic polymers. Based on these results, we made a new attempt to prepare a comb-shaped polyzwitterion with surface-activity via a N-maleoyl chitosan modified HPAM, the surface tension decreased with the increase of polymer solution concentration within a certain range, this discovery had a great positive meaning on overcoming the chromatographic separation effect and reducing the oil–water interfacial tension to improve oil recovery, also introduced comb-shaped model in copolymer structure.38 Combining with these works, in this paper we selected a special structure of maleated triethylenetetramine (N-TETA) with a hydrophobic monomer (DMBSA), zwitterionic monomer (MMPES), AM and AA, prepared a hyper-branched structural copolymer that exhibited surface activity, an anti-polyelectrolyte effect and hydrophobic association simultaneously via aqueous solution free radical polymerization. The polymer structure was characterized by IR and NMR, thermal analysis by TG–DTG, and microscopic appearance by SEM. More, surface activity, thickening ability, water solubility, aging and rheological properties, including shear, salt and temperature resistance and viscoelasticity, were compared with HPAM and corresponding linear copolymers. Finally, the mobility control ability and EOR were studied via a core flooding experiment to discuss whether it had potential application in displacement systems.
2. Experimental
2.1 Material
Acrylamide (AM), acrylic acid (AA), p-toluenesulfonyl chloride (PTSC), polyoxyethylene octylphenol ether (OP-10), N,N-diallylamine (DAP), triethylenetetramine, hydroquinone, triethylamine (Et3N), ammonium persulfate ((NH4)2S2O8), sodium bisulfite (NaHSO3), dimethyl sulfoxide, dichloromethane, 1,4-dioxane, acetone, hydrochloric acid, anhydrous sodium sulfate, sodium chloride, sodium hydroxide, absolute ethanol and acetonitrile (AR for all the above chemical reagents, from Chengdu Kelong Chemical Reagent Factory, Sichuan, China). HPAM (Mw = 1.5 × 10⁷, Daqing Refining and Chemical Company). N-(3-Dimethylaminopropyl) methacrylamide (DAPMAA), and 3-(methacryloyloxy) propyltrimethoxysilane (MPS) (CR for these chemical reagents, from Chengdu Huaxia Chemical Reagent Factory, Sichuan, China). Methylethylene sulfite (MES), monomers MMPES and DMBSA were prepared according to the literature38–40 (for details for MMPES and DMBSA see ESI†).2.2 Synthesis of monomer N-maleoyl triethylenetetramine (N-TETA)
Into a 100 mL flask, triethylenetetramine (50 mmol, 7.5 mL) was dissolved in DMSO (30 mL) at room temperature with stirring until it became homogeneous. Then, a mixture of maleic anhydride (220 mmol, 21.57 g) and DMSO was dribbled into the flask, and upon addition the temperature of the system was up to 60 °C. After stirring for 5 h, the precipitant was collected from a large amount of acetone and washed three times, dried under vacuum at 45 °C, to give the final product, a light brown yellow fluffy solid N-TETA (90% yield) (scheme in Fig. S3†). 1H NMR (400 MHz, D2O): δ 7.25 (s, 2H, –C(O)–NH–), 6.81 (m, 4H, –CH![[double bond, length as m-dash]](https://www.rsc.org/images/entities/char_e001.gif) CH–COO−), 6.63 (dd, 4H, –CH
CH–COO−), 6.63 (dd, 4H, –CH![[double bond, length as m-dash]](https://www.rsc.org/images/entities/char_e001.gif) CH–COO−), 3.49 (t, 4H, –NH–CH2–CH2–), 3.20 (t, 8H, –C(O)–N(CH2)–CH2–).
CH–COO−), 3.49 (t, 4H, –NH–CH2–CH2–), 3.20 (t, 8H, –C(O)–N(CH2)–CH2–).
2.3 Synthesis of copolymer N-TETA/MMPES/AM/AA/DMBSA (h-PMAD)
Into a 100 mL three necked flask, the appropriate amount of N-TETA, MMPES, DMBSA, OP-10 and MPS were well mixed with 20 mL of DI water, and then the AM and AA were added in sequence. After stirring for 20 min, sodium hydroxide solution was used to adjust the pH of the system. Next, the reactor was kept in a water bath at a certain temperature under nitrogen atmosphere for 15 min, then the NaHSO3–(NH4)2S2O8 (1/1 mol ratio) initiator was added and dispersed rapidly, and the reaction was kept at a certain condition for 10 h. Finally, the copolymer gel was precipitated with ethanol and dried in a 45 °C vacuum, retrieving the powdered sample of h-PMAD (Scheme 1). The synthetic methods and optimum synthesis conditions of polymer MMPES/AM/AA/DMBSA (PMAD) are displayed in ESI.†2.4 Characterization
2.5 Thickening ability and water solubility
The thickening ability was evaluated through the influence of polymer concentration on the apparent viscosity at 30 °C. The water solubility was defined as the change in the conductivity of the polymer solution (2000 mg L−1, white granular (20–35 mesh)/deionized water) obtained using a DDS-307 conductivity meter (Shanghai Rex Xinjiang Instrument Co., Ltd, China) at different dissolution times at 30 ± 0.1 °C.2.6 Surface activity
Surface activity was confirmed via a function of polymer concentration (in the simulated formation water) and interfacial tension (IFT) by a drop shape analyzer (DSA30, KRÜSS GmbH Co., Hamburg, Germany) at 30 ± 0.1 °C.2.7 Salt resistance
Salt resistance was studied via adding several small molecule electrolytes (such as NaCl: 0–20![[thin space (1/6-em)]](https://www.rsc.org/images/entities/char_2009.gif) 000 mg L−1, MgCl2·6H2O and CaCl2: 0–2000 mg L−1) to polymer solutions (2000 mg L−1) to characterize the apparent viscosities at 7.34 s−1 and 30 °C.
000 mg L−1, MgCl2·6H2O and CaCl2: 0–2000 mg L−1) to polymer solutions (2000 mg L−1) to characterize the apparent viscosities at 7.34 s−1 and 30 °C.
2.8 Rheological experiments
The polymer (0.2 wt%) rheological behavior was conducted by a HAAKE MARS III rheometer (HAAKE, Germany) at an appropriate temperature.
 | (1) |
 | (2) |
2.9 Core flooding experiment
The core flooding experiment aims to study the fluidity control ability of the prepared polymer and its improvement for oil recovery capacity. The core assembly was a stainless-steel cylinder packed with sand (80–100 mesh), the sand was washed with 30% hydrochloric acid to remove impurities and DI water was used to wash until the pH was 7, and then dried under a vacuum environment. The simulation crude oil was collected from Shengli Oil Field (China) and the apparent viscosity was 61.5 mPa s at 70 °C. The simulated formation water was injected at 2.5 mL min−1 into the sand filling model until the pressure was stable to determine its porosity with Darcy's law, and then the crude oil was injected into the core assembly and aged for 36 h at 70 °C. Core flooding experiments were performed with the following steps.First, the simulated formation water was injected at 0.4 mL min−1 until the out liquid water ratio exceeded 98%, and then changed to polymer solutions with the same velocity (0.4 mL min−1). Finally, the water ratio (>98%) from the second flooding was driven by subsequent water flooding at 0.4 mL min−1. EOR was calculated with eqn (3).
 | (3) |
The fluidity control ability was formulated by the resistance factor (RF) and residual resistance factor (RRF) through eqn (4) and (5), respectively.42
 | (4) |
 | (5) |
3. Results and discussion
3.1 Optimum conditions
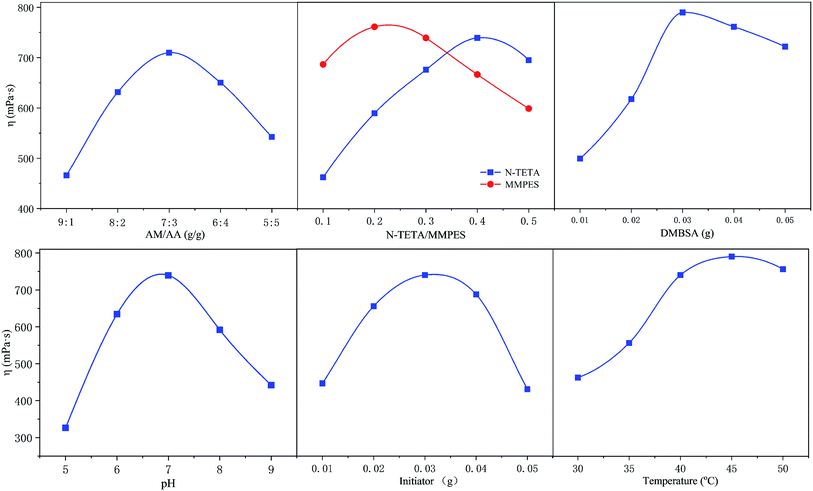
The polymer h-PMAD were prepared via a redox free radical polymerization initiated by (NH4)2S2O8–NaHSO3; the optimum synthesis conditions were a single factor control variable method and the results are displayed in Fig. 1 and Table 1 (for details see Tables S2 and S3†). It can be seen from Fig. 1 that changes in different factors can cause obvious changes in viscosity, the combination of the horizontal factor values corresponding to each peak was the optimal synthesis condition.| Feed ratio (g) | pH | Initiator (g) | Tem. (°C) | ||||
|---|---|---|---|---|---|---|---|
| AM | AA | N-TETA | MMPES | DMBSA | |||
| 7 | 3 | 0.4 | 0.2 | 0.03 | 7 | 0.03 | 45 |
For monomers, it was generally believed that a smaller monomer concentration resulted in a lower molecular weight of the polymer, and an increase in concentration led to an increase in the probability of contact and collision between the monomers, which contributed to the growth of the molecular chain and an increase in the molecular weight. However, when the monomer concentration was increased to a certain extent, the heat released by the polymerization could not be easily removed, resulting in an excessive temperature rise and an accelerated decomposition rate of the initiator; the increase in the number of active sites in the system reduced the molecular weight of the synthetic polymer.43,44 In addition, the pH of the medium not only affected the reaction kinetics but the structure and properties of the polymer, such as the polymerization rate, solubility, molecular weight and sequence structure of the monomer, resulting in different apparent viscosities. For example, when the system was strongly alkaline, the polymer began to hydrolyze, which accelerated as the pH increased.45 Also, the amount of initiator determined the amount of free radicals in the polymerization system; low concentrations corresponded to a low initiation efficiency, and the monomer conversion rate improved with an increase in the amount added. However, when the concentration was overly high, too many radicals appeared, and the excessively rapid reaction caused a rapid increase in the viscosity, resulting in a gel effect, which forced a widening of the molecular weight distribution and the reduction of apparent viscosity.46,47 Finally, according to the reaction kinetics, the relationship between the decomposition rate constant of the initiator and the temperature can be expressed by the Arrhenius formula,48 and the decomposition rate increased with a rise in temperature, so the effect of temperature on the molecular weight and viscosity of the copolymer was similar to that of the initiator.
3.2 IR and 1H NMR
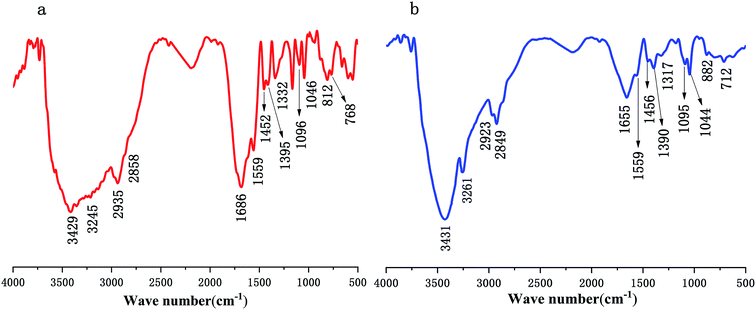
The IR spectra of polymer PMAD and h-PMAD are shown in Fig. 2 and offer significant evidence on the chemical functional groups in materials. For h-PMAD, the characteristic peak at 3431 cm−1 was due to –OH in R–COOH, the peaks at 3261, 1559, and 1655 cm−1 were attributed to the N–H and C![[double bond, length as m-dash]](https://www.rsc.org/images/entities/char_e001.gif) O bonds, respectively, in the –CONH– group. The C–H bonds of R–CH3 and –CH2– can be observed at 2923, 2849, 1456 and 1390 cm−1. The peaks at 1317 cm−1 correspond to C–O of the –COO– group. Moreover, the characteristic peaks at 1095 and 1044 cm−1 were confirmed as the stretching vibration of S
O bonds, respectively, in the –CONH– group. The C–H bonds of R–CH3 and –CH2– can be observed at 2923, 2849, 1456 and 1390 cm−1. The peaks at 1317 cm−1 correspond to C–O of the –COO– group. Moreover, the characteristic peaks at 1095 and 1044 cm−1 were confirmed as the stretching vibration of S![[double bond, length as m-dash]](https://www.rsc.org/images/entities/char_e001.gif) O in the R–OSO2– group, the peak at 712 cm−1 was due to C–S in the Ar–SO2– bond, and the absorption peak at 882 cm−1 was attributed to bending vibration of C–H in the benzene ring structure. For PMAD, all the characteristic absorption peaks were similar to those of h-PMAD.
O in the R–OSO2– group, the peak at 712 cm−1 was due to C–S in the Ar–SO2– bond, and the absorption peak at 882 cm−1 was attributed to bending vibration of C–H in the benzene ring structure. For PMAD, all the characteristic absorption peaks were similar to those of h-PMAD.
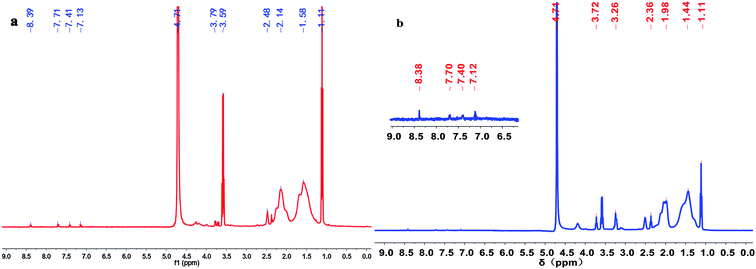
Fig. 3 illustrates the 1H NMR spectra of polymers PMAD and h-PMAD. For PMAD, the characteristic peaks at 1.11 and 3.59 ppm correspond to absolute ethanol from the polymer purification, the chemical shift values at 8.39 and 7.13 ppm were assigned to the proton peaks of the –C(O)–NH– and –C(O)–NH2 groups, respectively. The proton peaks of aromatic Ar–H appeared at 7.71 and 7.41 ppm, and the proton peak of –CH2–OSO2– bond was observed at 3.79 ppm. Peaks at 2.48, 2.14 and 1.58 ppm were due to the –CH3, –CH2– and –CH– groups, respectively. For h-PMAD, all the proton peaks were similar to those of PMAD except the chemical shift value at 3.26 ppm, which was attributed to the –NH– group from N-TETA. According to the IR and 1H NMR spectra, it can be judged that the structure of polymers PMAD and h-PMAD were in line with expectations.
3.3 TG–DTG analysis
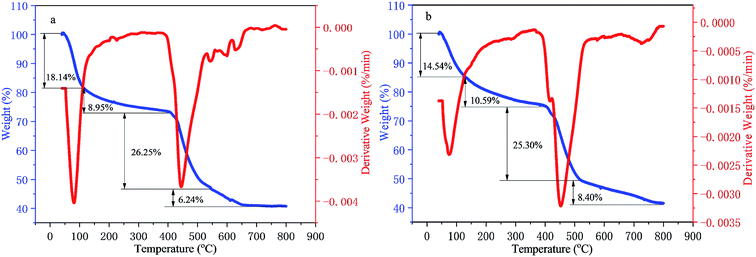
The TG–DTG analysis of the two kinds of polymers is displayed in Fig. 4(a) and (b). There were four stages for the weight losses of polymers PMAD and h-PMAD with similar processes, attributed to the dehydration between intra-molecular & inter-molecular and the decomposition of the amide groups, the fracture of carbon–nitrogen bonds, the decomposition of the carbon–oxygen & carbon–hydrogen bonds and the carbonization of the copolymers, respectively. Also, polymers PMAD and h-PMAD kept a good thermal stability until around 400 °C and had a higher mass retention rate of more than 40% at 800 °C compared with HPAM.49 Interestingly, though the final mass retention rate was similar, the hyper-branched polymer h-PMAD behaved with a much slower dehydration rate between intra-molecular and inter-molecular than that of the linear polymer PMAD, which confirmed that the hyper-branched structure had a greater contribution to the thermal stability of the polymer molecules at a lower temperature, providing more possibilities for practical applications.3.4 Microcosmic configuration analysis by SEM
The microcosmic appearances of HPAM (a), PMAD (b) and h-PMAD (c) were studied via SEM, shown in Fig. 5. From Fig. 5(a), the micrograph of HPAM exhibited a loose network structure with larger pores. In contrast, the molecular chains of linear polymer PMAD (Fig. 5(b)) were more compact and showed ordered connections, mainly due to the hydrophobic monomer DMBSA in the polymer providing the association of molecular chains, forming more hydrophobic domains. Meanwhile, the zwitterions MMPES increased the electrostatic interaction between the molecular chains, the hydrophobic association and electrostatic interaction were much stronger than hydrogen bonding, leading to the existence of obvious advantages.38 More importantly, from Fig. 5(c), the polymer h-PMAD had a dense and hierarchical three-dimensional network structure while retaining the advantages of PMAD, the hyper-branched structure optimized the spatial arrangement of the linear molecular chains and had a better effect in enhancing the repulsion between carboxylate ions.50 This comparison of the microcosmic appearances demonstrates that polymer h-PMAD plays a potential role in rheological properties and displacement characteristics.3.5 Thickening ability and water solubility
To investigate the relationship between the apparent viscosity and concentration, the apparent viscosity as a function of concentration in deionized water was determined for the polymers HPAM, PMAD and h-PMAD as displayed in Fig. 6(a) and (b). In general, the viscosity of these polymers increased with increasing concentrations but with significant differences; polymers PMAD and h-PMAD demonstrated a much superior thickening efficiency. As is shown in Fig. 6(b), when the concentration of polymer solution is lower than the critical association concentration (CAC), the growth rate of viscosity in HPAM was slightly higher than that in PMAD and h-PMAD, with a linear viscosity–concentration relationship. According to the literature,35 under CAC the association of hydrophobic groups mainly occurs intra-molecularly, and the contribution to viscosity is far less than the electrostatic repulsion of carboxylate ions from HPAM. However, when the concentrations exceeded CAC, the viscosities of the PMAD and h-PMAD were much higher than that of HPAM, exhibiting a power-law exponential growth. Intuitively, the better thickening ability of PMAD over that of HPAM is due to the stronger electrostatic interaction from MMPES and intermolecular hydrophobic association from DMBSA. More importantly, the hyper-branched structure enhanced the interaction between the polymer chains and exhibited a larger hydrodynamic volume, which led to an increase in viscosity,32 so the polymer h-PMAD showed the highest thickening efficiency.Objectively, a hyper-branched structure and the presence of hydrophobic groups could affect the solubility of the polymer, and poor solubility may lead to a bad performance in EOR.51 Fig. 6(c) shows the relationships between the conductivity and dissolution time; as we all know, higher conductivity values with the same dissolution time and a shorter steady time means a better solubility of the polymers. Obviously, polymers PMAD and h-PMAD exhibited more solubility at higher conductivity values all the time and a shorter steady time of 80 min and 72 min, respectively, compared to HPAM (90 min), which is due to the presence of the carboxylate ion, and the quaternary ammonium and glycol sulfite from MMPES made the molecules more soluble.35 This theory only confirms why h-PMAD ha a shorter steady time than PMAD, originating from its large number of carboxylate ions.
3.6 Surface activity
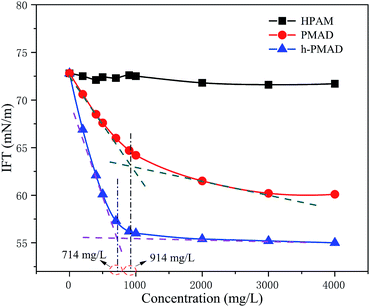
The surface activity of the polymer HPAM, PMAD and h-PMAD solutions (2000 mg L−1) were investigated, as illustrated in Fig. 7. It was found that the interfacial tensions of PMAD and h-PMAD were drastically reduced with an increase in concentration about 1000 mg L−1, and then tended to be steady at different steady states, and with different critical micelle concentrations (CMC) of 914 mg L−1 and 714 mg L−1, respectively. Obviously, the polymer h-PMAD solution showed the highest surface activity, the IFT reached a steady state at about 55.4 mN m−1, while HPAM remained around 71.8 mN m−1. It turned out that the polymers PMAD and h-PMAD all have the ability to reduce the interfacial tension, which provides a great positive effect on overcoming the effects of color-induced segregation, reducing the oil–water interfacial tension and thereby enhancing oil recovery. The good performance comes from the monomer MMPES, both anions and cations in the molecule all outside surface active, but there were marked differences in the polymers compared to the monomers; the polymer was slightly more surface active at low concentrations, and much higher than the monomer at the higher concentrations needed to obtain a substantial decrease of the surface tension. The surface tension decreased continuously in a nearly linear dependence on log[concentration], and thereby the higher molecular weight was beneficial for surface activity, consistent with the literature.52 Moreover, hydrophobic association in the polymer solutions formed molecular micelles that caused an increase in the interaction between the molecular chains and the reduction of the interfacial tension.533.7 Salt resistance
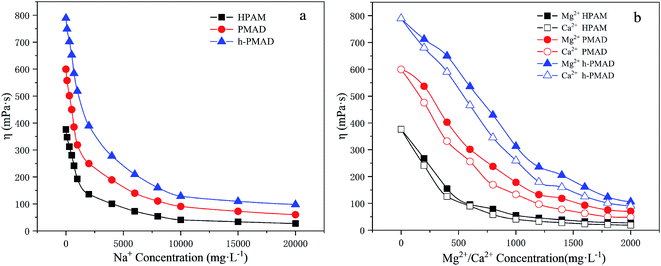
The influence of salt on the three kinds of polymer solutions (2000 mg L−1) were measured at different salt concentrations, and the trend of the apparent viscosity to salt concentrations is shown in Fig. 8. In Fig. 8(a) and (b), the apparent viscosities of all the copolymer solutions decreased with an increase of salt concentrations. In the first stage, a sharp drop in apparent viscosity occurred; with an increasing salt concentration, slight decreases in the solutions' apparent viscosity were observed. Especially, the apparent viscosities of the PMAD and h-PMAD solutions were always significantly higher than that of HPAM, which was due to the effects of the anti-polyelectrolyte from the zwitterionic monomer MMPES. According to the literature,15 in a zwitterionic polymer aqueous solution, the molecular chain is curled because of the mutual attraction of anionic and cationic groups. But in the salt-containing solution, the metal ions Na+, Ca2+ and Mg2+ weaken or shield the mutual attraction between the anion and cationic groups, the molecular chain shows a more stretched state, and so the viscosity of the polymer in the brine drops a little or even increases. As for h-PMAD, the hyper-branched structure improved the spatial density of the zwitterionic monomers, which strengthened the above-mentioned interaction between salts and MMPES, and showed the desired salt resistance.3.8 Shear thinning, shear recovery and viscoelasticity
The effect of the shear rate on the apparent viscosity of the polymer solutions (2000 mg L−1) was researched, as illustrated in Fig. 9(a). It can be observed clearly that the apparent viscosity of the three polymer solutions dropped as the shear rate increased from 7.34 to 80 s−1, and then maintained a small decreasing trend within the shear rate range, showing a non-Newtonian shear thinning behavior. Fig. 9(b), with the shear rate increased from 170 s−1 to 510 s−1 and then returned to 170 s−1 again, shows that the viscosity retention rates of HPAM, PMAD and h-PMAD solutions were 88.66%, 94.40% and 96.33%, respectively. Evidently, the apparent viscosity and viscosity retention of polymer PMAD and h-PMAD solutions are above those of the HPAM all the time, which reveals further the excellent shearing resistance of the two kinds of polymers. More critically, the hyper-branched polymer h-PMAD shows the desired properties in the shear thinning and shear recovery test. For the hyper-branched structure, the molecular chain was entangled, and the strength and toughness of the three-dimensional network structure re-associated after dissociation was stronger than that of HPAM. Also, the synergy of hydrogen bonding, hydrophobic association, and electrostatic forces in the polymer solution made the increase in viscosity.54 As for a higher viscosity retention, the high shear rate did not destroy the network structure completely, and molecular chains could form small-scale molecular chain micelles with each other. Meanwhile, the high contact probability between the molecular chains helped to form a certain size of fluid mechanics groups; when the shear rate reduced, the dissociated molecular chains were re-associated to form hydrophobic domains and exhibited a recoverable viscosity, in agreement with the literature.55The viscoelasticity of the polymers plays a crucial role in practical application processes, as the high viscoelasticity helps to increase the carrying capacity of the displacement cavities to the residual oil residue and wall oil film. The viscoelasticities of HPAM, PMAD and h-PMAD solutions (2000 mg L−1) were studied via the obtained viscous modulus (G′′) and elastic modulus (G′), as shown in Fig. 9(c). It can be seen intuitively that both G′ and G′′ increased gradually within the oscillation frequency range, in addition, both G′ and G′′ of PMAD and h-PMAD are higher than that of HPAM. Moreover, the curved intersection of h-PMAD has a lower frequency at 0.12 Hz than those of PMAD at 0.46 Hz and HPAM at 1 Hz. In the low-frequency region where molecules have sufficient time to keep relaxed under dynamic oscillation,56 the h-PMAD sample has a good chance to form large-sized aggregates relying on its hyper-branched structure and interactions between the polymer molecules, with the aggregate stored high elastic modulus under stress suggesting the dominance of elastic behavior.57
3.9 Temperature resistance and long-term stability
The influence of temperature on the polymer solutions (2000 mg L−1) in deionized water and formation water (for details see Table S5†) were studied from 30 °C to 100 °C under a shear rate of 7.34 s−1; the results are displayed in Fig. 10(a) and (b). There are three similar stages in the curves; in the first stage, the solutions apparent viscosity has a slightly decreased tendency with the rise of temperature until about 65 °C in deionized water and about 55 °C in formation water. Then, a rapid reduction in the apparent viscosity was observed before the temperature increased to 90 °C. In the final stage, the change of apparent viscosity became steady with temperature from 90 °C; the polymer h-PMAD solution with a viscosity retention of 33.51% and 50.96% in formation and deionized water, respectively, showed the optimal temperature resistance. In addition, the h-PMAD possessed a potential long-term stability with a lower viscosity loss after the solution was in simulated formation water at 80 °C for 4 weeks; the results are shown in Fig. 10(c). | ||
| Fig. 10 Rheological behavior of polymers: (a) temperature resistance in deionized water, (b) temperature resistance in formation water, (c) aging in formation water. | ||
Hydrophobic association is an endothermic driving process; when the temperature rises, the thermal motion of the ionic group increases, and the interaction between the anion and the cation weaken, causing a stretch of the macromolecular chain, and thereby increasing the viscosity of the solution. However, an increase of temperature intensifies the thermal motion of the hydrophobic and water molecules, causing the breaking of the hydration layer surrounding the hydrophobic groups, which weakens the hydrophobic association. Therefore, the relationship between the viscosity of the associative polymer solution and temperature is the result of competition between the two factors.58 In our system, when the temperature is relatively low, the effect of the hydrophobic group resulted in a smaller decrease in viscosity. With an increase of temperature, the association of the hydrophobic groups is strengthened, the movement of water molecules is accelerated, and the viscosity-increasing effect and viscosity-reducing effect are simultaneously present, but the viscosity-reducing effect is more significant, so the viscosity retention rate is greatly reduced. Finally, the slightly reduced viscosity retention is mainly a benefit from the monomer DMBSA, as the ring-shaped rigid groups increased the thermal motion resistance, causing an improvement of the polymer molecular backbone thermal stability.59 Besides, the hyper-branched structure provides multiple branches and results in a relatively high content of hydrophobic groups, which causes polymer h-PMAD to have the highest final viscosity retention because the hydrophobic association is an endothermic process.
3.10 Core flooding experiment
In order to study the ability of mobility control and the capacity to enhance oil recovery of the polymers, core flooding experiments were carried out and the results are shown in Fig. 11 (details in Table S7†). For three different systems, the injection pressure continued increasing with the increases of PV during the water and polymer solutions (2000 mg L−1) injection; after the polymer solution flooding, the injection pressure of the sequential water flooding decreased and tended to steady. However, the pressure and oil recovery in the injection stages of the polymer solutions are obvious different. Generally, the RF value is a measure of mobility control capability, so a higher RF value means a greater seepage resistance in the oil reservoir, which is more favorable to improving the swept volume. From Table S7,† the RF values of the polymers HPAM, PMAD and h-PMAD are 7.92, 10.00 and 14.29, respectively. The higher RF value of the h-PMAD indicates its more excellent mobility control ability and higher sweep volume in porous media. In addition, RRF is an index of the polymer solution used to reduce the permeability of porous media; a higher RRF value implies a greater reduction in the permeability of the porous media from the oil reservoir, which reflects in the contribution to enhance oil recovery. Thus, the polymer h-PMAD with an RFF value of 5.07 shows the more visible advantages than PMAD and HPAM with RFFs of 3.64 and 1.66, respectively, as it benefits from the higher retention rate caused by its unique structure and comprehensive properties.Moreover, according to the experiment results, polymer PMAD with EOR of 8.19%, higher than that of HPAM, 5.88%, provides powerful evidence that the functionalized polymer has sufficient advantages for this system in polymer flooding. Most importantly, the highest EOR of 11.61% about h-PMAD reveals that the hyper-branched structure provides an effective carrier for functional monomers to exert a greater effect, which has an extraordinary meaning.
4. Conclusions
A hyper-branched structural copolymer h-PMAD with, simultaneously, surface activity, an anti-polyelectrolyte effect and hydrophobic association was successfully prepared via aqueous solution free radical polymerization, and the structure was characterized by IR and NMR. The thermal properties, microscopic appearance, surface activity, thickening ability, rheological properties and aging were compared with those of HPAM and the linear copolymer PMAD, which was prepared using the same major monomers. The results manifested that the hyper-branched copolymer has an excellent comprehensive performance. Also, the copolymer h-PMAD EOR of 11.61% was obviously higher than PMAD, 8.19%, and HPAM, 5.88%. Most importantly, the better EOR of h-PMAD than of PMAD reveals that the hyper-branched structure provides an effective carrier for functional monomers to exert greater effects, which has an extraordinary meaning.Conflicts of interest
There are no conflicts to declare.Acknowledgements
This work was financially supported by the Key Technology Research and Development Program of Sichuan Province [grant number 2016FZ0121] and the Foundation of Youth Technology Innovation Team of Southwest Petroleum University [grant number 2017CXTD01].References
- D. A. Z. Wever, F. Picchioni and A. A. Broekhuis, Prog. Polym. Sci., 2011, 36, 1558–1628 CrossRef CAS.
- M. Riahinezhad, L. Romero-Zerón and N. Mcmanus, Fuel, 2017, 203, 269–278 CrossRef CAS.
- M. J. Caulfield, G. G. Qiao and D. H. Solomon, Chem. Rev., 2010, 33, 274 Search PubMed.
- H. Ehtesabi, M. M. Ahadian and V. Taghikhani, Energy Fuels, 2014, 28, 423–430 CrossRef CAS.
- M. S. Azad, Y. Dalsania and J. J. Trivedi, Can. J. Chem. Eng., 2018, 96, 2498–2508 CrossRef CAS.
- S. Arne, Z. Nematollah and G. J. Jacobsen, Colloids Interfaces, 2018, 2, 27 CrossRef.
- W. L. Kang, L. W. Meng and J. G. Niu, Polym. Mater. Sci. Eng., 2006, 22, 175–177 CAS.
- H. A. Yousefvand and A. Jafari, J. Pet. Sci. Eng., 2018, 162, 283–291 CrossRef CAS.
- Y. Wang, Z. Y. Lu and Y. G. Han, Adv. Mater. Res., 2011, 4, 306–307 Search PubMed.
- B. I. Choi, M. S. Jeong and K. S. Lee, Polym. Degrad. Stab., 2014, 110, 225–231 CrossRef CAS.
- M. S. Kamal, A. S. Sultan and U. A. Mubaiyedh, Can. J. Chem. Eng., 2015, 93, 1194–1200 CrossRef CAS.
- L. Yi, K. Z. Li and D. X. Liu, Adv. Mater. Res., 2013, 800, 411–416 Search PubMed.
- A. N. El-Hoshoudy, S. E. M. Desouky and A. M. Alsabagh, Egypt. J. Pet., 2016, 26, S1110062116300332 Search PubMed.
- X. Li, Z. Xu and H. Yin, Energy Fuels, 2017, 31, 2479–2487 CrossRef CAS.
- T. Li, T. Ci and L. Chen, Polym. Chem., 2013, 5, 979–991 RSC.
- M. Yang, C. Liu and Z. Li, Macromolecules, 2010, 43, 10645–10651 CrossRef CAS.
- R. Liu, W. Pu and J. J. Sheng, J. Taiwan Inst. Chem. Eng., 2017, 80, 639–649 CrossRef CAS.
- L. Mi and S. Jiang, Angew. Chem., 2014, 53, 1746–1754 CrossRef CAS PubMed.
- Q. Yang and M. Ulbricht, Chem. Mater., 2012, 24, 2943–2951 CrossRef CAS.
- J. Sun, F. Zeng and H. Jian, Polym. Chem., 2013, 4, 5810–5818 RSC.
- P. Mary, D. D. Bendejacq and M. P. Labeau, J. Phys. Chem. B, 2007, 111, 7767–7777 CrossRef CAS PubMed.
- Z. Chu and Y. Feng, Langmuir, 2012, 28, 1175–1181 CrossRef CAS PubMed.
- C. A. Zuniga, J. B. Goods and J. R. Cox, ACS Appl. Mater. Interfaces, 2016, 8, 1780–1785 CrossRef CAS PubMed.
- M. D. Holtmyer and C. V. Hunt, US Pat. 4959163, 1990.
- R. Dong, Y. Zhou and X. Zhu, Acc. Chem. Res., 2014, 47, 2006–2016 CrossRef CAS PubMed.
- D. Wang, T. Zhao and X. Zhu, Chem. Soc. Rev., 2015, 44, 4023–4071 RSC.
- A. K. Patri, I. J. Majoros and J. R. Baker, Curr. Opin. Chem. Biol., 2002, 6, 466–471 CrossRef CAS PubMed.
- S. Hecht, N. Vladimirov and J. M. Frechet, J. Am. Chem. Soc., 2001, 1, 18–25 CrossRef.
- Q. Huang, S. Costanzo and C. Das, J. Rheol., 2016, 61, 35–47 CrossRef.
- D. A. Z. Wever, F. Picchioni and A. A. Broekhuis, Eur. Polym. J., 2013, 49, 3289–3301 CrossRef CAS.
- W. Pu, R. Liu and B. Li, RSC Adv., 2015, 107, 88002–88013 RSC.
- R. Liu, W. Pu and D. Du, J. Pet. Sci. Eng., 2018, 164, 467–484 CrossRef CAS.
- B. J. Klemm, F. Picchioni and P. Raffa, Ind. Eng. Chem. Res., 2018, 57, 8835–8844 CrossRef CAS PubMed.
- S. Gou, S. Luo and T. Liu, New J. Chem., 2015, 39, 7805–7814 RSC.
- S. Gou, Y. He and L. Zhou, New J. Chem., 2015, 39, 9265–9274 RSC.
- S. Gou, Q. Zhang and C. Yang, RSC Adv., 2016, 80, 76696–76706 RSC.
- S. Gou, T. Yin and L. Yan, Colloids Surf., A, 2015, 471, 45–53 CrossRef CAS.
- S. Li, S. Gou and C. Xin, New J. Chem., 2018, 42, 6848–6857 RSC.
- S. Gou, Y. He and Y. Ma, RSC Adv., 2015, 5, 51549–51558 RSC.
- M. Azizi, Eur. J. Org. Chem., 2016, 22, 3796–3803 CrossRef.
- A. M. S. Maia, R. Borsali and R. C. Balaban, Mater. Sci. Eng. Carbon, 2009, 29, 505–509 CrossRef CAS.
- D. A. Wever, F. Picchioni and A. A. Broekhuis, Ind. Eng. Chem. Res., 2013, 52, 16352–16363 CrossRef CAS.
- K. Tsutsumi, Y. Okamoto and Y. Tsukahara, Polymer, 1994, 10, 2205–2209 CrossRef.
- T. Nakano, A. Matsuda and Y. Okamoto, Polym. J., 1996, 6, 556–558 CrossRef.
- J. Cao, Y. Tan and Y. Che, J. Macromol. Sci., Part A: Pure Appl. Chem., 2010, 6, 595–601 CrossRef.
- T. R. Nogueira, M. C. Gonçalves and L. Ferrareso, Adv. Polym. Technol., 2010, 1, 11–19 CrossRef.
- A. G. And and T. Fukuda, Macromolecules, 1997, 15, 4272–4277 Search PubMed.
- C. Costa, A. L. Alberton and A. F. Santos, Macromol. React. Eng., 2015, 4, 366–373 CrossRef.
- L. Yan, T. Yin and W. Yu, RSC Adv., 2015, 5, 42843–42847 RSC.
- M. Alsharif, Doctoral Dissertation, University of Sheffield, 2015.
- S. Gou, M. Liu and Z. Ye, J. Appl. Polym. Sci., 2014, 8, 631–644 Search PubMed.
- A. Laschewsky and I. Zerbe, Polymer, 1991, 32, 2081–2086 CrossRef CAS.
- A. N. El-Hoshoudy, S. E. M. Desouky and M. A. Betiha, Fuel, 2016, 170, 161–175 CrossRef CAS.
- J. Chen, M. Jiang and Y. Zhang, Macromolecules, 1999, 32, 4861–4866 CrossRef CAS.
- R. A. Muesing, F. A. Lornitzo and S. Kumar, J. Biol. Chem., 1975, 250, 1814–1823 CAS.
- M. Keramatinia, F. Najafi and M. R. Saeb, Prog. Org. Coat., 2017, 113, 151–159 CrossRef CAS.
- R. Farajzadeh, A. Andrianov and P. L. J. Zitha, Ind. Eng. Chem. Res., 2010, 4, 1910–1919 CrossRef.
- D. W. Urry, Chem. Phys. Lett., 2004, 399, 177–183 CAS.
- H. Jia and H. Chen, J. Pet. Sci. Eng., 2018, 165, 105–113 CrossRef CAS.
Footnote |
| † Electronic supplementary information (ESI) available. See DOI: 10.1039/c9ra01554j |
| This journal is © The Royal Society of Chemistry 2019 |

