 Open Access Article
A highly specific and sensitive turn-on fluorescence probe for hypochlorite detection and its bioimaging applications†
Lei Jinab,
Xiaoxue Tana,
Lihui Daia,
Liqiang Shenga and
Qingming Wang *a
*a
aSchool of Pharmacy, Yancheng Teachers’ University, Yancheng, Jiangsu 224051, People’s Republic of China. E-mail: wangqm@yctu.edu.cn
bCollege of Biotechnology and Pharmaceutical Engineering, Nanjing University of Technology, Nanjing, 210009, People’s Republic of China
First published on 21st May 2019
Abstract
Development of high performance fluorescent chemosensors for the detection of ClO− in vitro and in vivo is very desirable, because many human diseases are caused by ClO−. In this paper, a highly selectivity and sensitive fluorescent probe, EDPC, based on 3-acetylcoumarin, was synthesized, which could respond to ClO− and exhibit an “off–on” mode in Tris–HCl buffer (pH = 7.2, 10 mM, 50% C2H5OH) solutions. The detection limit of the EDPC probe for ClO− was as low as 1.2 × 10⁻⁸ M. Moreover, the high selectivity and high sensitivity of EDPC towards ClO− are attributed to the oxidation reaction between the C–O of the coumarin lactone and the C![[double bond, length as m-dash]](https://www.rsc.org/images/entities/char_e001.gif) C formed by aldol condensation and the mechanism was further verified using ESI-MS and DFT. Additionally, the concentrations of ClO− in real water were also calculated using the EDPC probe and showed good recovery. Finally, the distribution of intracellular endogenous ClO− was gained by confocal fluorescence microscopy in living HEK293T cells.
C formed by aldol condensation and the mechanism was further verified using ESI-MS and DFT. Additionally, the concentrations of ClO− in real water were also calculated using the EDPC probe and showed good recovery. Finally, the distribution of intracellular endogenous ClO− was gained by confocal fluorescence microscopy in living HEK293T cells.
Introduction
As the natural byproducts of normal metabolism, reactive oxygen species (ROS) play many important roles in physiological and pathological processes.1–4 Among the various ROS, hypochlorous acid (HClO) and its conjugate base hypochlorite (ClO−) are two of the most important ROS and could be generated by the per-oxidation of chloride ions which is catalysed by myeloperoxidase (MPO).5–7 The generated HClO/ClO− is mainly located in neutrophils, macrophages and monocytes.8 HClO/ClO− plays critical roles in a lot of biological processes such as those of the immune system, besides, many tissue injuries could be induced with HClO/ClO− by damaging proteins, nucleic acids and lipids through oxidation and chlorination.9,10 However, many kinds of diseases could be led by overproduced HClO/ClO−.11–20 What’s more, our daily lives are depended on hypochlorite, because it is used in the disinfection of drinking water, household bleach, cooling-water and cyanide treatment.21 Thus, it is essential to detect the concentration of HClO/ClO−.Up to now, numerous sensitive and selective analytical methods have been proposed for the detection of HClO/ClO−, and among of them, fluorescent probes play an important role due to their high temporal and spatial resolution. To date, a large number of fluorescent probes for HOCl/ClO− detection have been developed based on specific fluorophores, for example, dibenzoylhydrazine,22 oxime,23,24 p-methoxyphenol,25 selenide,26 diaminomaleonitrile27 and others.21,28–35 Unfortunately, many of the reported HClO/ClO− probes display a delayed response time, and weak fluorescence intensity and are unavailable for bioimaging application.
Research has showed that compounds containing unbridged C![[double bond, length as m-dash]](https://www.rsc.org/images/entities/char_e001.gif) C bonds are commonly nonfluorescent due to the fact that C
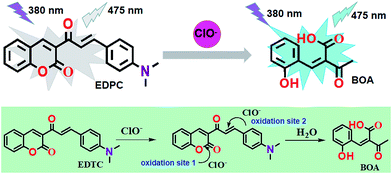
C bonds are commonly nonfluorescent due to the fact that C![[double bond, length as m-dash]](https://www.rsc.org/images/entities/char_e001.gif) C isomerization is a predominant decay process of excited states.36,37 What’s more, our reported work illustrated that the C–O of coumarin could be cleaved by the oxidation of HClO/ClO−.38 Taking these mechanisms into account, a novel fluorescent probe, named 3-((E)-3-(4-(dimethylamino)phenyl)acryloyl)-2H-chromen-2-one (EDPC) based on coumarin and 4-dimethylaminobenzaldehyde was designed and synthesized. The coumarin was chosen as the fluorescent group due to the high fluorescence quantum yield and several positions available for functional modification. EDPC was developed by a one-step reaction (shown in Scheme 1) where the 3-acetylcoumarin was reacted with an aldehyde group. Due to the oxidation characteristics of HClO/ClO−, a C
C isomerization is a predominant decay process of excited states.36,37 What’s more, our reported work illustrated that the C–O of coumarin could be cleaved by the oxidation of HClO/ClO−.38 Taking these mechanisms into account, a novel fluorescent probe, named 3-((E)-3-(4-(dimethylamino)phenyl)acryloyl)-2H-chromen-2-one (EDPC) based on coumarin and 4-dimethylaminobenzaldehyde was designed and synthesized. The coumarin was chosen as the fluorescent group due to the high fluorescence quantum yield and several positions available for functional modification. EDPC was developed by a one-step reaction (shown in Scheme 1) where the 3-acetylcoumarin was reacted with an aldehyde group. Due to the oxidation characteristics of HClO/ClO−, a C![[double bond, length as m-dash]](https://www.rsc.org/images/entities/char_e001.gif) C functions as a sensitive unit to lead to changes in fluorescence intensity. Excellent properties like high sensitivity and selectivity, rapid response and so on, make the EDPC probe a promising tool for HClO/ClO− detection in water, applications for real samples and bioimaging of endogenous HClO/ClO−.
C functions as a sensitive unit to lead to changes in fluorescence intensity. Excellent properties like high sensitivity and selectivity, rapid response and so on, make the EDPC probe a promising tool for HClO/ClO− detection in water, applications for real samples and bioimaging of endogenous HClO/ClO−.
Results and discussion
Synthesis and structural characterization of EDPC
As shown in Scheme 1, EDPC was obtained from the reaction of 3-acetylcoumarin, 4-dimethylaminobenzaldehyde and morpholine in ethanol. Its structure was characterized using 1H-NMR, 13C-NMR, elemental analyses (EAs), and electrospray ionization mass spectra (ESI-MS) (Fig. S1–S3†).Fluorescent spectral responses of EDPC with NaClO
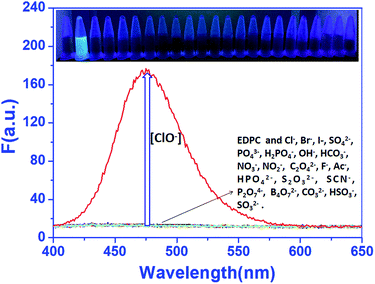
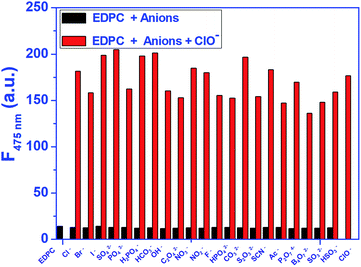
First, the selectivity of EDPC to ClO− against other anions was analysed by us (shown in Fig. 1). Fluorescence emission enhancement of EDPC (1.0 μM) in Tris–HCl buffer (pH = 7.2, 10 mM, 50% C2H5OH) was hardly observed when excited at 380 nm. The fluorescent emission intensity at 475 nm was remarkably increased after 1.0 equiv. of NaClO was added, but when other anions were added to EDPC (1.0 μM) in Tris–HCl buffer (pH = 7.2, 10 mM, 50% C2H5OH), no obvious changes in fluorescent intensity at 475 nm were found. Additionally, a competition experiment was also studied. From Fig. 2, we found that the fluorescence emission intensity at 475 nm was increased with the addition of 1.0 equiv. of NaClO and 5.0 equiv. of other anions together. It is gratifying to note that all of the studied anions had no interference with the fluorescence response of EDPC toward NaClO in Tris–HCl buffer (pH = 7.2, 10 mM, 50% C2H5OH). The above results indicated that EDPC could not respond to the tested anions, and showed high selectivity toward NaClO over the tested anions.UV-vis absorption spectra of EDPC towards ClO−
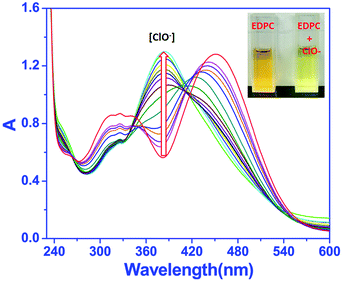
The UV-vis absorption spectra of EDPC with different concentrations of ClO− were studied. As shown in Fig. 3, with increasing ClO− at room temperature, the absorption peaks of EDPC at 250 nm and 385 nm gradually increased, and the peaks at 330 nm and 450 nm gradually decreased.Three well-defined isosbestic points at 262 nm, 343 nm and 413 nm were noted, indicating that a new compound was generated. Besides, a color change from orange to a bright yellow can be visualized clearly by naked eye (Fig. 3 inset).
Fluorescence response of EDPC to NaClO
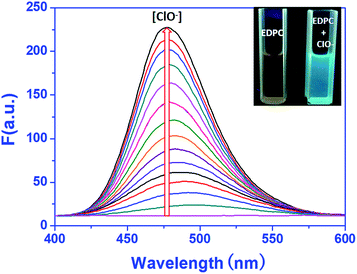
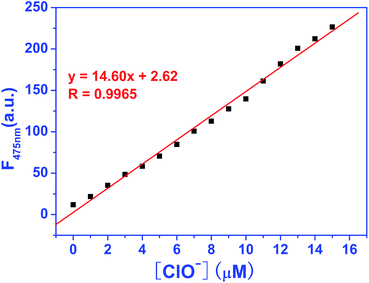
For investigating the concentration dependence of EDPC to ClO− in Tris–HCl buffer (pH = 7.2, 10 mM, 50% C2H5OH), a fluorescence titration experiment was carried out using a RF-5301 fluorescence spectrophotometer. As shown in Fig. 4, when 1.0 μM of EDPC solution in Tris–HCl buffer (pH = 7.2, 10 mM, 50% C2H5OH) was excited at 380 nm, no fluorescence emission intensity was exhibited. Upon the addition of ClO− into the EDPC solution, an obvious fluorescence emission peak at 475 nm was observed. The fluorescence emission intensity at 475 nm gradually increased with increasing ClO− (0–16 μM). A blue fluorescence appeared dramatically under a 365 nm UV lamp (Fig. 4 inset). We used a CIE chromaticity diagram to further verify the fluorescence color. From Fig. S4,† the CIE color coordinate was (0.1752, 0.2432), which was located in the blue area.More detailed information on the concentration of ClO− and the fluorescence emission intensity are given in Fig. 5. From Fig. 5, an excellent linearity (R2 = 0.9985) between the fluorescence intensity and the concentration of ClO− ranging from 0 to 14 μM was found. The detection limit was 1.2 × 10⁻⁸ M−1 and was calculated by following the equation of LOD = 3σ/k.
Selectivity over metal ions
Furthermore, metal ions existing in biological system were tested. This work indicated that the significant fluorescence color change from colorless to blue in Tris–HCl buffer (pH = 7.2, 10 mM, 50% C2H5OH) appeared only upon the introduction of ClO−, while the tested metal ions (such as Na+, K+, Mg2+, Ca2+, Ba2+, Mn2+, Ni2+, Cu2+, Cd2+, Ag+, Hg2+, etc.), did not induce any significant changes in the fluorescence emission spectrum of EDPC (Fig. S5†). Besides, when ClO− and the tested metal ions were added to the solution of EDPC together in Tris–HCl buffer (pH = 7.2, 10 mM, 50% C2H5OH), an obvious fluorescence emission peak at 475 nm was observed. So, the coexisting metal ions could not interfere with the interaction between the EDPC probe and ClO− (Fig. S6†).Job plots
We obtained a Job plot of EDPC and ClO− using the fluorescence spectra. The overall concentrations of EDPC and ClO− were kept constant at 20 μM. Besides, the fluorescence spectra of [ClO−]/([EDPC] + [ClO−]) with the ratios of 9![[thin space (1/6-em)]](https://www.rsc.org/images/entities/char_2009.gif) :
:![[thin space (1/6-em)]](https://www.rsc.org/images/entities/char_2009.gif) 1, 8
1, 8![[thin space (1/6-em)]](https://www.rsc.org/images/entities/char_2009.gif) :
:![[thin space (1/6-em)]](https://www.rsc.org/images/entities/char_2009.gif) 2, 7
2, 7![[thin space (1/6-em)]](https://www.rsc.org/images/entities/char_2009.gif) :
:![[thin space (1/6-em)]](https://www.rsc.org/images/entities/char_2009.gif) 3, 6
3, 6![[thin space (1/6-em)]](https://www.rsc.org/images/entities/char_2009.gif) :
:![[thin space (1/6-em)]](https://www.rsc.org/images/entities/char_2009.gif) 4, 5
4, 5![[thin space (1/6-em)]](https://www.rsc.org/images/entities/char_2009.gif) :
:![[thin space (1/6-em)]](https://www.rsc.org/images/entities/char_2009.gif) 5, 4
5, 4![[thin space (1/6-em)]](https://www.rsc.org/images/entities/char_2009.gif) :
:![[thin space (1/6-em)]](https://www.rsc.org/images/entities/char_2009.gif) 6, 3
6, 3![[thin space (1/6-em)]](https://www.rsc.org/images/entities/char_2009.gif) :
:![[thin space (1/6-em)]](https://www.rsc.org/images/entities/char_2009.gif) 7, 2
7, 2![[thin space (1/6-em)]](https://www.rsc.org/images/entities/char_2009.gif) :
:![[thin space (1/6-em)]](https://www.rsc.org/images/entities/char_2009.gif) 8, 1
8, 1![[thin space (1/6-em)]](https://www.rsc.org/images/entities/char_2009.gif) :
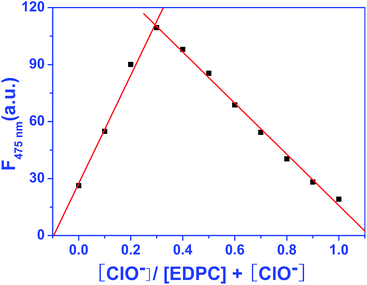
:![[thin space (1/6-em)]](https://www.rsc.org/images/entities/char_2009.gif) 9 were recorded. The Job plot was constructed using the fluorescence emission intensity at 475 nm. As showed in Fig. 6, the maximum fluorescence emission intensity was at a ratio of nearly 0.32, indicating that there were two oxidation sites between the EDPC probe and ClO−. This result was further confirmed by DFT and ESI-MS.
9 were recorded. The Job plot was constructed using the fluorescence emission intensity at 475 nm. As showed in Fig. 6, the maximum fluorescence emission intensity was at a ratio of nearly 0.32, indicating that there were two oxidation sites between the EDPC probe and ClO−. This result was further confirmed by DFT and ESI-MS.
Time-dependence in the detection process of hypochlorite
To better understand the reaction between EDPC and ClO−, time-dependent modulation in the fluorescence spectra was measured and shown in Fig. 7. The results showed that the fluorescence emission intensity at 475 nm increased dramatically when ClO− was present and the fluorescence intensity reached a steady value within 40 s. This means that our proposed EDPC probe will provide a rapid analytical method for the detection of ClO−.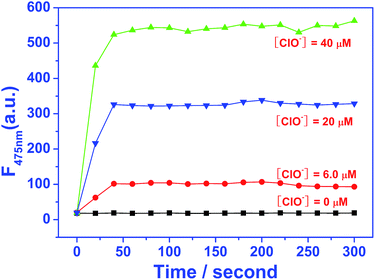 | ||
| Fig. 7 Reaction-time profile of EDPC (2.0 μM) in the presence of different concentrations of ClO− in Tris–HCl buffer (pH = 7.2, 10 mM, 50% C2H5OH) solution at room temperature (λex = 380 nm). | ||
Cell imaging
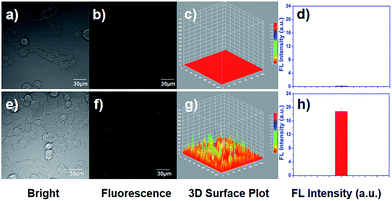
To investigate the cell permeability, fluorescent imaging of ClO− using EDPC in living HEK293T was studied. As in our early report,39 the cytotoxicity of EDPC was assessed by using an MTT assay to determinate the possibility of EDPC being applied in living cells. From Fig. S7,† in the concentration range of 0 to 32 μM EDPC, there was more than 95% cell survival after incubation for 24 h, which declared that EDPC had almost no prominent cytotoxicity, and could be used for biological bodies. Then, the capability of EDPC to image ClO− in HEK293T cells was studied. HEK293T cells incubated with 5 μM of EDPC for 30 min displayed no significant fluorescence for EDPC. After the incubated cells were treated with 5 μM of EDPC and 10 μM ClO− for 40 min, a strong blue fluorescence image was recorded using a fluorescence microscope (Fig. 8). The results indicated that EDPC had potential applicability for detecting ClO− in living cells with good cell membrane permeability.Besides, we also studied the capability of ClO− in living cells. It is reported that ClO− can be produced in living cells when lipopolysaccharide (LPS) and phorbol myristate acetate (PMA) coexist together.40 From Fig. 8d and h, we found that the quantifications of fluorescence intensities collected from the cell images were 0.022 and 8.27, respectively. These results strongly illustrated that EDPC could serve as a useful probe for sensing and imaging ClO− which is produced by living cells.
Sensing mechanism
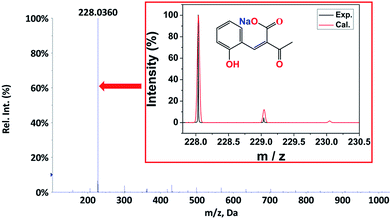
From the Job plot, we could find that there were two oxidation sites between the EDPC probe and ClO−. According to early studies,38 a plausible recognition mechanism of the EDPC probe and ClO− is illustrated in Scheme 2. ESI-MS spectra were further used to verify the binding event of EDPC with ClO−. As shown in Fig. 9, a peak at m/z = 228.0360 corresponded to [BOA − H + Na]+ (cal. 228.0311). The ESI-MS result also confirmed the oxidation reaction between the C–O of the coumarin lactone and the C![[double bond, length as m-dash]](https://www.rsc.org/images/entities/char_e001.gif) C formed by aldol condensation.
C formed by aldol condensation.
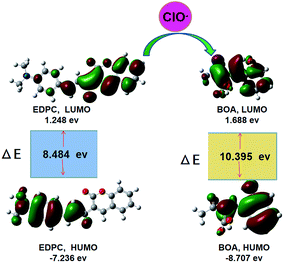
Density Functional Theory (DFT) calculations using the Gaussian 09 program was another method used to verify the sensing mechanism. The highest occupied molecular orbitals (HOMO) and the lowest occupied molecular orbitals (LOMO) of EDPC and BOA are listed in Fig. 10. The HOMO of EDPC was mainly distributed on the benzaldehyde group, and the LOMO was mainly distributed on the coumarin group. When EDPC was transformed into BOA by adding ClO−, the large HOMO–LOMO gap was 1.911 eV (the HOMO–LOMO energy gaps for EDPC and BOA were 8.484 and 10.395 eV, respectively), and showed the high stability of BOA. BOA gave a blue fluorescence emission spectrum, which was consistent with our reported results.38
Application studies
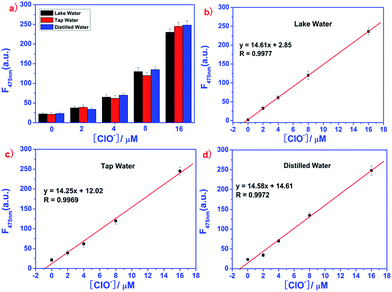
To investigate the applications of the EDPC probe, the concentration of ClO− in real samples such as lake water, tap water and distilled water were studied using fluorescence spectra. Before examination, the real samples were obtained without any pre-treatment. The fluorescence intensity of the EDPC probe (1.0 μM) in Tris–HCl buffer (pH = 7.2, 10 mM, 50% C2H5OH) with different concentrations of ClO− (0, 2, 4, 8, 16 μM) was investigated in the samples of lake water, tap water and distilled water. As showed in Fig. 11, a good relationship between the fluorescence emission at F475 nm and the ClO− concentration in real water samples was found. Table 1 shows that the recoveries of ClO− in these samples were consistent. All the results confirmed that the EDPC probe was reliable and convenient. More interestingly, the EDPC probe could be used to detect ClO− in real water samples.| Sample | ClO− added (μM) | ClO− found (μM) | Recovery (%) |
|---|---|---|---|
| Lake water | 0 | 0.02 ± 0.003 | 0 |
| 2 | 2.06 ± 0.008 | 103.0 | |
| 4 | 4.01 ± 0.021 | 100.2 | |
| 8 | 8.04 ± 0.031 | 100.5 | |
| 16 | 16.01 ± 0.028 | 100.1 | |
| Tap water | 0 | 0.012 ± 0.008 | 0 |
| 2 | 2.13 ± 0.025 | 106.5 | |
| 4 | 4.07 ± 0.016 | 101.7 | |
| 8 | 8.04 ± 0.026 | 100.5 | |
| 16 | 16.22 ± 0.032 | 101.4 | |
| Distilled water | 0 | 0.05 ± 0.011 | 0 |
| 2 | 2.03 ± 0.012 | 101.5 | |
| 4 | 4.02 ± 0.048 | 100.5 | |
| 8 | 7.98 ± 0.036 | 99.7 | |
| 16 | 16.24 ± 0.009 | 101.5 |
Experimental
Materials and method
All reagents were purchased from commercial providers and used without further purification. The metal ions came from their chlorides or nitrates and the anions came from their sodium salts or potassium salts, which were obtained from Shanghai Experiment Reagent Co., Ltd (Shanghai, China). All aqueous solutions are prepared with deionized water.A Bruker DRX 400 spectrometer with TMS as an internal standard was used to record the 1H-NMR and 13C-NMR spectra. A NICOLET380 FT-IR spectrometer, with the samples in KBr disks, was used to obtain the FT-IR spectra (4000–400 cm−1). A VARI-EL elemental analyzer was used to carry the elemental analyses (EAs). A Triple TOF TM 5600+ system was applied to obtain the electrospray ionization mass spectra (ESI-MS). A RF-5301 fluorescence spectrophotometer was used to record the fluorescence spectral data. A UV-1800 ENG 240 V was used to obtain the Ultraviolet spectra. Fluorescence images of HEK293T cells were recorded using a Leica-LCS-SP8-STED model confocal laser scanning microscope.
Fluorescence and UV-vis studies
We recorded the fluorescence spectra and UV-vis spectra in a quartz optical cell of 1.0 cm optical path length at room temperature. EDPC was prepared in absolute DMSO and the stock solution concentration was 1 × 10⁻² M. For all fluorescence spectra, the samples were excited at 380 nm, with the slit widths were 3 nm and 3 nm, respectively. The emission spectra were recorded in the range of 390–650 nm. The fluorescence procedures were as follows: the metal ions and anion samples were gradually put into Tris–HCl buffer (pH = 7.2, 10 mM, 50% C2H5OH) containing 1.0 μM of EDPC, then the titration experiment and competition experiments were carried out. For the UV-vis spectra, 20 μM of EDPC was put into a quartz cell containing Tris–HCl buffer (pH = 7.2, 10 mM, 50% C2H5OH) and 1 × 10⁻³ M ClO− was gradually added.Cell incubation and imaging
HEK293T cells were cultured at 37 °C in a 5% CO2 atmosphere, in DMEM, with 10% fetal bovine serum (FBS) and a 0.1% antibiotic–antimycotic mix antibiotic supplement. These cells were then washed with 1× PBS and incubated in 10 μM of EDPC for 30 min, and then treated with 20 μM of NaClO for another 40 min. Then, the HEK293T cells were washed with 1× PBS three times to remove the excess EDPC and NaClO. Lastly, a Leica-LCS-SP8-STED laser confocal fluorescence microscope was used to image the HEK293T cells. “HEK293T cells” were purchased from the company of Life Technologies, Shanghai.Synthesis of EDPC
As reported in an early method,38,41–43 EDPC was synthesized by a one-step reaction. 0.565 g (3 mmol) of 3-acetylcoumarin and 0.447 g (3 mmol) of 4-dimethylaminobenzaldehyde were added to 30.0 mL ethanol. Then 0.2 mL morpholine was added into the above mentioned solution. After this, the resulting solution was refluxed for 5 h with constant stirring. On completion, the reaction mixture was evaporated under reduced pressure, and a red crude EDPC product was obtained and recrystallized in CHCl3 and ethanol (1![[thin space (1/6-em)]](https://www.rsc.org/images/entities/char_2009.gif) :
:![[thin space (1/6-em)]](https://www.rsc.org/images/entities/char_2009.gif) 1). The yield of product was 42.3%. EAs: found, C, 75.22; H, 5.29; N: 4.39%. Molecular formula C20H17NO3 requires: C: 75.22; H: 5.37; N: 4.39%. 1H-NMR (400 MHz, DMSO) δ 8.60 (s, 1H), 7.94 (dd, J = 7.8, 1.5 Hz, 1H), 7.74 (ddd, J = 23.3, 12.4, 8.7 Hz, 2H), 7.60 (d, J = 8.9 Hz, 2H), 7.53–7.35 (m, 3H), 6.76 (d, J = 9.0 Hz, 2H), 2.51 (dt, J = 3.6, 1.8 Hz, 16H). 13C-NMR (DMSO-d6, 100 MHz) δ 187.06 (s), 154.75 (s), 152.70 (s), 146.34 (s), 131.25 (s), 130.66 (s), 126.72 (s), 125.35 (s), 122.09 (s), 119.40 (s), 119.03 (s), 116.62 (s), 112.31 (s). Exact mass for EDPC (Mr = 319.1208), ESI-MS (positive mode) found [EDPC + H]+ (m/z, 320.0428), molecular formula C11H8O4 requires [EDPC + H]+ (m/z, 320.1287).
1). The yield of product was 42.3%. EAs: found, C, 75.22; H, 5.29; N: 4.39%. Molecular formula C20H17NO3 requires: C: 75.22; H: 5.37; N: 4.39%. 1H-NMR (400 MHz, DMSO) δ 8.60 (s, 1H), 7.94 (dd, J = 7.8, 1.5 Hz, 1H), 7.74 (ddd, J = 23.3, 12.4, 8.7 Hz, 2H), 7.60 (d, J = 8.9 Hz, 2H), 7.53–7.35 (m, 3H), 6.76 (d, J = 9.0 Hz, 2H), 2.51 (dt, J = 3.6, 1.8 Hz, 16H). 13C-NMR (DMSO-d6, 100 MHz) δ 187.06 (s), 154.75 (s), 152.70 (s), 146.34 (s), 131.25 (s), 130.66 (s), 126.72 (s), 125.35 (s), 122.09 (s), 119.40 (s), 119.03 (s), 116.62 (s), 112.31 (s). Exact mass for EDPC (Mr = 319.1208), ESI-MS (positive mode) found [EDPC + H]+ (m/z, 320.0428), molecular formula C11H8O4 requires [EDPC + H]+ (m/z, 320.1287).
Conclusions
In summary, we have followed our previously developed approach and developed a new fluorescent probe (EDPC) for the detection of ClO− in Tris–HCl buffer (pH = 7.2, 10 mM, 50% C2H5OH) with a low detection limit (1.2 × 10⁻⁸ M). EDPC shows a rapid (the response time is 20 s) and significant fluorescence turn-on for ClO− with high selectivity and sensitivity over a large number of anions and metal ions with about a 95 nm Stokes shift when excited at 380 nm (λmax = 475 nm). Moreover, in practical application, good recoveries from 99.7% to 106.5% were obtained for the real water sample. Additionally, the EDPC probe showed very low cytotoxicity and could be used for imaging of both exogenous and endogenous ClO− in living HEK293 cells. Importantly, the mechanism was further confirmed by ESI-MS and DFT and showed an oxidation reaction between the C–O of the coumarin lactone and the C![[double bond, length as m-dash]](https://www.rsc.org/images/entities/char_e001.gif) C formed by aldol condensation. With these positive results, the EDPC probe could be used as a valuable tool for the detection of ClO− in living systems.
C formed by aldol condensation. With these positive results, the EDPC probe could be used as a valuable tool for the detection of ClO− in living systems.
Conflicts of interest
There are no conflicts to declare.Acknowledgements
This work was financially supported by the National Natural Science Foundation for Young Scientists of China (21301150), the Post-Doctoral Foundation of Jiangsu Provincial (1501032B), the Practice Innovation Training Program Projects for the Jiangsu College students (201610324021Z), and the Six Talent Peak Project in Jiangsu Province (SWYY-063) and sponsored by the Qing Lan Project of Jiangsu Province.Notes and references
- Y. Chen, T. Wei, Z. Zhang, W. Zhang and J. Lv, Chin. Chem. Lett., 2017, 28, 1957 CrossRef CAS.
- C. C. Winterbourn, Nat. Chem. Biol., 2008, 4, 278 CrossRef CAS PubMed.
- X. Chen, K. Lee, X. Ren, J. Ryu, G. Kim, J. Ryu, W. Lee and J. Yoon, Nat. Protoc., 2016, 11, 1219 CrossRef CAS PubMed.
- S. K. Yoo, T. W. Starnes, Q. Deng and A. Huttenlocher, Nature, 2011, 480, 109 CrossRef CAS PubMed.
- J. Li, T. Liu, F. Huo, J. Chao, Y. Zhang and C. Yin, Spectrochim. Acta, Part A, 2017, 174, 17 CrossRef CAS PubMed.
- A. J. Kettle and C. C. Winterbourn, Redox Rep., 1997, 3, 3 CrossRef CAS PubMed.
- E. Hidalgo, R. Bartolome and C. Dominguez, Chem.-Biol. Interact., 2002, 139, 265 CrossRef CAS PubMed.
- L. Jin, M. Y. Xu, H. Jiang, W. L. Wang and Q. M. Wang, Anal. Methods, 2018, 10, 4562 RSC.
- X. Song, B. Dong, X. Kong, C. Wang and N. Zhang, Spectrochim. Acta, Part A, 2018, 188, 394 CrossRef CAS PubMed.
- Y. Zhao, H. Y. Li, Y. Y. Xue, Y. H. Ren and T. H. Han, Sens. Actuators, B, 2017, 241, 335 CrossRef CAS.
- T. Hasegawa, E. Malle and A. Farhood, Am. J. Physiol.: Gastrointest. Liver Physiol., 2005, 289, G760 CrossRef CAS PubMed.
- Y. Wang, J. Xia, J. Han, X. Bao, Y. Li, X. Tang, L. Ni, L. Wang and M. Gao, Talanta, 2016, 161, 847 CrossRef CAS PubMed.
- S. Hammerschmidt, T. Vogel, S. Jockel, C. Gessner, H. J. Seyfarth, A. Gillissen and H. Wirtz, Respir. Med., 2007, 101, 1205 CrossRef PubMed.
- S. Sugiyama, K. Kugiyama, M. Aikawa, S. Nakamura, H. Ogawa and P. Libby, Arterioscler., Thromb., Vasc. Biol., 2004, 24, 1309 CrossRef CAS PubMed.
- Y. Koide, Y. Urano, K. Hanaoka, T. Terai and T. Nagano, J. Am. Chem. Soc., 2001, 133, 5680 CrossRef PubMed.
- L. J. Hazell, L. Arnold, D. Flowers, G. Waeg, E. Malle and R. Stocker, J. Clin. Invest., 1996, 97, 1535 CrossRef CAS PubMed.
- E. A. Podrez, H. M. Abu-Soud and S. L. Hazen, Free Radical Biol. Med., 2000, 28, 1717 CrossRef CAS PubMed.
- D. I. Pattison and M. J. Davies, Chem. Res. Toxicol., 2001, 14, 1453 Search PubMed.
- S. M. Wu and S. V. Pizzo, Arch. Biochem. Biophys., 2001, 391, 119 CrossRef CAS PubMed.
- X. Jin, L. Hao, Y. Hu, M. She and Y. Shi, Sens. Actuators, B, 2013, 186, 56 CrossRef CAS.
- M. P. Algi, Tetrahedron Lett., 2016, 72, 1558 CrossRef CAS.
- Y. Zhao, H. Li, Y. Xue, Y. Ren and T. Han, Sens. Actuators, B, 2017, 241, 335 CrossRef CAS.
- D. Li, Y. Feng, J. Lin, M. Chen, S. Wang, X. Wang, H. Sheng, Z. Shao and M. Zhu, Sens. Actuators, B, 2016, 222, 483 CrossRef CAS.
- N. Zhao, Y. H. Wu, R. M. Wang, L. X. Shi and Z. N. Chen, Analyst, 2011, 136, 2277–2282 RSC.
- Z. N. Sun, F. Q. Liu and Y. Chen, Org. Lett., 2008, 10, 2171 CrossRef CAS PubMed.
- Z. Lou, P. Li and Q. Pan, Chem. Commun., 2013, 49, 2445 RSC.
- L. Yuan, W. Lin and J. Song, Chem. Commun., 2011, 47, 12691 RSC.
- P. Zhang, H. Wang, D. Zhang, X. Zeng, R. Zeng and L. Xiao, Sens. Actuators, B, 2018, 255, 2223 CrossRef CAS.
- B. Guo, H. Nie, W. Yang, Y. Tian, J. Jing and X. Zhang, Sens. Actuators, B, 2016, 236, 459 CrossRef CAS.
- F. Tian, Y. Jia, Y. Zhang, W. Song, G. Zhao and Z. Qu, Biosens. Bioelectron., 2016, 86, 68 CrossRef CAS PubMed.
- Y. R. Zhang, Y. Liu, X. Feng and B. X. Zhao, Sens. Actuators, B, 2017, 240, 18 CrossRef CAS.
- J. Hua, X. Zhang, Y. Yan, Q. Peng, J. Wang and Y. Hang, Mater. Chem. Front., 2017, 1, 2292 RSC.
- Q. Xu, K. A. Lee, S. Lee, K. M. Lee, W. J. Lee and J. Yoon, J. Am. Chem. Soc., 2013, 135, 9944 CrossRef CAS PubMed.
- G. J. Song, H. L. Ma, J. Luo, X. Q. Cao and B. X. Zhao, Dyes Pigm., 2017, 148, 206 CrossRef.
- B. Zhu, P. Li, W. Shu, X. Wang, C. Liu, Y. Wang, Z. Wang, Y. Wang and B. Tang, Anal. Chem., 2016, 88, 12532 CrossRef CAS PubMed.
- X. Cheng, H. Jia, T. Long, J. Feng, J. Qin and Z. Li, Chem. Commun., 2011, 47, 11978 RSC.
- Y. Y. Li, X. Tang, L. Ni, L. Wang and M. M. Gao, Talanta, 2016, 847 Search PubMed.
- Q. M. Wang, L. Jin, W. L. Wan, L. H. Dai, X. X. Tan and C. Zhao, Spectrochim. Acta, Part A, 2019, 211, 239 CrossRef CAS PubMed.
- H. Z. Ni, Q. M. Wang, L. Jin, W. L. Wang, L. H. Dai and C. Zhao, J. Lumin., 2019, 206, 125 CrossRef CAS.
- P. Y. Ma, B. Zhang, Q. Q. Diao, L. Li, Y. Sun, X. H. Wang and D. Q. Song, Sens. Actuators, B, 2016, 233, 639 CrossRef CAS.
- D. S. Ranade, A. M. Bapat, S. N. Ramteke, B. N. Joshi, P. Roussel., A. Tomas, P. Deschamps and P. P. Kulkarni, Eur. J. Med. Chem., 2016, 121, 803 CrossRef CAS PubMed.
- G. He, J. Li, Z. Wang, C. Liu, X. Liu, L. Ji, C. Xie and Q. Wang, Tetrahedron, 2017, 73(3), 272 CrossRef CAS.
- J. Chen, W. Liu, H. Xu, J. Wu, X. Tang, Z. Fan and P. Wang, J. Org. Chem., 2012, 77(7), 3475 CrossRef CAS PubMed.
Footnote |
| † Electronic supplementary information (ESI) available. See DOI: 10.1039/c9ra01457h |
| This journal is © The Royal Society of Chemistry 2019 |


