
 Open Access Article
 This Open Access Article is licensed under a Creative Commons Attribution-Non Commercial 3.0 Unported Licence
The effects of additions of two-dimensional graphitic-C3N4 on the negative electro-caloric effects in P(VDF-TrFE) copolymers
Sana Ullaha,
Hao Wangb,
Bin Liu c,
Junye Cheng*c,
Guangcun Shan*d and
Guang-Ping Zheng*a
c,
Junye Cheng*c,
Guangcun Shan*d and
Guang-Ping Zheng*a
aDepartment of Mechanical Engineering, The Hong Kong Polytechnic University, Hung Hom, Kowloon, Hong Kong, China. E-mail: mmzheng@polyu.edu.hk
bGuangdong Provincial Key Laboratory of Micro/Nano Optomechatronics Engineering, College of Mechatronics and Control Engineering, Shenzhen University, Shenzhen 518060, China
cCenter of Super-Diamond and Advanced Films, Department of Materials Science and Engineering, City University of Hong Kong, Hong Kong 999077, China. E-mail: jycheng4-c@my.cityu.edu.hk
dSchool of Instrument Science and Opto-electronics Engineering, Beihang University, No. 37 XueYuan Road, Beijing 100083, China. E-mail: gcshan@buaa.edu.cn
First published on 21st May 2019
Abstract
In order to enhance and tune the electrocaloric effect (ECE) and ferroelectric responses, nanocomposites containing ferroelectric copolymer poly(vinylidene fluoride trifluoroethylene) and two-dimensional (2D) graphitic-C3N4 (g-C3N4) are synthesized. The effects of g-C3N4 on the ferroelectric-to-paraelectric phase transition of the copolymer are investigated by the differential scanning calorimetry (DSC), P–E hysteresis loop and dielectric spectrum measurements. The results indicate that the addition of 2D g-C3N4 in the ferroelectric copolymer is an effective approach in enhancing its dielectric and ferroelectric properties. Furthermore, the nanocomposites show the maximum absolute value of negative electrocaloric effect (ECE) of 5.4 K at 322 K under an electric field of 0.45 MV cm−1, which is much better than that of pristine copolymer. The negative ECE of the nanocomposites can be well explained by the Kauzmann theory. The low cost and enhanced negative ferroelectric properties of P(VDF-TrFE) make them more feasible over ceramics materials such as lead zirconate titanate (PZT) based ferroelectrics for applications in electrocaloric refrigeration.
1. Introduction
Polyvinylidene fluoride (PVDF) and copolymer poly(vinylidene fluoride trifluoroethylene), i.e., P(VDF-TrFE), have attracted great attention due to their ferroelectric, pyroelectric and piezoelectric properties.1 The piezo-, pyro- and ferro-electric properties of PVDF and P(VDF-TrFE) lead to their outstanding technological applications in infrared detection,2,3 sensor and actuators,4,5 and infrared imaging,2,6,7 while their flexibility, convenience in processing and ferroelectric properties make them more feasible over ceramics materials such as lead zirconate titanate (PZT) based ferroelectrics for practical applications. PVDF shows α, β, γ or δ crystalline phases depending on processing conditions.7–9 The polar β-phase is of technological importance due to its ferroelectric properties. The β-phase of PVDF can be achieved by annealing or by mechanical stretching and electrical poling.10 In the P(VDF-TrFE) copolymer the crystal defects in the PVDF can be reduced by the addition of fluorine atoms, leading to the increased crystallinity of the copolymer.11 The copolymer P(VDF-TrFE) can crystallize with the same chain conformation as the β-PVDF,12 if the content of TrFE is more than 18%. The ferroelectric properties of P(VDF-TrFE) is much better than those of PVDF due to the existence of intrinsic β-phase in P(VDF-TrFE).12Electrocaloric effect (ECE) is the adiabatic temperature change or in another terms it is the change in the isothermal entropy of the dielectric material with the support of an application or withdrawal of an electric field, which is first study in 1930.13 In conventional ferroelectrics the net polarization increases with the application of an electric field or decreases with increasing working temperature, leading to the conventional ECE; whereas recently some ferroelectric ceramics and nanocomposites are found to exhibit a negative ECE. Due to the negative ECE, the dipolar disorder increases and causes the ferroelectric material to absorb more heat by the application of an external electric field,14,15 also manifesting itself by the increased polarization with increasing temperature. Combined with conventional ECE, the negative ECE provides with us viable routes to implement EC refrigeration, which is much desirable for energy-efficient, environmental-friendly and solid-state refrigeration especially in the cooling of microelectronics. However, the strength of negative ECE is much smaller than that of conventional ECE. Taking P(VDF-TrFE) thick films as examples, the strength of negative ECE is less than 2.0 °C (MV cm−1)−1, while that of conventional ECE can be as high as 15 °C (MV cm−1)−1.
Through the introduction of nano-fillers into the copolymer matrix,16,17 the ferroelectric and piezoelectric properties of the resulting nanocomposites are dramatically enhanced. The nano-filler in the matrix enhanced the piezoelectric, ferroelectric and mechanical properties of the nanocomposite as compared with those of the host materials.18,19 The enhanced ferroelectric properties of P(VDF-TrFE)-based nanocomposite offer many advantages. For examples, huge conventional ECE at room temperature is reported for the nanocomposites.20,21 High dielectric constants of the nanocomposites result in high breakdown strength.22 The additions of ceramic nano-fillers into the P(VDF-TrFE) matrix are reported to exhibit ultra-high energy density for electrical energy storage.23–25 Nonetheless, there is few report on enhancing the negative ECE in P(VDF-TrFE)-based nanocomposites.
In this work, two-dimensional (2D) graphitic-C3N4 (g-C3N4) nano-fillers are introduced into P(VDF-TrFE) copolymer to improve its dielectric and ferroelectric properties. To the best of our knowledge, it is the first time that 2D g-C3N4 are used as nano-fillers in the P(VDF-TrFE)-based nanocomposites. The nanocomposites with various contents of g-C3N4 are characterized by different techniques such as FTIR, XRD, PFM and SEM, and the differential scanning calorimetry (DSC) is employed to explore the effects of g-C3N4 on the ferroelectric-to-paraelectric (FE-to-PE) phase transition and the kinetics of crystallization process in the nanocomposites. The enhanced dielectric and negative electrocaloric effects of the nanocomposites are investigated, and the effects of 2D g-C3N4 on those properties are discussed. More importantly, the mechanisms of negative ECE in the nanocomposites are elucidated from the experimental results.
2. Experimental methods
The g-C3N4 powders were prepared by the calcination of melamine in a muffle furnace at 600 °C in air. The powders were then mixed with HNO3 and deionized water and were sonicated to form suspensions. The mixture solution was centrifuged to form g-C3N4 nanosheets, which were finally washed and dried to obtain g-C3N4 nano-powders. The nanocomposites containing P(VDF-TrFE) and g-C3N4 were prepared by adding 0.3 grams of copolymer [P(VDF-TrFE)-52/48 mol%, Piezotech, France] into the 5 grams of N,N-dimethylformamide (DMF) solvent. The solution was kept for 24 hours under magnetic stirring to dissolve the P(VDF-TrFE) powders completely. Subsequently, different amounts of g-C3N4 nano-powders were added in the resultant solution which was kept at 60 °C for 24 hours. The thick films of P(VDF-TrFE)/g-C3N4 nanocomposites with various contents of g-C3N4 (15–50 wt%) were obtained by tape casting on a copper substrate and were dried in an oven at 70 °C. The film thickness was 30–100 μm.The X-ray diffraction (XRD) patterns of the samples was obtained by Rigaku Smart Lab diffractometer operated at 45 kV and 200 mA using Cu Kα radiation (λ = 0.154 nm). The analysis on vibrations of molecule bonds in the samples was carried out by a Fourier-transform infrared spectrometer (FT-IR, Nicolet iS50). The microstructures of nanocomposite were analyzed by scanning transmission electron microscopy (STEM, Jeol JEM-2100F), piezoelectric force microscopy (PFM, Asylum MFP-3D Infinity) and scanning electron microscopy (SEM, TESCAN, VEGA3). The thermal analyses on the samples (mass of 20 mg) were performed in a differential scanning calorimetry (DSC, TA Instruments Q200) with a heating or cooling rate of 5 °C min−1 from 20 to 180 °C. The samples were coated with silver paste on the bottom and top surfaces as the electrodes for the measurement of temperature-dependent dielectric spectrum, which was performed on an LCR meter (Agilent 4287A). The temperature-dependent polarization–electric field (P–E) loops of the nanocomposite samples was obtained by a ferroelectric test system (TF Analyzer 2000E, aixACCT) at 30 to 65 °C. The frequency of the applied electric field was 10 Hz.
3. Results and discussion
3.1 Characterization
The XRD patterns for P(VDF-TrFE) and P(VDF-TrFE)/g-C3N4 are shown in Fig. 1. Two sharp peaks at 18.56° and 19° are associated with the {110} and {200} planes of the α and β phases of P(VDF-TrFE), respectively.24 The two prominent peaks at 13.04° and 27.51° indexed as (100) and (002) are related with the in-plane structural packing motif units and the interlayer stacking of aromatic of tri-s-triazine segments in g-C3N4, respectively.26,27 In the XRD patterns for the nanocomposite, there is a broad peak related with the α-phase and β-phase in P(VDF-TrFE) and the peak intensity decreases gradually with increasing content of g-C3N4, suggesting the strong interaction between g-C3N4 and the copolymer, as shown in Fig. 1(b). The peak is located at 2θ = 18.79°, which is close to that (2θ = 19°) for the β-phase. As shown in Fig. 1(c), the board peak for nanocomposite is analyzed and shows the de-convoluted peaks for α and β phases separately. The peak for β-phase of the nanocomposite can be found to locate at 2θ = 19°, which is the same as that of the matrix P(VDF-TrFE).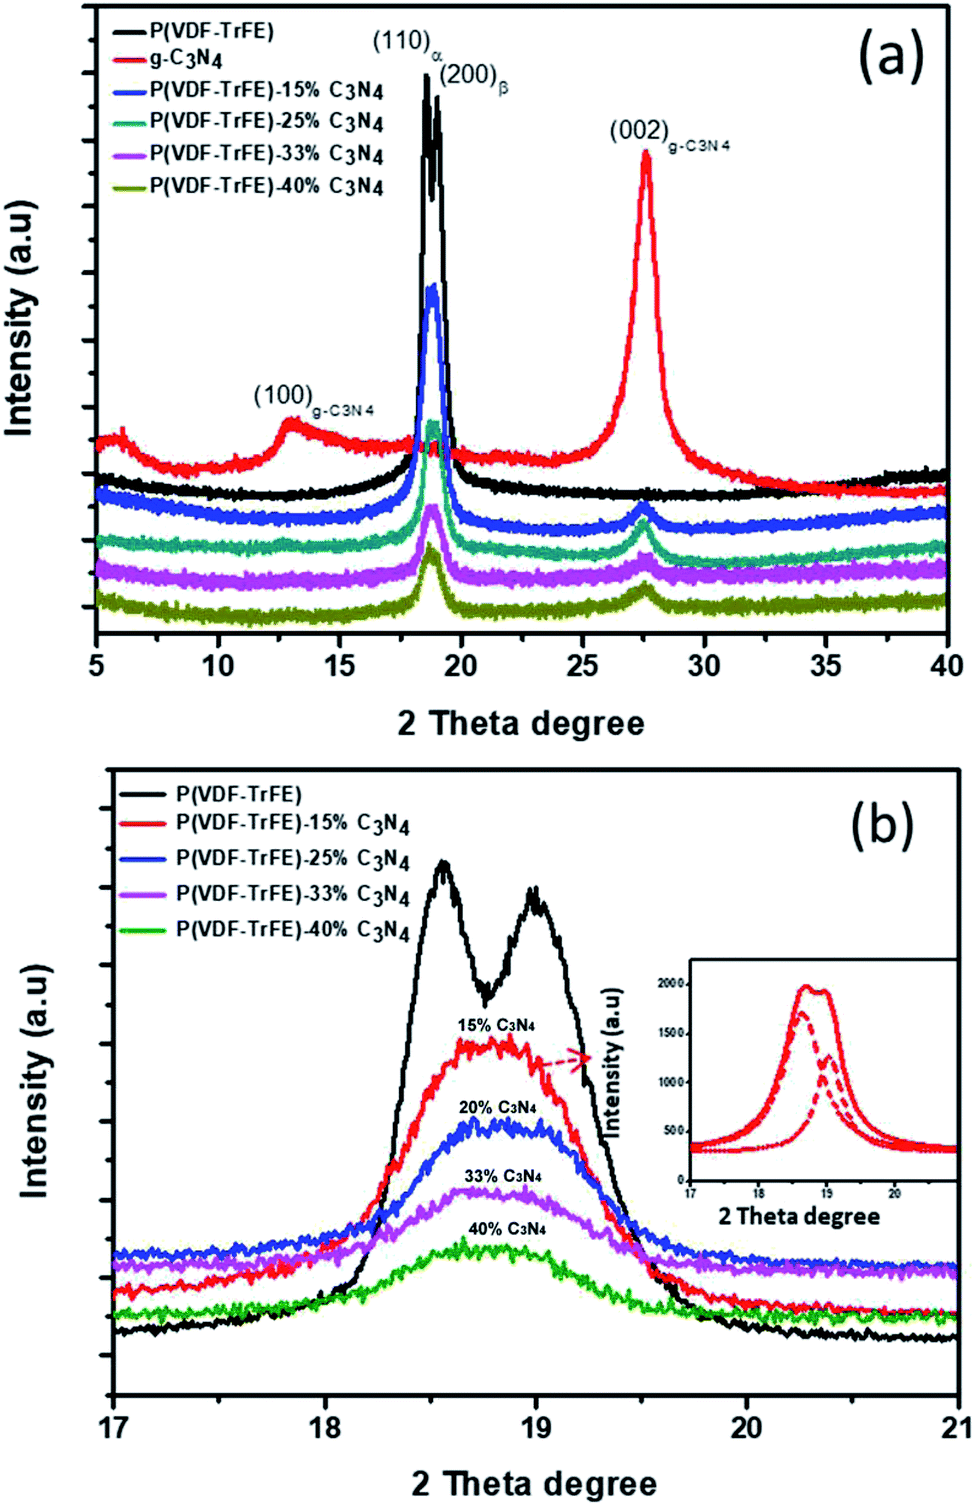 | ||
| Fig. 1 XRD patterns for g-C3N4, P(VDF-TrFE) and P(VDF-TrFE)/g-C3N4 nanocomposites (a), and enlarged XRD patterns in the range of 17° to 21° for P(VDF-TrFE) and nanocomposites (b). The inset in (b) shows the deconvolution of the main peak, corresponding to the peaks for α- and β-phase. | ||
The surface morphology and microstructure of the P(VDF-TrFE)/g-C3N4 nanocomposites are shown in Fig. 2 and 3. Typical PFM signals of surface morphology (height), piezoelectric amplitude and phase for the P(VDF-TrFE)/g-C3N4 nano-composites are shown in Fig. 2(a)–(c), respectively, suggesting the uniform distribution of g-C3N4 with sizes of 30–50 nm in the copolymer matrix. The AFM images of g-C3N4 and nanocomposites with 25 wt% g-C3N4 further reveal that the sizes of g-C3N4 nano-powder are as small as 20 nm, as shown in Fig. 3(a and b). The SEM images of copolymer and nanocomposites with 33 wt% g-C3N4 indicate the presence of pores in the copolymer (Fig. 3(c)), while the g-C3N4 nano-powders are uniformly distributed in the nanocomposites (Fig. 3(d)). Furthermore, the nanocomposite microstructure is investigated by STEM images, which reveals that the sizes of the nano-filler powder g-C3N4 are around 20–30 nm, as shown in Fig. 3(e and f), in consistent with those estimated from the PFM images in Fig. 2.
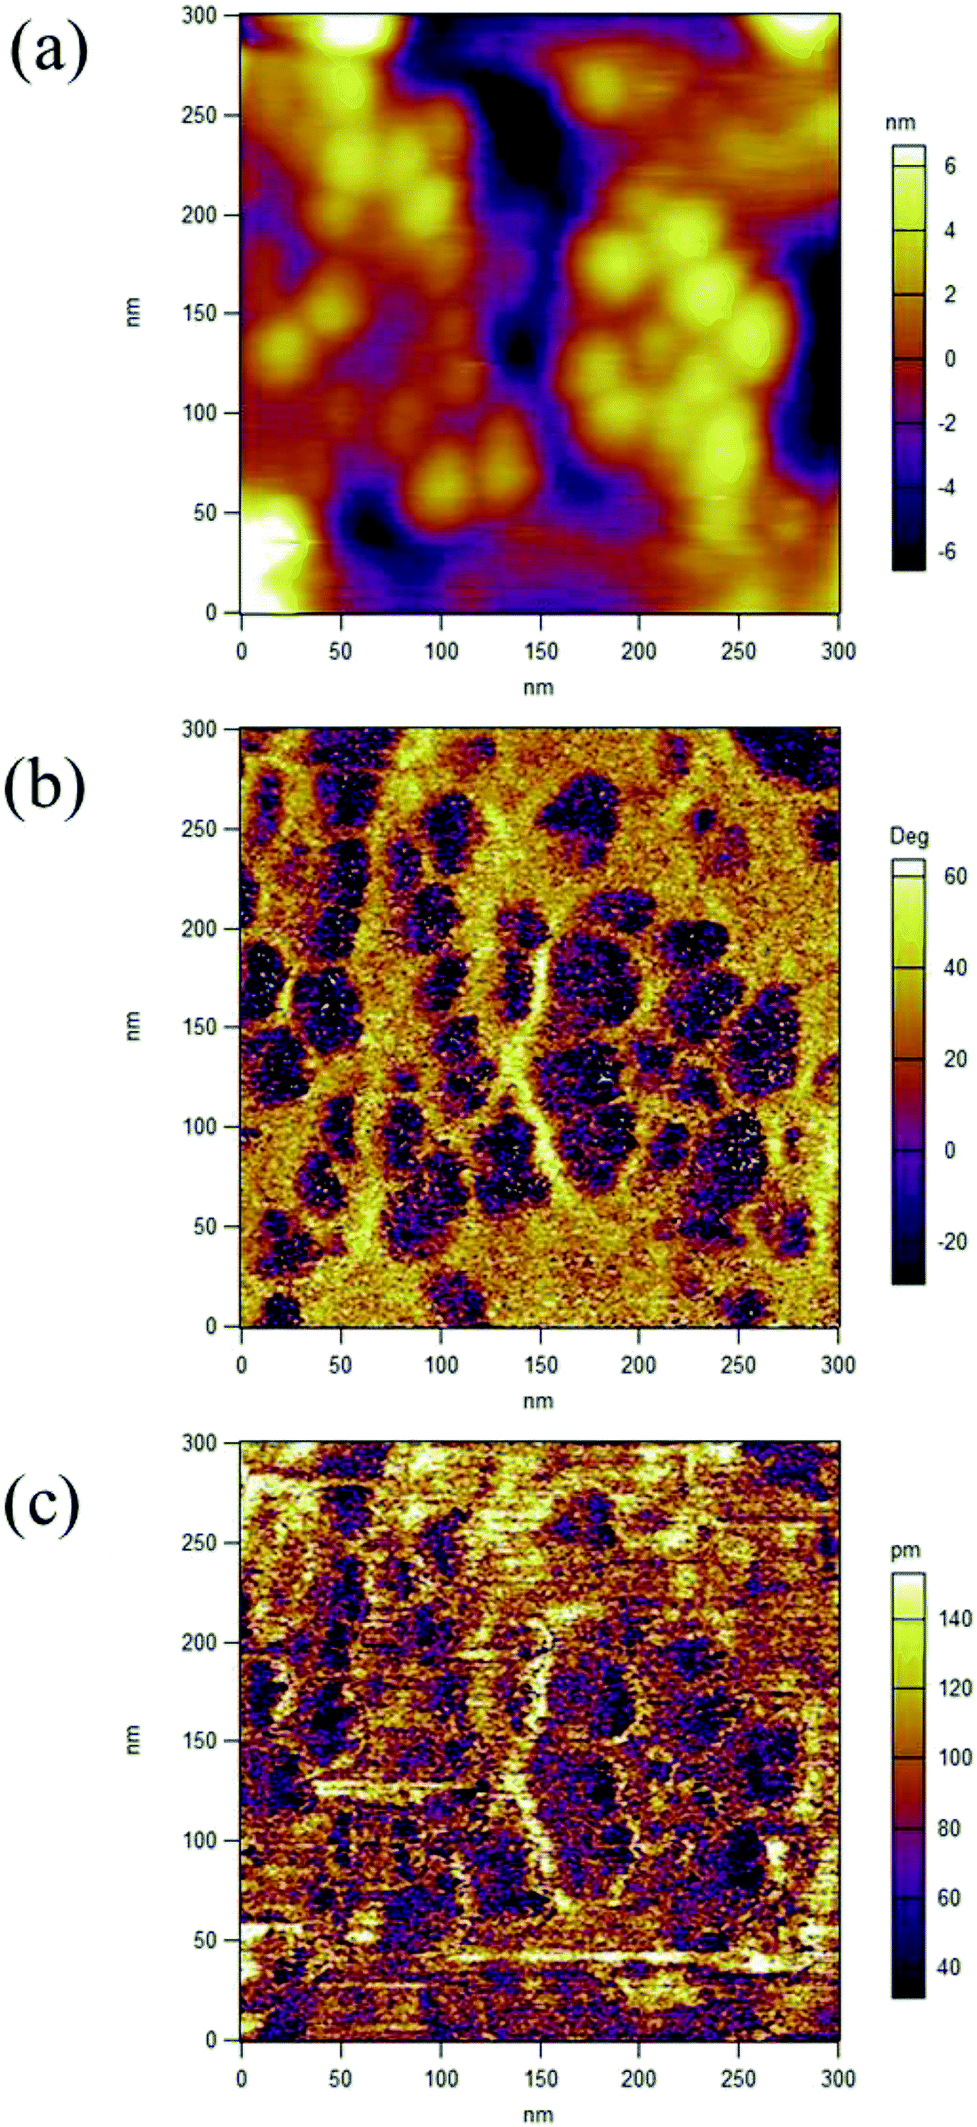 | ||
| Fig. 2 PFM signals of surface morphology (height) (a), piezoelectric amplitude (b) and phase (c) for P(VDF-TrFE)/g-C3N4, respectively. | ||
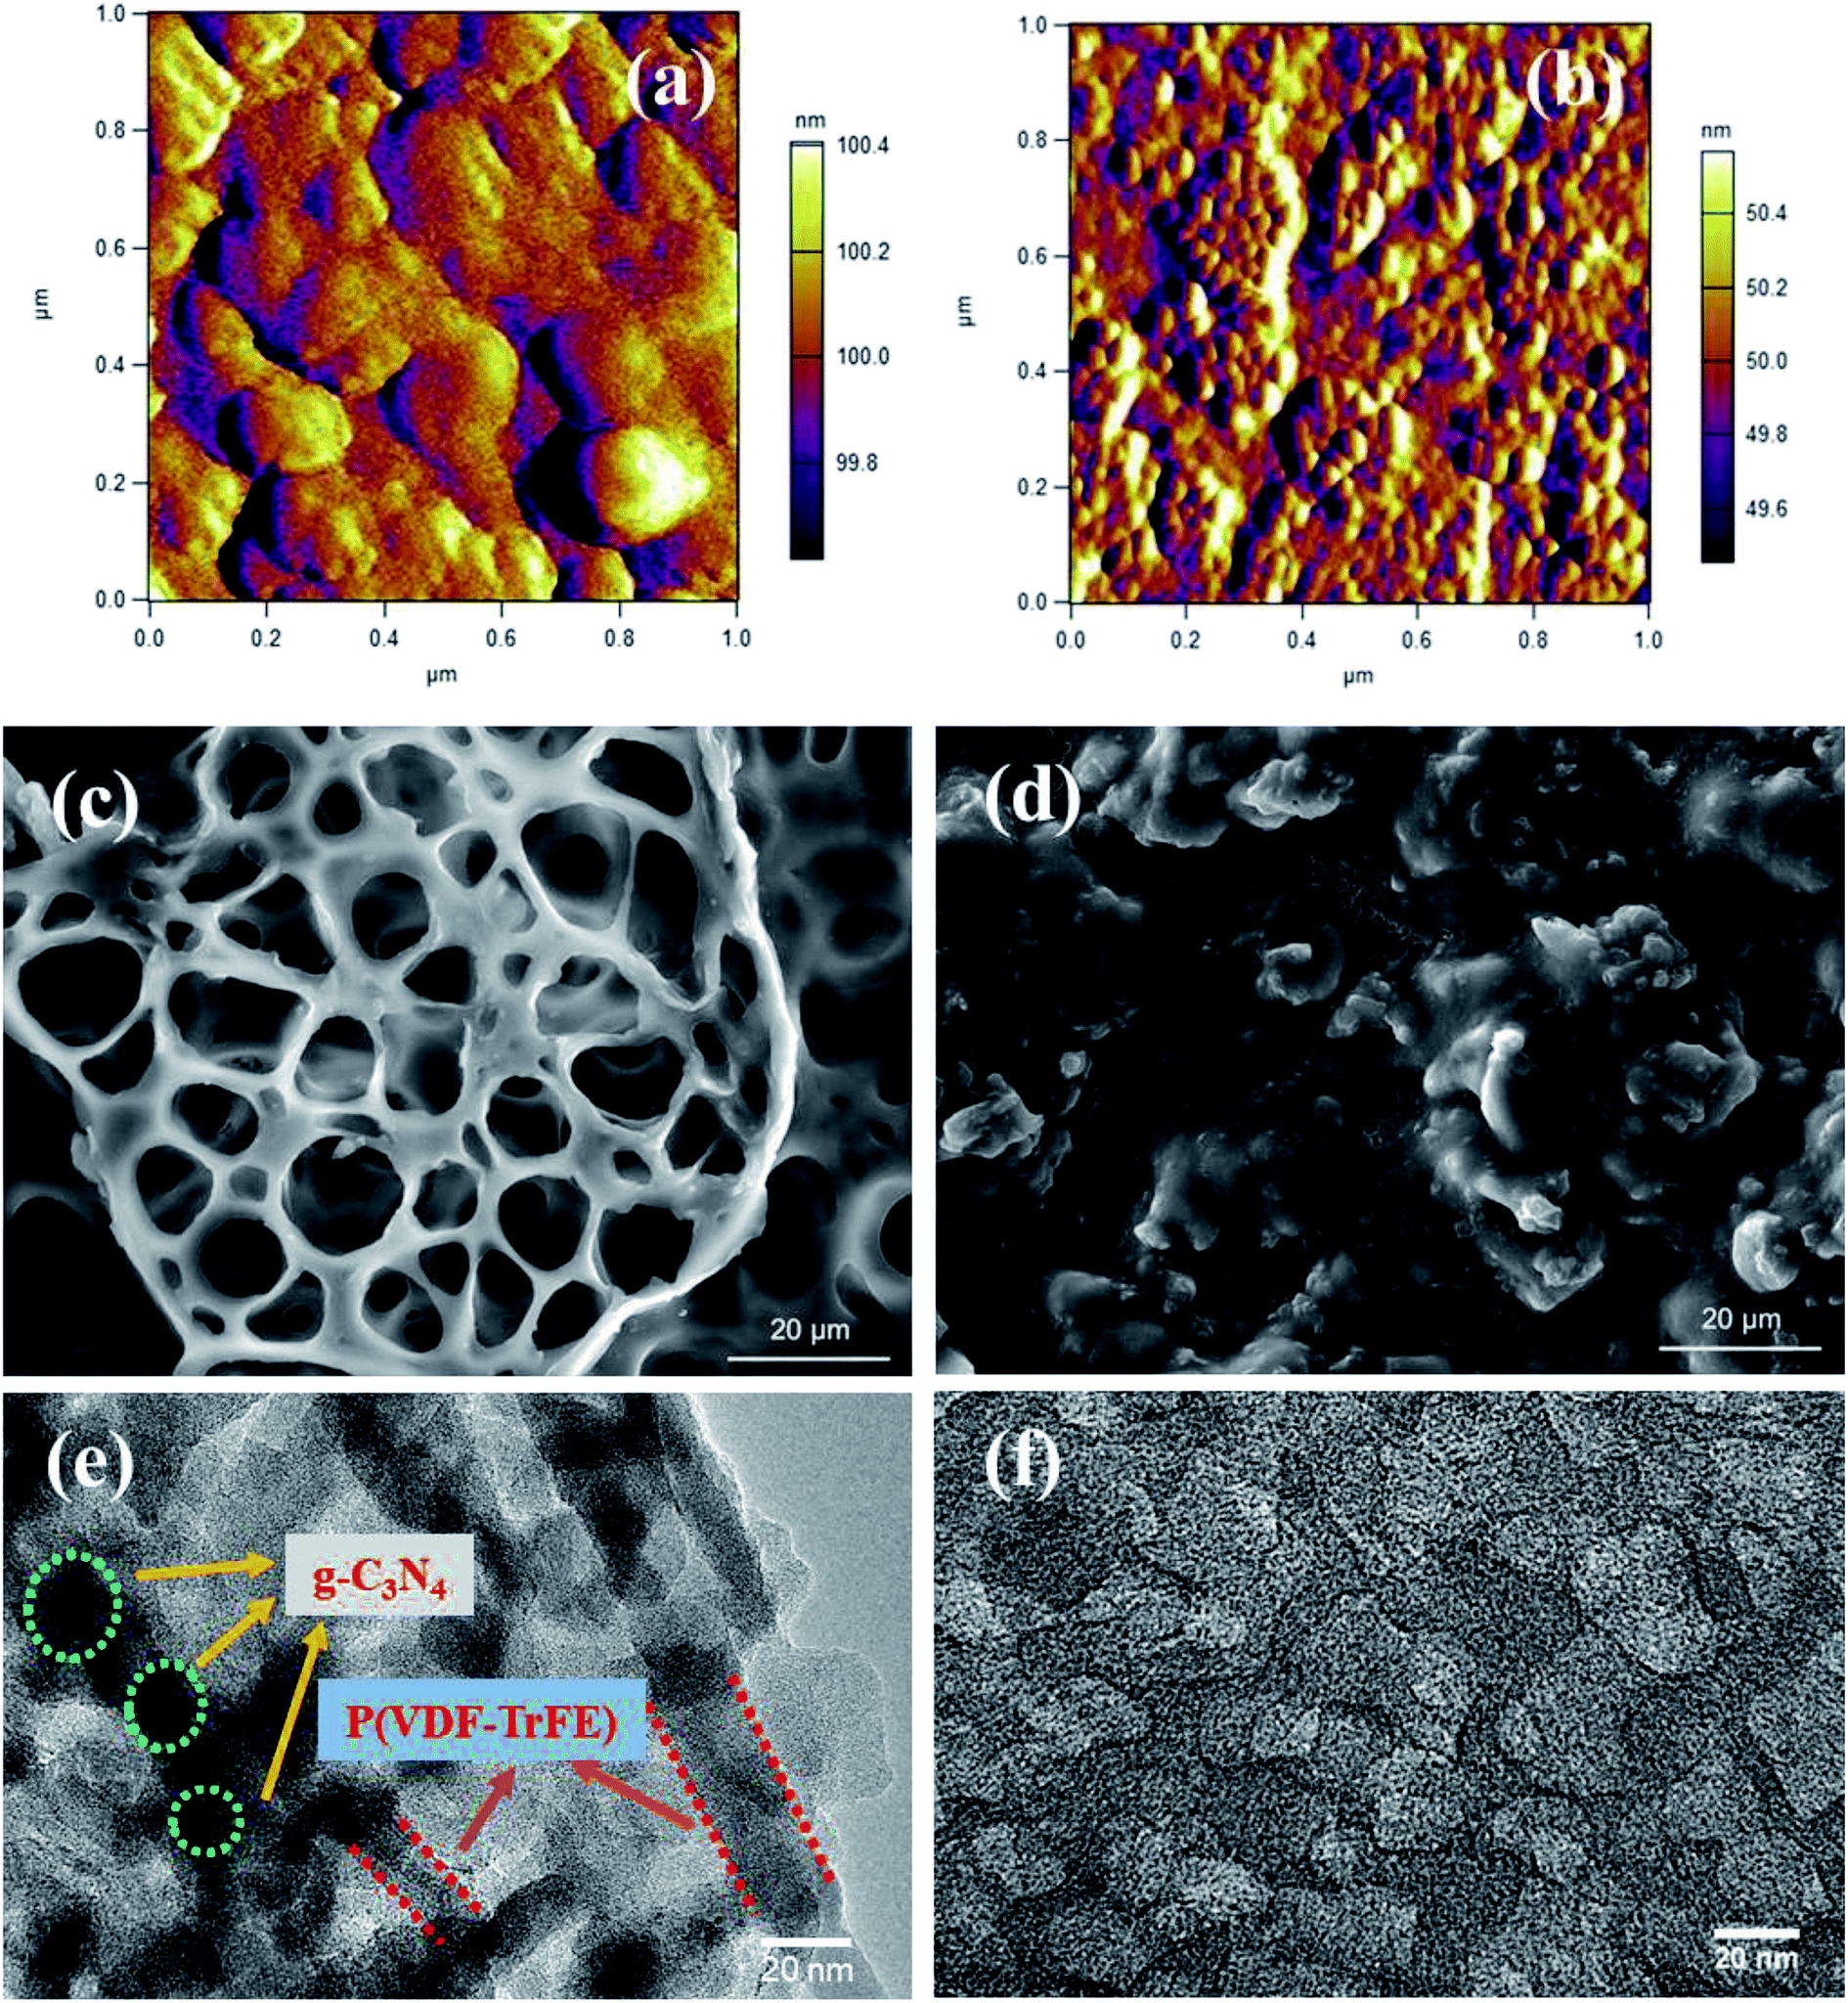 | ||
| Fig. 3 AFM images of the surface morphology of g-C3N4 (a), P(VDF-TrFE)/g-C3N4 (25 wt%) (b); and SEM images of P(VDF-TrFE) (c), P(VDF-TrFE)/g-C3N4 (33 wt%) (d); and STEM images of P(VDF-TrFE)/g-C3N4 nanocomposite at high magnifications (e and f). | ||
The effects of g-C3N4 on the phase transitions in P(VDF-TrFE) are revealed by thermal analyses on the nanocomposite. Fig. 4 shows the DSC results, suggesting that the ferroelectric-to-paraelectric phase transition and melting transition in P(VDF-TrFE) could be significantly affected by the additions of g-C3N4. As shown in Fig. 4(a and b), the FE-to-PE phase transition temperature Tc and the melting point Tm of the nanocomposites under heating exhibit maxima near a g-C3N4 content of about 25–33 wt%, while the latent heats of phase transitions decrease with increasing content of g-C3N4. It can be seen that Tc (at heating) could be increased by almost 2 °C from 61.38 °C to 63.24 °C, as shown in Fig. 4(c), demonstrating that the addition of less than 33 wt% g-C3N4 improves the content of β-phase of P(VDF-TrFE) in the nanocomposite.11,28 On the contrary, the crystallization temperature (Tm at cooling) of P(VDF-TrFE) is found to be increased from 139.21 °C to 145.38 °C as shown in Fig. 4(d), suggesting that the degree of crystallization of the nanocomposite is increased by introducing g-C3N4 nano-powders in the P(VDF-TrFE) matrix.29
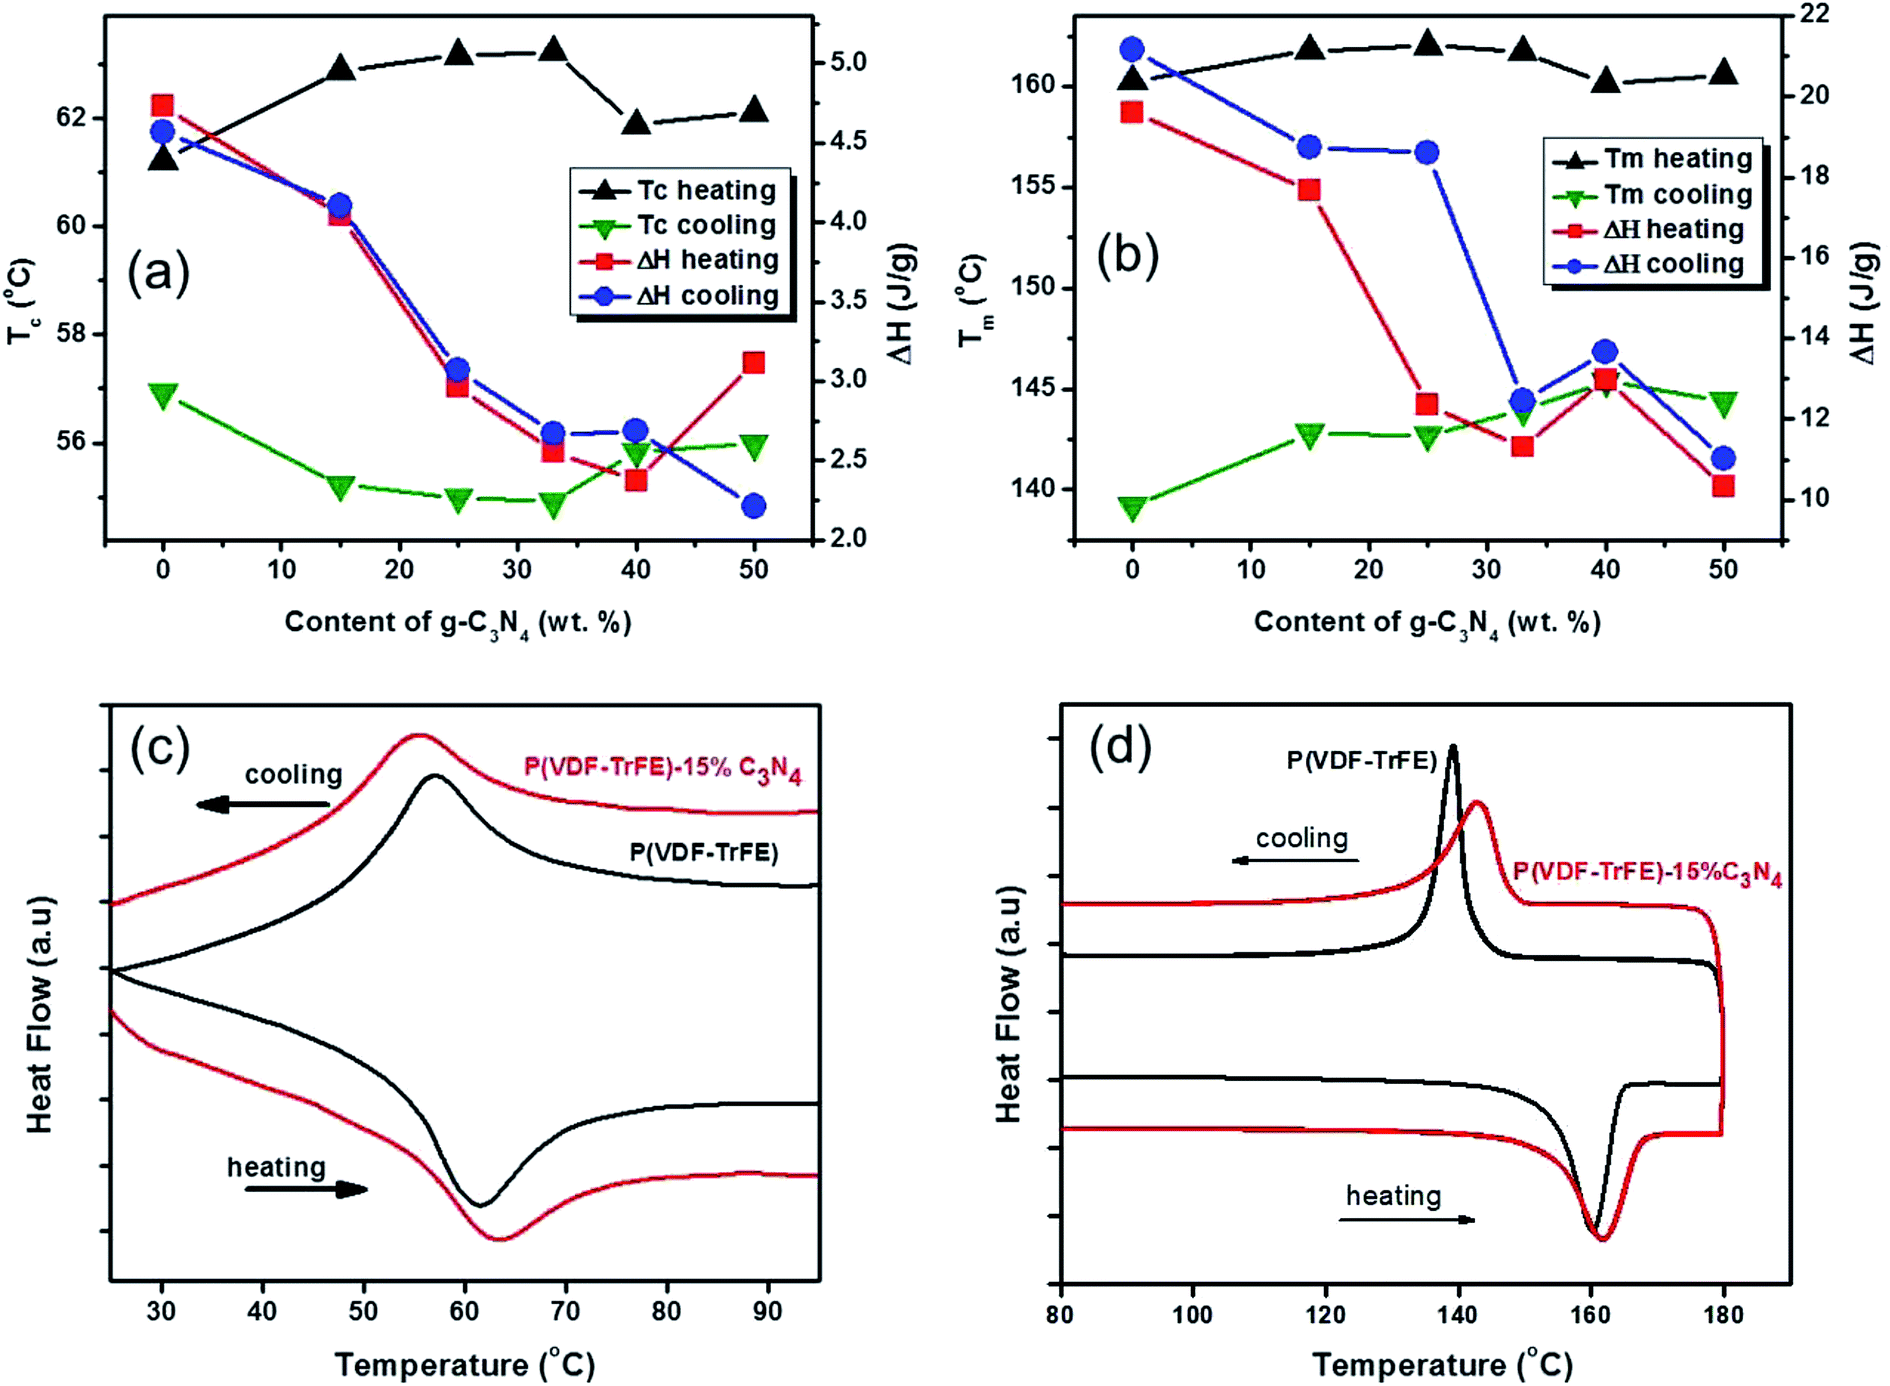 | ||
| Fig. 4 The FE-to-PE transition temperature Tc (a), and melting or crystallization temperature Tm (b) vs. content of g-C3N4. Typical DSC heat flow close to Tc (c), and Tm (d), with a temperature varying rate of 5 °C min−1. | ||
In order to analyze the kinetics of crystallization in the nanocomposites, the samples are first heated to 180 °C well above the melting point and kept for 20 minutes, and then cooled down rapidly with a cooling rate of 80 °C min−1 to a crystallization temperature (between 130 °C and 155 °C) close to the melting point of the samples. The samples are held for 20 minutes at the crystallization temperature. The crystallization fraction χ(t) of the samples are determined by the following equation30
 | (1) |
log[−ln(1 − x)] = log![[thin space (1/6-em)]](https://www.rsc.org/images/entities/char_2009.gif) Z + nlogt, Z + nlogt,
| (2) |
Similar procedures are applied to analyze the kinetics of FE-to-PE transition, while the temperature for the isothermal DSC analysis should be below Tc and χ(t) represents the fraction of polar β phase in P(VDF-TrFE). The isothermal FE-to-PE transition and crystallization processes are characterized by fitting χ(t) using eqn (2), as shown in Fig. 5. The Avrami exponents n for the nanocomposites with different contents of g-C3N4 are listed in Table 1. It can be seen that the values of exponents n for P(VDF-TrFE) and P(VDF-TrFE)/g-C3N4 are almost one, revealing that P(VDF-TrFE) and the nanocomposites could exhibit one-dimensional kinetics of phase transitions at Tc and Tm.
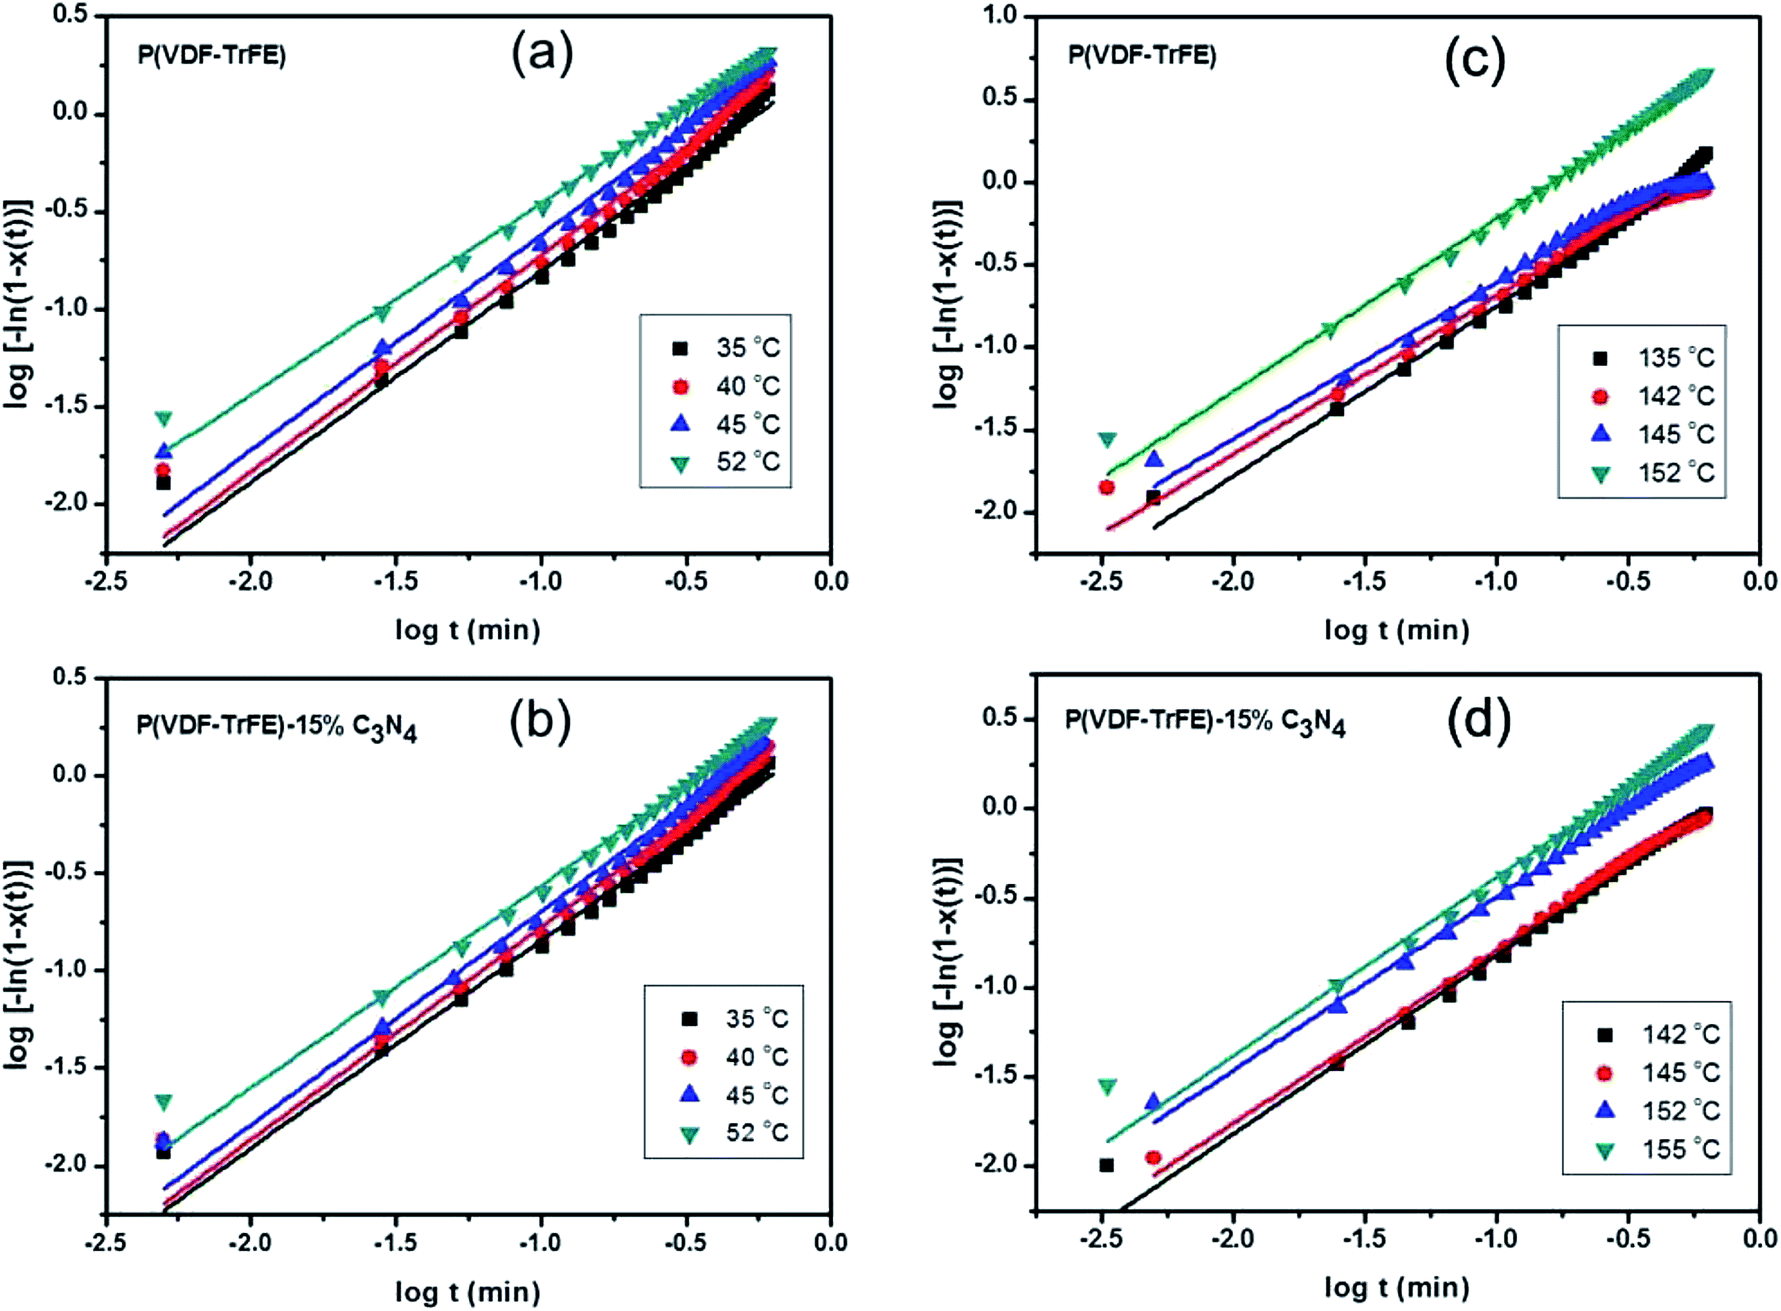 | ||
| Fig. 5 The fitting of the phase transition fraction χ(t) close to Tc for P(VDF-TrFE) (a), and P(VDF-TrFE)/15 wt% g-C3N4 (b); and the fitting of the crystallization fraction χ(t) close to Tm for P(VDF-TrFE) (c), and P(VDF-TrFE)/g-C3N4(15 wt%) (d), based on the Avrami equation. | ||
| wt% g-C3N4 | 0 | 15 | 25 | 33 | 40 | 50 | |
| n0 | 40 °C | 1.1742 | 1.1525 | 1.1366 | 1.1615 | 1.2278 | 1.1751 |
| 45 °C | 0.9186 | 1.0568 | 0.9766 | 1.1918 | 1.2390 | 1.0102 | |
| n1 | 142 °C | 1.0187 | 0.9701 | 1.0518 | 1.1615 | 1.1210 | 1.0365 |
| 148 °C | 1.062 | 0.868 | 0.9821 | 1.1918 | 1.0043 | 0.9522 | |
The interactions between P(VDF-TrFE) and g-C3N4 in the nanocomposites are further investigated by FT-IR spectroscopy. As shown in Fig. 6(a), for g-C3N4, the broad peaks centered at 3170 cm−1 in the spectra shown are attributed to the N–H stretching vibration mode34 while the sharp peaks at 1234 cm−1, 1317 cm−1 and 1400 cm−1 are assigned to the C–N stretching vibration mode.35 The peak at 804 cm−1 corresponds to the breathing mode of triazine system.36 The three intense bands for β-phase of P(VDF-TrFE) are represented at 847 cm−1, 1285 cm−1 and 1400 cm−1 in the FT-IR spectra as shown in Fig. 6(b). The absorption band at 1400 cm−1 is assigned to the wagging vibration of CH2 (ref. 37 and 38) and the bands at 847 cm−1 and 1287 cm−1 are attributed to CF2 due to the symmetric stretching mode.39 The band around 2920 cm−1 represent symmetric stretching while the band around 2969 cm−1 represent asymmetrical stretching of CH2.40 For the nanocomposites containing P(VDF-TrFE) and g-C3N4, as shown in Fig. 6(b), the β-phase bands for P(VDF-TrFE) are enhanced by adding nano-fillers to the nanocomposite while a sharp peak at about 804 cm−1 representing the presence of g-C3N4 can be observed. The result reveals that β-phase content of the nanocomposite increases with increasing content of g-C3N4. Furthermore, it is believed that the strong interaction exists between C–H molecules of the P(VDF-TrFE) and the NH2 molecules of g-C3N4 because of the formation of NH3 as reported in ref. 41 and shown in Fig. 6(b) (inset), manifesting itself by the peaks at 3357 cm−1 and 3395 cm−1 for P(VDF-TrFE)-15% C3N4.
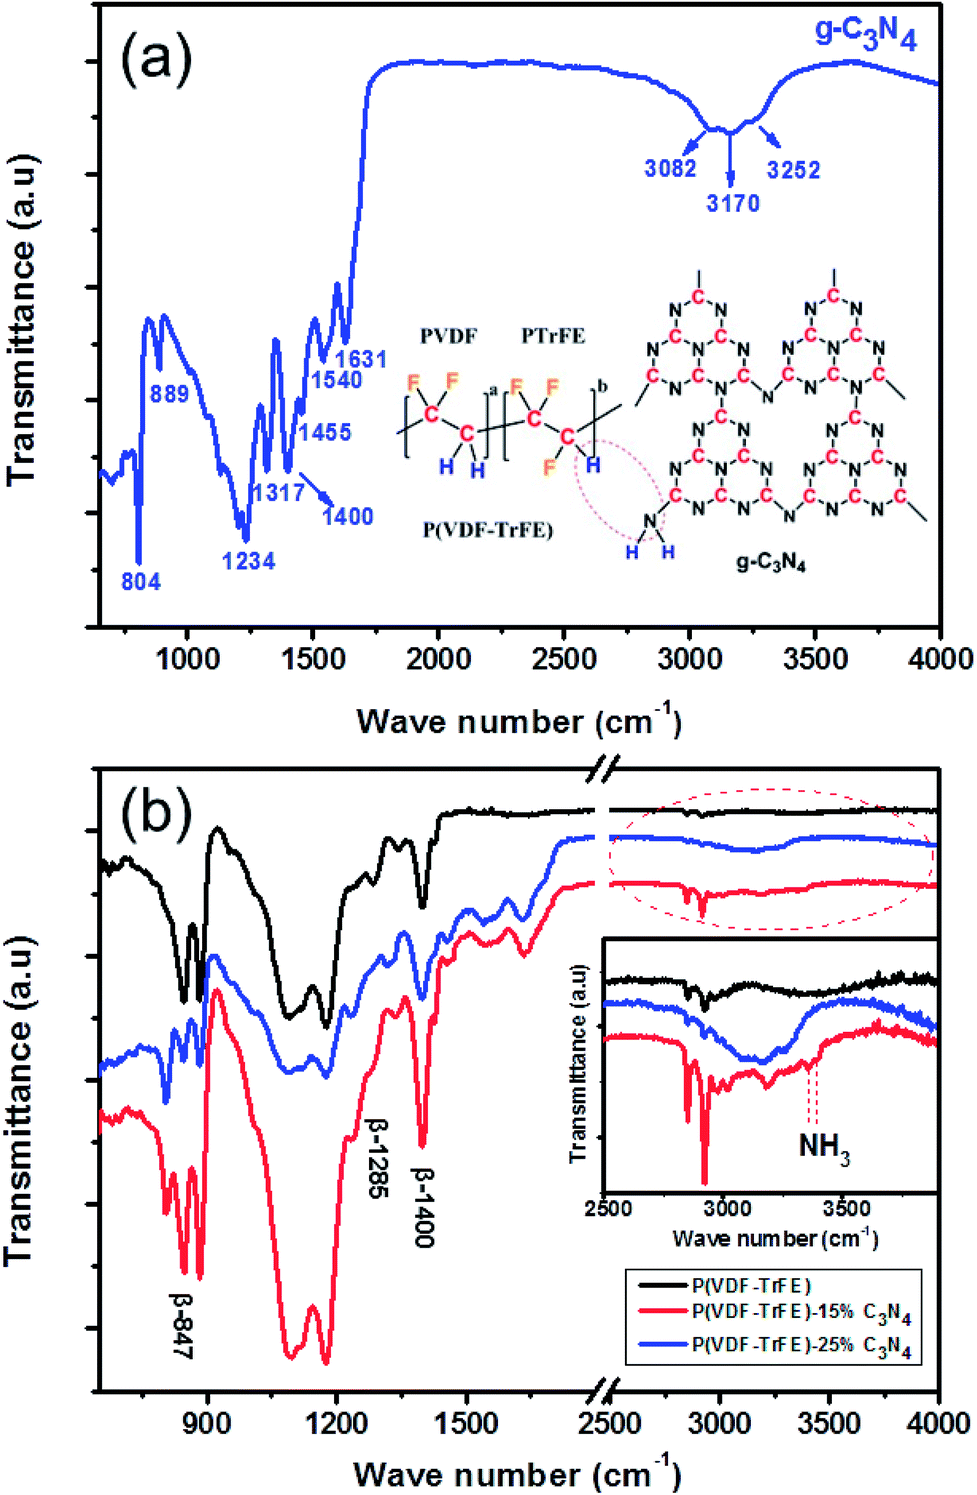 | ||
| Fig. 6 FT-IR spectra for g-C3N4 (a), P(VDF-TrFE) and the nanocomposites with different contents of g-C3N4 (b). The inset in (a) and (b) shows the schematic of P(VDF-TrFE)/g-C3N4, and the zoom-in view of (b), respectively. | ||
The temperature-dependent dielectric constants of the P(VDF-TrFE) and nanocomposite P(VDF-TrFE)/g-C3N4 are characterized at different frequencies as shown in Fig. 7. The temperature-dependent permittivity for the pristine P(VDF-TrFE) and nanocomposite P(VDF-TrFE)-15% C3N4 at 100 kHz is shown in Fig. 7(a). By introducing the nanofillers, the permittivity of the nanocomposite is significantly increased as compared to the pristine P(VDF-TrFE). The enhanced dielectric permittivity of the nanocomposite could be related with its increased β-phase content as demonstrated by the DSC analysis and FT-IR spectroscopy, resulting in the improved polarization in the nanocomposite as compared with that in the pristine copolymer. The temperature-dependent permittivity of the nanocomposite at the frequencies ranging from 1 kHz to 2 MHz is shown in the Fig. 7(b). The broad peak around 70 °C is attributed to FE-to-PE phase transition and has typically relaxor behaviors characterized by the non-Arrhenius dielectric relaxation.
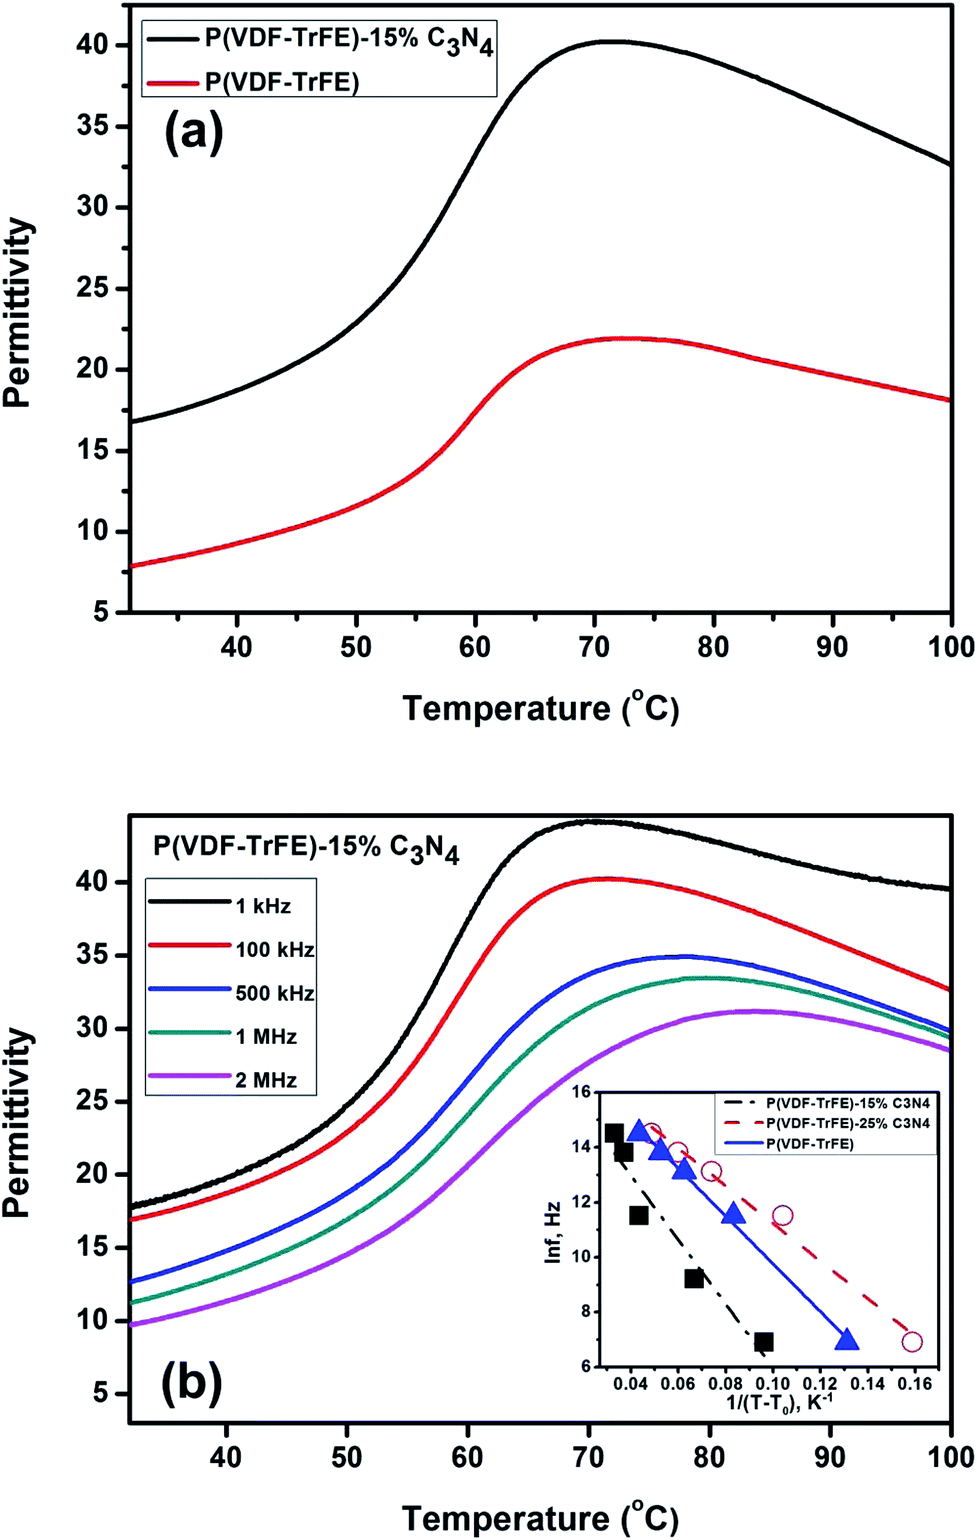 | ||
| Fig. 7 (a) The temperature-dependent permittivity of P(VDF-TrFE) and the P(VDF-TrFE)-15% C3N4 nanocomposites at 100 kHz (a); (b) the dielectric relaxation of P(VDF-TrFE)-15% C3N4 nanocomposite; the inset shows the VFT plots. | ||
3.2 Negative electro-caloric effects
The ferroelectric properties of the nanocomposite are further investigated by P–E loop measurements. The hysteresis loops form when the varying electric field is applied to the sample and the remnant polarization changes with the temperature. As shown in Fig. 8(a), the P–E loops of P(VDF-TrFE)-15% C3N4 nanocomposite show large response to the change of temperature at high electric fields. Adding the nano-powder of g-C3N4 into the ferroelectric P(VDF-TrFE) enhances the ferroelectric properties, consistent with that reported for nanocomposite P(VDF-TrFE)/BST.42 The electrocaloric temperature changes (ΔT) are calculated by thermodynamics Maxwell's equation as
 | (3) |
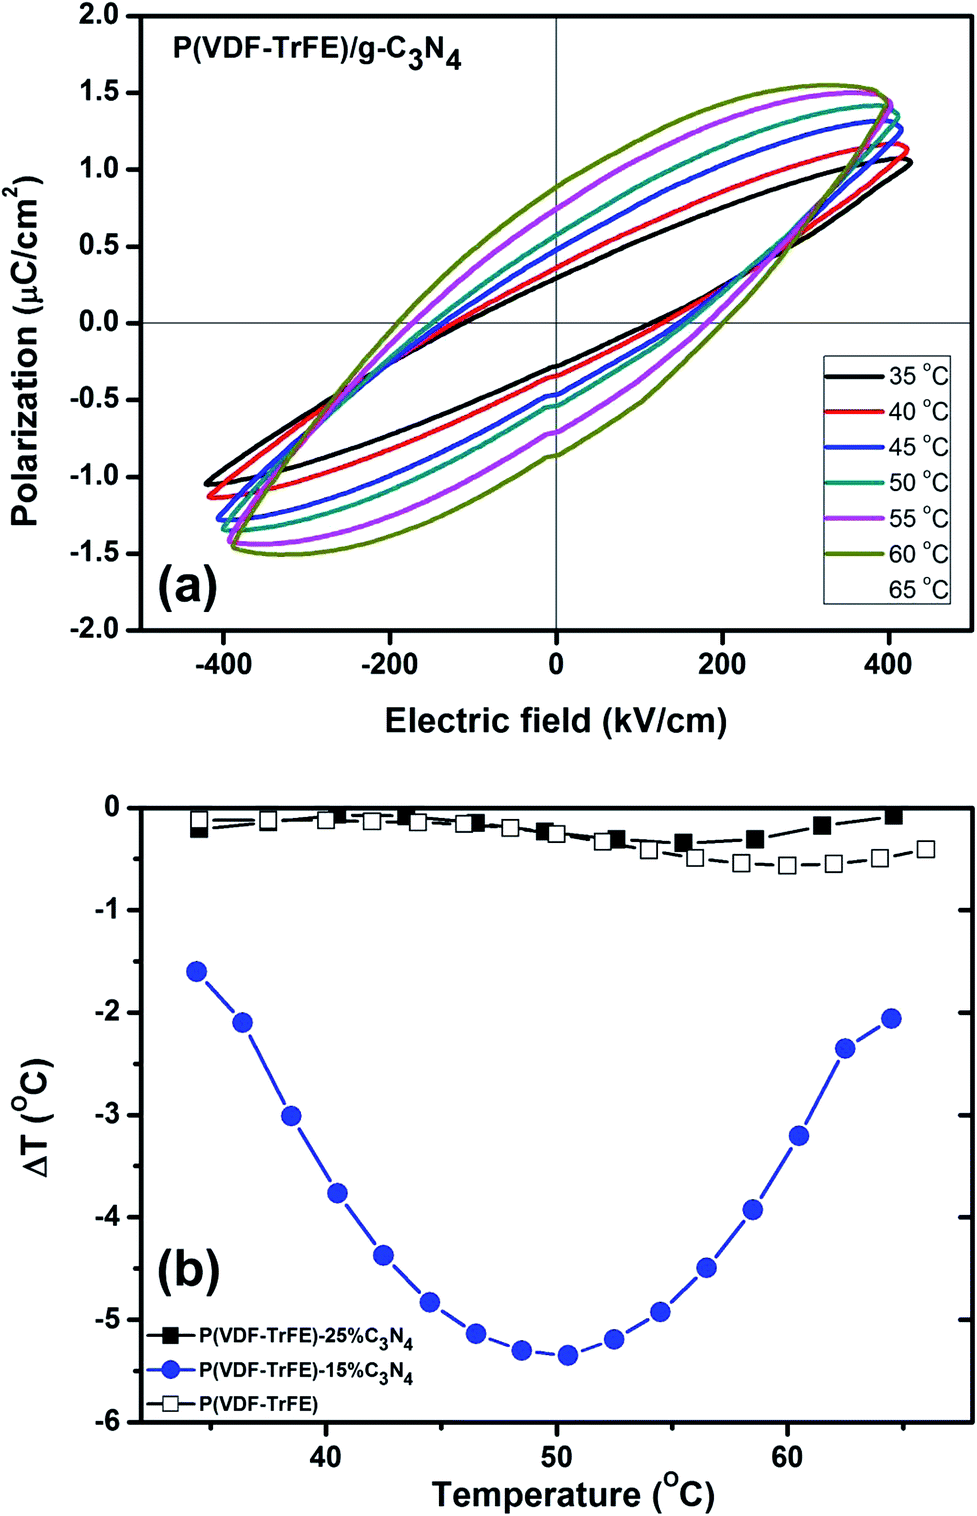 | ||
| Fig. 8 (a) Temperature-dependent P–E loops of P(VDF-TrFE)-15% C3N4 nanocomposite at different applied electric fields (320–400 kV cm−1). (b) The negative ECE temperature change ΔT versus T for copolymer and the nanocomposites P(VDF-TrFE)/g-C3N4 under an electric field of 450 kV cm−1. | ||
3.3 Discussion
As shown in Fig. 7(b), the dielectric relaxation close to the FE-to-PE transition shows typical relaxor characteristics, which could be characterized by the Vogel–Fulcher–Tammann (VFT) relation as follows:42| f = f0e−Ea/kB(T−T0), | (4) |
f versus 1/(T − T0) is shown in Fig. 7(b) (inset) for copolymer and nanocomposites. The apparent activation energy Ea = 0.01 eV (T0 = 60 °C) and Ea = 0.0058 eV (T0 = 60 °C) are determined for the nanocomposites with 15 wt% and 25 wt% g-C3N4, respectively. While for pure P(VDF-TrFE), Ea = 0.0075 eV with T0 = 60 °C is recorded. It could be found that T0 is very close to the Curie temperature Tc shown in Fig. 4(a).
It is worth noting that eqn (4) in the description of dielectric relaxation of the nanocomposite is derived from Kauzmann theory for glassy solids. The entropy S of a glassy solid is described as:44
| S = S0e−Ea/kB(T−T0), | (5) |
More importantly, the Kauzmann theory for negative ECE can well explain why the maximum (absolute) values of negative ECE for the P(VDF-TrFE)-15% C3N4 nanocomposite is the largest. Since the negative ECE in the nanocomposites could be related with their glassy states of the polar domains, based on eqn (4), the activation energy Ea that measures the energy barrier for the freezing of glassy polar domain structures with zero entropy S, can be used to measure the strength of negative ECE. For the nanocomposite with a larger Ea, the activation of its frozen glassy polar state (S = 0) by the applied electric fields could result in a higher entropy change. As a consequence, the negative ECE as measured by the absolute value of ECE temperature change, could increase with increasing Ea that measures the relaxation process of glassy polar domain structures. As shown in Fig. 7(b) (inset), the P(VDF-TrFE)-15% C3N4 nanocomposite has the largest Ea as compared with that of P(VDF-TrFE)-25% C3N4 or the pristine copolymer. Hence, the P(VDF-TrFE)-15% C3N4 nanocomposite has the largest negative ECE.
4. Conclusions
Nanocomposites containing P(VDF-TrFE) and g-C3N4 are prepared to improve the dielectric and ferroelectric properties of P(VDF-TrFE). The thermal analyses on the nanocomposites reveal that the degree of crystallization of P(VDF-TrFE) is enhanced by the addition of g-C3N4. Particularly, when the content of g-C3N4 is less than 33 wt%, the content of polar β phase in P(VDF-TrFE) increases with increasing content of g-C3N4 in the nanocomposites. The effects of g-C3N4 on the ferroelectric-to-paraelectric phase transition and the crystallization of P(VDF-TrFE) are attributed to the strong interaction between the NH2 groups in g-C3N4 and the CH groups in P(VDF-TrFE), which is revealed by the FT-IR spectroscopy. The negative ECE of nanocomposites can be well described by Kauzmann theory, and the absolute value of ECE temperature change of the nanocomposite is found to be maximized with 15 wt% addition of g-C3N4. The results suggest that the addition of g-C3N4 in the ferroelectric copolymer is an effective approach in improving its dielectric, ferroelectric and ECE properties.Conflicts of interest
There are no conflicts to declare.Acknowledgements
This work was supported by a grant from the Hong Kong Polytechnic University (No. G-YBW4), and National Key R&D Program of China (Grant No. 2016YFC1402504).References
- A. Navid, C. S. Lynch and L. Pilon, Smart Mater. Struct., 2010, 19, 1–13 CrossRef.
- N. Neumann, R. Köhler and G. Hofmann, Ferroelectrics, 1995, 171, 225–238 CrossRef CAS.
- S. A. Pullano, I. Mahbub, S. K. Islam and A. S. Fiorillo, Sensors, 2017, 17, 1–13 CrossRef PubMed.
- A. Pecora, L. Maiolo, F. Maita and A. Minotti, Sens. Actuators, A, 2012, 185, 39–43 CrossRef CAS.
- V. F. Cardoso, C. M. Costa, G. Minas and S. Lanceros-Mendez, Smart Mater. Struct., 2012, 21, 1–8 CrossRef.
- R. Köhler, N. Neumann and G. Hofmann, Sens. Actuators, A, 1994, 45, 209–218 CrossRef.
- H. S. Nalwa, J. Macromol. Sci., 1991, 31, 341–432 Search PubMed.
- P. Martins, A. C. Lopes and S. Lanceros-Mendez, Prog. Polym. Sci., 2014, 39, 683–706 CrossRef CAS.
- M. Li, H. J. Wondergem, M. J. Spijkman, K. Asadi, I. Katsouras, P. W. M. Blom and D. M. DeLeeuw, Nat. Mater., 2013, 12, 433–438 CrossRef CAS PubMed.
- A. Aliane, M. Benwadih, B. Bouthinon, R. Coppard, F. D. Santos and A. Daami, Org. Electron., 2015, 25, 92–98 CrossRef CAS.
- U. Valiyaneerilakkal, A. Singh, C. K. Subash, S. M. Abbas and S. Varghese, Polym. Compos., 2015, 38, 1655–1661 CrossRef.
- S. Fujisaki and H. I. Fujisaki, Appl. Phys. Lett., 2007, 90, 1–3 CrossRef.
- P. Kobeko and I. Kurchatov, Z. Phys., 1930, 66, 192–205 CrossRef CAS.
- Z. Jiang, G. P. Zheng and S. Ullah, Ceram. Int., 2018, 45, 2876–2880 CrossRef.
- W. Geng, Y. Liu, X. Meng, L. Bellaiche, J. F. Scott, B. Dkhil and A. Jiang, Adv. Mater., 2015, 27, 3165–3169 CrossRef CAS PubMed.
- Z. Dang, H. Wang, H. Xu and H. Wang, Appl. Phys. Lett., 2006, 89, 1–3 CrossRef.
- D. Gersappe, Phys. Rev. Lett., 2002, 89, 1–4 CrossRef PubMed.
- G. C. Psarras, K. G. Gatos, P. K. Karahaliou, S. N. Georga and C. A. Krontiras, eXPRESS Polym. Lett., 2007, 1, 837–845 CrossRef CAS.
- X. Z. Chen, X. Li, X. S. Qian, M. Lin, S. Wu, Q. D. Shen and Q. M. Zhang, Polymer, 2013, 54, 5299–5302 CrossRef CAS.
- G. Zhang, Q. Li, H. Gu, S. Jiang, K. Han, M. R. Gadinski, M. A. Haque, Q. Zhang and Q. Wang, Adv. Mater., 2015, 27, 1450–1454 CrossRef CAS PubMed.
- W. Wu, X. Huang, S. Li, P. Jiang and T. Toshikatsu, J. Phys. Chem., 2012, 116, 24887–24895 CAS.
- Q. Wang and L. Zhu, J. Polym. Sci., Part B: Polym. Phys., 2011, 49, 1421–1429 CrossRef CAS.
- S. Adireddy, V. S. Puli, T. J. Lou and D. B. Chrisey, J. Sol-Gel Sci. Technol., 2015, 73, 641–646 CrossRef CAS.
- J.-H. Lee, K. Y. Lee, B. Kumar, N. T. Tien, N.-E. Lee and S.-W. Kim, Energy Environ. Sci., 2013, 6, 169–175 RSC.
- B. Yu and B. Wang, Composites, Part B, 2017, 79, 277–284 Search PubMed.
- L. Qiu, J. Mater. Chem. A, 2013, 1, 3008–3015 RSC.
- B. Yuan, Z. Chu, G. Li, Z. Jiang, T. Hu, Q. Wang and C. Wang, J. Mater. Chem. C, 2014, 2, 8212–8215 RSC.
- T. Feng, D. Xie, Y. Zang, X. Wu, T. Ren and W. Pan, Integr. Ferroelectr., 2013, 141, 187–194 CrossRef CAS.
- G. Z. Papageorgiou, D. S. Achilias, D. N. Bikiaris and G. P. Karayannidis, Thermochim. Acta, 2004, 427, 117–128 CrossRef.
- V. Sencadas, C. M. Costa and J. L. Go, J. Mater. Sci., 2010, 45, 1328–1335 CrossRef CAS.
- M. Avrami, J. Chem. Phys., 1939, 7, 1103–1112 CrossRef CAS.
- M. Avrami, J. Chem. Phys., 1940, 8, 212–224 CrossRef CAS.
- M. Avrami, J. Chem. Phys., 1941, 9, 177–184 CrossRef CAS.
- N. M. Reynolds, K. J. Kim, C. Chang and S. L. Hsu, Macromolecules, 1989, 21, 1092–1100 CrossRef.
- T. Giannakopoulou and N. Todorova, Appl. Surf. Sci., 2015, 358, 278–286 CrossRef.
- X. Li, M. Li, J. Yang, X. Li, T. Hu and J. Wang, J. Phys. Chem. Solids, 2014, 75, 441–446 CrossRef CAS.
- Z. Y. Jiang, G. P. Zheng, Z. Han, Y. Z. Liu and J. H. Yang, J. Appl. Phys., 2014, 115, 204101–204106 CrossRef.
- R. I. Mahdi, W. C. Gan and W. Majid, Sensors, 2014, 14, 19115–19127 CrossRef CAS PubMed.
- M. Kobayashi, K. Tashiro and H. Tadokoro, Macromolecules, 1974, 8, 158–171 CrossRef.
- R. M. Habibur, U. Yaqoob, S. Muhammad, A. S. M. I. Uddin and H. C. Kim, Mater. Chem. Phys., 2018, 215, 46–55 CrossRef CAS.
- V. Vinogrado, F. Duvernay, G. Danger, P. Theulé and T. Chiavassa, Astron. Astrophys., 2011, 530, 1–7 Search PubMed.
- Z. Y. Jiang, X. C. Zheng and G. P. Zheng, RSC Adv., 2015, 5, 61946–61954 RSC.
- D. Guo, J. Gao, Y.-J. Yu, S. Santhanam, G. K. Feder, A. J. H. McGaughey and S. C. Yao, Appl. Phys. Lett., 2014, 105, 1–6 Search PubMed.
- W. Kauzmann, Chem. Rev., 1948, 43, 219–256 CrossRef CAS.
| This journal is © The Royal Society of Chemistry 2019 |