 Open Access Article
Laser Raman tweezer spectroscopy to explore the bisphenol A-induced changes in human erythrocytes†
Jijo Lukose a,
Mithun N.a,
Priyanka M.a,
Ganesh Mohan
 b,
Shamee Shastry
 b and
Santhosh Chidangil
 *a
*a
aCentre of Excellence for Biophotonics, Department of Atomic and Molecular Physics, Manipal Academy of Higher Education, Manipal, Karnataka, India 576104. E-mail: santhosh.cls@manipal.edu
bDepartment of Immunohematology and Blood Transfusion, Kasturba Medical College, Manipal Academy of Higher Education, Manipal, Karnataka, India 576104
First published on 21st May 2019
Abstract
The dermal penetration of bisphenol-A (BPA) from thermal papers into the human skin is a matter of major health concern due to its extensive use in developing countries like India, one of its largest users in the world. Bisphenol A is widely used in the manufacture of many consumer goods like polycarbonate water bottles, baby bottles, food containers, home appliances, thermal papers used in billing and tickets, the inner lining of food cans, etc. BPA can be easily adsorbed into the blood rapidly. The integration of optical tweezers with Raman spectroscopic techniques has realized avenues for interpreting single cell investigations. In the present work, the impact of BPA from thermal papers on individual human erythrocytes (red blood cells) has been investigated using micro-Raman spectroscopy. Significant intensity variations were noticed for hemoglobin oxygenation markers in the Raman spectra of red blood cells (RBCs). Raman spectral variations supporting RBC hemoglobin depletion were also found in the presence of BPA. Evident morphological changes are also observed in RBCs due to BPA in vitro exposures, which ultimately lead to cell bursting at higher concentrations.
Introduction
Bisphenol A (2,2-di(p-hydroxyphenyl)propane, BPA) is a synthetic organic chemical utilized in the production of polycarbonate plastics and epoxy resin products.1,2 It is an endocrine disrupter which mimics the functions of estrogen hormone, promotes carcinogenic activity and thereby causes abnormal bodily reactions along with other adverse health outcomes.3 Polycarbonate products are widely employed in the production of many daily-use products such as baby bottles, plastic cups, water bottles, storage containers, etc. due to its strength, elasticity, stability and low density.4 Bisphenol A is also used in the production of contact lenses, orthodontic materials and instrumentation. A recent study reported the presence of BPA in the majority of the teenagers in Britain.5 Factors such as elevated temperatures (due to heating), detergent cleaning and mechanical cleaning can cause BPA to leach out and migrate into the food and beverages preserved inside the containers.4,6 The presence of BPA residues was found in bottled water, milk and other food products stored in polycarbonate containers.7,8The source as well as the exposure route to this chemical in humans is also of major interest. Studies have found that BPA can enter into the bloodstream both orally and non-orally through various pathways. The presence of BPA in thermal papers is significantly higher than those present in polycarbonate plastics used in food packaging and other consumer products. BPA is utilized as a heat activated color developer in thermal paper production.9,10 Thermal paper receipts are ubiquitous in daily life such as those from cash registers, ATMs, gas pumps, air tickets, train tickets bus tickets etc. BPA is present in plastic products in polymerized form with other polymers such as polycarbonate, whereas the BPA in thermal paper is in unbound form. This leads to high exposure of BPA to humans through dermal handling of thermal papers rather than the oral exposure from food containers and other plastic products.1 High blood level of BPA has been linked with various diseases such as recurrent miscarriages, abnormal karyotypes, polycystic ovarian syndrome, reproduction dysfunction etc.11–14 Ehrlich et al. have reported elevated BPA concentration in the urine of volunteers after continuous handling of thermal papers for two hours without gloves.15 De-Kun Li et al. have studied the association between BPA exposure and male infertility. Exposure to high BPA levels for men in workplaces were found to increase the risk of reduced sexual function and further worsening of the condition.14,16 Increase of Urine BPA level have been also correlated with lower sperm vitality and sperm concentration in a study conducted among Chinese population.17 Hormann et al. also reported an increase in BPA serum levels via thermal paper handling. Reports have also mentioned about the high probability of BPA absorption into the body via skin in case of thermal paper handling immediately after hand sanitizer usage.18 It is also reported that tons of thermal paper wastes are discarded into the environment on a daily basis.19 Significant rise in BPA urine levels were found for cashiers handling thermal paper on a regular basis. The study was conducted among 90 volunteers who deal with thermal paper receipts daily as well as 40 control samples.20 Latest studies from United States have also mentioned the potency of BPA to affect the insulin resistance capability in humans.21
Raman spectroscopic technique can probe the composition and structure of the molecular species in biological samples, without affecting the samples. The need of low sample requirement, and minimal sample preparation with least damage, are the added advantages associated with the technique. Optical tweezers technique invented by Arthur Ashkin have demonstrated the possibility of microparticle trapping and manipulation at an intense laser focus, which opened up new pathways for addressing single cell scientific studies.22–24 The technique involves the creation of an optical trap using a tightly focused laser beam which enables to immobilize an individual cell within the laser focus with the same laser light only utilized to produce the Raman spectrum of the cell simultaneously. This optical technique have been extensively used to investigate the red blood cell (RBC) mechanics by providing real time monitoring of single live RBC under various stress conditions.24 Raman tweezers have already been used for investigating red blood cell stress due to silver nanoparticles, stress due to glucose and in various human disorders such as thalassemia, sickle cell anemia, malaria etc.25–30
Approximately 168![[thin space (1/6-em)]](https://www.rsc.org/images/entities/char_2009.gif) 000 tons of thermal paper is annually utilized in European Community and these papers are reported to contain 1890 tons of BPA.31 In the present work, we investigated the influence of BPA (extracted from thermal paper) on live, human red blood cell using micro-Raman spectroscopy and optical trapping technique. The BPA extracted from the thermal paper was confirmed using UV-vis absorption and FT-IR spectroscopy, prior to Raman measurements. Raman studies unambiguously revealed that BPA modifies the hemoglobin oxygenation state of a live red blood cell suspended in normal saline. Morphological alteration of red blood cells initially to echinocytes and stomatocytes is also observed, followed by complete cell burst at higher concentrations.
000 tons of thermal paper is annually utilized in European Community and these papers are reported to contain 1890 tons of BPA.31 In the present work, we investigated the influence of BPA (extracted from thermal paper) on live, human red blood cell using micro-Raman spectroscopy and optical trapping technique. The BPA extracted from the thermal paper was confirmed using UV-vis absorption and FT-IR spectroscopy, prior to Raman measurements. Raman studies unambiguously revealed that BPA modifies the hemoglobin oxygenation state of a live red blood cell suspended in normal saline. Morphological alteration of red blood cells initially to echinocytes and stomatocytes is also observed, followed by complete cell burst at higher concentrations.
Experimental
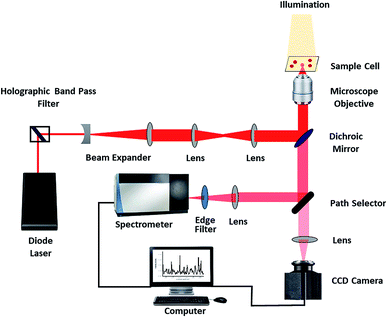
BPA was procured from Sigma Aldrich. Normal saline (0.9% Sodium Chloride) was purchased from Infutech. Ethical approval was obtained from the Institutional Ethics Committee, Kasturba Medical College and Kasturba Hospital (IEC 68/2018), for using blood samples from the blood bank of Kasturba Medical College, Manipal. Informed consent was taken from the volunteers who donated blood. Whole blood from healthy volunteers was centrifuged for 5 minutes at a rate of 3000 rpm for separating packed red blood cells and remaining plasma was discarded. Thermal paper rolls before dye printing were procured from regular commercial suppliers. Raman spectra of normal and BPA treated RBC was recorded using a single beam Raman tweezers instrument assembled in our lab (Fig. 1).16,24 Trapping and excitation of a single cell was simultaneously done using a tightly focused 785 nm wavelength Diode laser (Starbright Diode Laser, Torsana Laser Tech, Denmark). High numerical aperture (1.3 NA), 100× oil immersion microscope objective (Nikon Eclipse Ti-U microscope with supportive optics) was used for tight focusing of the laser beam. The scattered Raman signal was directed into a Horiba Jobin Yvon Spectrometer equipped with a 1200 gr per mm holographic grating. Raman spectra of trapped cell was collected by a Charge Coupled Device (Symphony CCD-1024 × 256-OPEN-1LS). For all the samples, Raman experiments were performed with an average power of ∼7 mW, exposure time of 60 seconds with 2 accumulations. Raw spectra acquired from the spectrometer were subjected to 2nd polynomial Savitzky–Golay, 17-point moving averages smoothing. Further, baseline correction was performed using asymmetric least squares method. Normalization of spectra was done using vector normalization method. Baseline correction and vector normalization of the raw spectra were performed in MATLAB.For Raman measurements, thermal paper of different dimensions were cut into pieces and immersed in normal saline and kept at room temperature for ∼1 hour. The dimensions of the samples are as follows: sample 1–0.5 cm × 5.5 cm, sample 2–1 cm × 5.5 cm, sample 3–3 cm × 5.5 cm and sample 4–5.5 cm × 5.5 cm. The maximum dimensions of thermal paper used in the study are chosen in resemblance to that of daily life products such as bus tickets, ATM slips, restaurant bills etc.
Results and discussion
The presence of BPA in thermal papers was initially identified using UV-visible absorption and IR spectroscopy prior to Raman measurements on RBCs. UV-vis spectra were recorded using Jasco V-650 spectrometer. Absorption spectra obtained for (0.1–0.3 mg mL−1) different concentrations of BPA powder dissolved in normal saline are plotted in Fig. 2(a). Small portion of ethanol was introduced to increase the solubility of BPA in saline and its concentration was chosen as 5% in the whole solvent. A peak maxima at 275 nm were observed for BPA powder spectra, whose absorbance values increased in proportion to the BPA concentration. Thermal paper of dimensions 2 cm × 5.5 cm was kept immersed at room temperature in ethanol–saline mixture for 30 minutes. Further, the presence of BPA in the solution was verified by recording the UV-vis absorption spectra of the paper treated solution. The presence of BPA was clearly evident from the absorption peak maximum of 275 nm present in the solution spectra. Using the linear plot obtained from Fig. 2(a), the amount of BPA present in saline solution containing 2 cm length paper was calculated as approximately 120 μg mL−1. This also points out the fact that the bill receipts obtained from supermarkets, hotels, bus tickets, ATM slips etc. may contain significant amounts of BPA additive. Fourier transform infrared (FT-IR) spectra were also obtained from Jasco FT/IR-6300 spectrometer using the KBr pellet technique (Fig. 2(b)). Spectra were acquired from samples over a range of 700–1300 cm−1 at a resolution of 4 cm−1. Commercially procured BPA powder was mixed with KBr powder to form pellet for IR measurements. Thermal paper was stripped into small pieces, dipped in 3 mL ethanol for 45 minutes. A drop of this solution was pipetted on to the KBr pellet, which was then dried prior to measurements. Fig. 2(b) shows the FTIR spectra of bisphenol-A powder and thermal paper immersed solution. The major peaks present in the FTIR spectrum of BPA powder were also found in thermal paper spectrum. The assignments of peaks in the FTIR spectral data are already discussed in the literatures.32,33 These results confirmed the presence of BPA in thermal paper which is used for interaction study with red blood cells.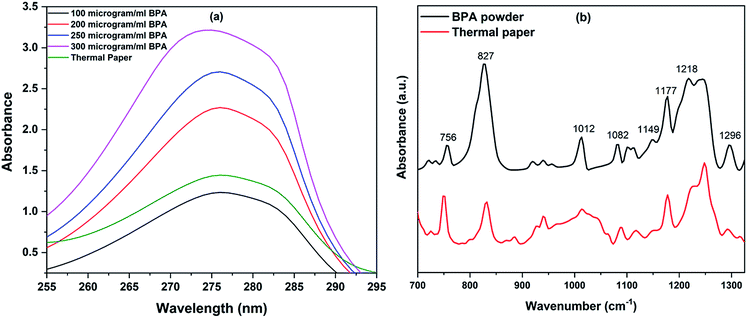 | ||
| Fig. 2 (a) UV-vis spectra of thermal paper and BPA powder of various concentrations, (b) FT-IR spectra of BPA powder and thermal paper extract. | ||
Raman spectra of red blood cells treated with different concentrations of BPA solutions (50 μg mL−1 and 75 μg mL−1) are shown in Fig. 3. The solutions were prepared from commercially procured BPA powder diluted in normal saline. The spectra given are the normalized mean Raman spectra of five RBCs collected from a healthy volunteer after ∼ five minutes of BPA treatment. The assignments for Raman bands observed in RBC spectrum are given elsewhere.16 The major bands which undergone change in presence of BPA is provided in Table 1. Majority of the Raman peaks found in RBC spectrum are contributed by hemoglobin protein. Hemoglobin is composed of four heme groups connected with their corresponding globin chain. The iron atom in the center of porphyrin ring has a planar symmetry when it is bound to oxygen and a dome configuration when deoxygenated.34,35 The conformational change upon the movement of iron atom out of the porphyrin plane during oxy–deoxy transition will be instantly reflected in the deformation angle of CH vibrations. So the hemoglobin oxygenation state can be identified by monitoring the ratio (1209 cm−1/1222 cm−1) of the deoxyHb/oxyHb bands which corresponds to methine C–H deformations.36 The shift of hemoglobin molecules from deoxygenated state to oxygenated state in presence of BPA can be assumed from the increase in 1222 cm−1 peak intensity accompanied by the gradual decrease in 1209 cm−1 from the Fig. 3. Raman signatures appearing in the spin marker region such as 1544 cm−1, 1561 cm−1, 1636 cm−1 are originated from the C–C bonds in porphyrin ring. The reduction in 1544 cm−1 peak intensity accompanied by an increase in 1561 cm−1 intensity can be attributed to the presence of more number of oxy hemes present in the blood cell. Similar intensity enhancement is also observed for the band present at 1636 cm−1. Changes were also observed in the pyrrole stretching region for the bands present at 1375 cm−1 and 1397 cm−1. In short, the Raman spectroscopy results strongly confirm the transition from deoxy to oxy Hb once the cells are suspended in concentrated BPA (75 μg mL−1) solution.
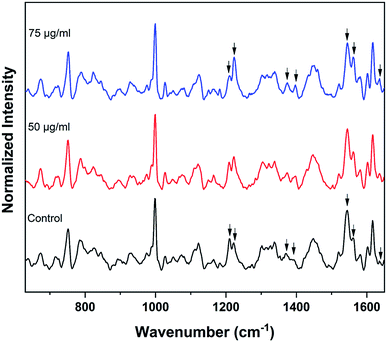 | ||
| Fig. 3 Average Raman spectra of control RBCs and BPA powder treated RBCs. Changes in oxygenation markers are highlighted by arrows. | ||
| Wavenumber (cm−1) | Intensity variation | Band assignment |
|---|---|---|
| 1209 | ↓ | ν5 + ν18 |
| 1222 | ↑ | ν13 or ν42 |
| 1375 | ↑ | ν4 |
| 1397 | ↑ | ν20 |
| 1544 | ↓ | ν11 |
| 1561 | ↑ | ν2 |
| 1636 | ↑ | ν10 |
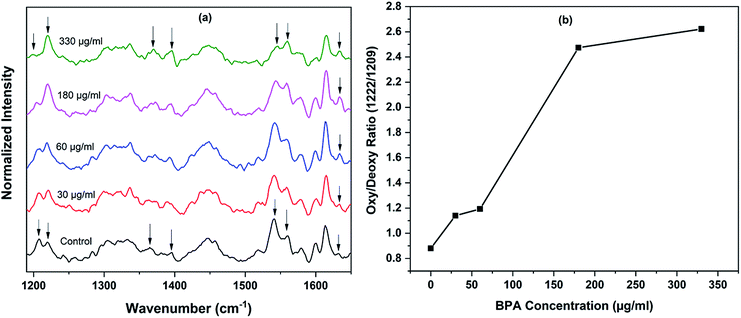
The experiment was repeated using BPA extracted from thermal papers as mentioned in Experimental section. Assuming the presence of BPA is somewhat uniform across the thermal paper strips, the concentration of BPA in solution treated with sample 1, 2, 3 and 4 can be approximated as 30 μg mL−1, 60 μg mL−1, 180 μg mL−1 and 330 μg mL−1 respectively. The packed RBCs were diluted in this BPA-saline solutions for 15 minutes prior Raman measurements. The processed average spectra of RBCs, after baseline correction and normalization, are shown in Fig. 4. First spectrum in the Fig. 4(a) represents the average spectrum of RBCs suspended in fresh normal saline, which serves as control. Remaining spectra were obtained after treating RBCs with BPA contained samples 1, 2, 3 and 4 respectively for 15 minutes. As evident from the spectra, the trend towards oxygenation is repeated for red cells in thermal paper treated saline solutions. As discussed earlier, two major bands present at 1209 cm−1 and 1222 cm−1 are considered as the main oxygenation markers of hemoglobin in Raman spectroscopic studies. The close proximity of these vibrations to protein subunits helps for the immediate tracing of conformational changes occurring to hemoglobin.34 The bands present in spin marker region (1500–1650 cm−1) assigned to C–C bonds in the porphyrin ring is influenced by the spin state of central Fe atom.37 The movement of iron atom at the center of porphyrin ring during oxy ↔ deoxy state transition alters the coordination strength between it and the ring. This is sufficient to impart variation in the molecular vibrations. The ratio of intensity of Raman bands at 1222 cm−1 and 1209 cm−1 obtained for different samples are given in Fig. 4(b). The band at 1222 cm−1 is strongly indicative of oxygenated red blood cells whereas the band at 1209 cm−1 is a marker for hemoglobin deoxygenation. The increase in the ratio (1222/1209) is due to the existence of more oxy hemes in BPA treated red blood cells. Similar trend is also repeated in the ratio of 1561/1544 bands, which validated the increasing oxygenation status. The increase in pyrrole breathing modes present at 1375 cm−1 and 1397 cm−1 also ascertains the oxygenation trend for the BPA treated RBCs. The band at 1636 cm−1 which is in general used as characteristic marker band for oxygen concentration, also increases in terms of intensity. In short, all the spectral results are again in corroboration with the assumption of oxygenated state transition in red blood cells in presence of BPA.
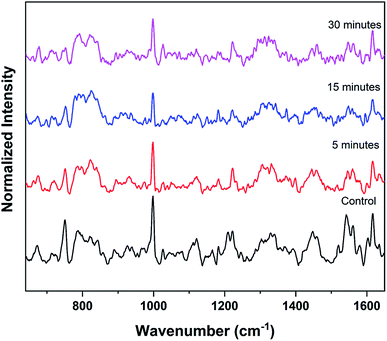
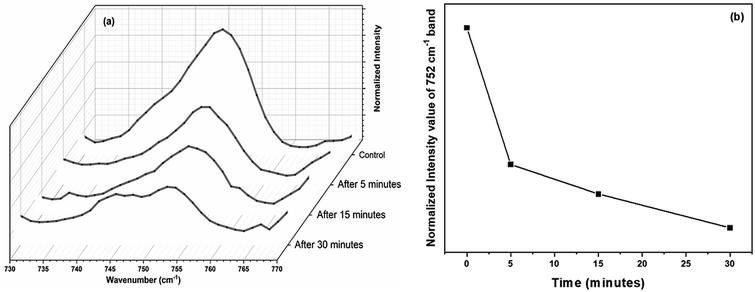
The experiments were again repeated with a larger thermal paper dimension of 6.5 cm × 5.5 cm. Raman spectrum recorded from the RBCs, dispersed in this higher concentration (∼390 μg mL−1) of BPA solution, displays a lower intensity for many of the major heme bands than the control red blood cells as shown in Fig. 5. Raman band present at 752 cm−1 which corresponds to porphyrin breathing vibration is treated as a direct measure of the heme groups present in the hemoglobin. This band intensity can be interpreted as an indicator of the RBC's vitality. Fig. 6(a) shows the porphyrin breathing region from the average Raman spectra of RBCs, after it has been exposed to ∼390 μg mL−1 BPA for various time intervals. The spectra were recorded at time intervals of 5 minutes, 15 minutes and 30 minutes. In Fig. 6, 30 minute BPA is an average of three RBC spectra, since all the remaining RBCs were entirely ruptured during the experiment which made optical trapping unrealizable. The control in this figure indicates the average spectrum of the RBCs diluted in normal saline. The porphyrin breathing mode intensity experiences a reduction in the concentrated BPA sample. As time elapses, the porphyrin breathing mode intensity undergoes a decrease as shown in the Fig. 6(a) and (b). In ∼390 μg mL−1, the value of 752 cm−1 is found to decrease by 98.9% (from 0.4068 to 0.00441 counts) over the period of 30 min. Moreover, the intense peak at 999 cm−1 assigned to the symmetric ring breathing of phenylalanine also suffered an intensity decrease in BPA treated cells as shown in Fig. 5. Phenyl alanine is present in both hemoglobin as well as in red blood cell membrane proteins. So, the significant reduction in this peak can be also correlated with the hemoglobin degradation, which may be accompanied with some contribution also from the depletion in membrane proteins. From these observations, it can be concluded that bisphenol can cause permanent damage to red blood cells at high BPA concentrations. The fact that, these are spectra from single cells and not from a collection of cells, show that RBCs do not undergo sudden death at this concentration, but the collapse is rather gradual as shown in Fig. 6(a) and (b). Complete cell collapse occurs after ∼30–40 minutes in case of ∼390 μg mL−1 BPA. The power level (∼7 mW) that is used to record the Raman spectra of red blood cell in the present work is well below the threshold for the occurrence of any type of photo damage (heme aggregation/protein denaturation). As seen from the ESI (Fig. S1†), the heme aggregation/protein denaturation markers (highlighted by arrows) originated due to photodamage in the RBC Raman spectra are present only in higher powers. The absence of these heme aggregation/protein denaturation markers due to photodamage at 1244, 1368, 972 etc. can be regarded as suitable evidence to rule out the chance of any laser induced damage on RBC in the present work.
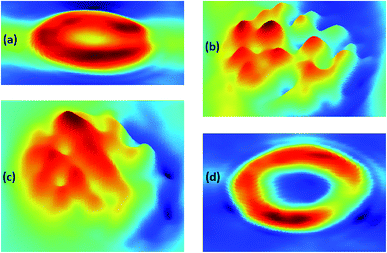
To investigate the morphological changes induced by BPA on red blood cells, light microscopy images of RBCs were recorded. RBCs diluted in normal saline containing different concentrations of BPA were transferred onto glass slides having a well of ∼1 mm depth, and covered with a coverslip. Red blood cells were observed through microscope and images were captured at 100× magnification. RBCs were not stained for obtaining these microscope images. Microscope images of RBCs showed significant morphological transitions as the BPA concentration was increased. Normal human red blood cell is assumed to be having a discocyte shape under physiological conditions. The deformation capability of RBCs plays a crucial part for functional microcirculation. The biconcave shape of these cells are responsible for its flexibility and allows it to pass through blood capillaries as well as thin slits of splenic sinusoids. Compromised cell deformability can trigger threats connected to blood blockage or excessive mechanical clearance of RBC in spleen. Fig. 7 depicts the changes in RBC morphology induced by exposure to various BPA concentrations obtained from thermal paper treated saline. Red blood cells were present as normal, discocytic shape in normal saline solution as shown in Fig. 7(a). As BPA is introduced to the control, the RBCs undergo morphological alterations resulting in irregular membrane shapes. At ∼60 μg mL−1 BPA concentration, majority of the RBCs have undergone shape transition to echinocytes with thorny projections all over its surface in five minutes (Fig. 7(b)). RBCs lose their normal morphology and turned into echinocytes immediately in ∼180 μg mL−1 concentrated BPA solution. But as the time elapses, the echinocytes present in the solution got converted to either spherocytes or stomatocytes in which the specular structure disappeared which is evident from Fig. 7(c). Upon exposure to a concentration of ∼390 μg mL−1, some cells undergo complete lysis within few minutes. Most of the cells except very few as shown in Fig. 7(d) were completely lysed in half an hour incubation time. The images acquired from different regions after 45 minutes of incubation time in this concentration is shown in ESI Fig. S2.† Only debris extracts were found remaining in the solution. The intensity decline noted for porphyrin breathing mode as well as phenyl alanine during Raman experiments upon high BPA concentration can be correlated with this red blood cell lysis. RBC membrane is composed of a lipid bilayer with a spectrin-based membrane cytoskeleton underneath. The normal morphology of the cell changes once the structural properties of cytoskeleton is disturbed. Distraction in the lipid bilayer can generate stomatocytosis, once the inner half of the bilayer is expanded relative to the outer half. Similarly, echinocytosis happens when the outer half is expanded relative to the inner half. Spherocytes as well as stomatocytes can lyse early than discocytes in presence of any external stress. The quantitative phase images supporting the morphological alteration from discocyte to echinocytes is attached in Fig. 8. Quantitative Phase Image (QPI) images were obtained using d'Bioimager (d'Optron). The discocyte morphology in physiological saline is shown in Fig. 8(a). The specular structures formed on the membrane surface in presence of ∼60 μg mL−1 BPA is clearly evident in Fig. 8(b) and (c) depicts the structure of RBC exposed for thirty minutes in ∼60 μg mL−1 BPA. Stomatocyte formation obtained after RBC exposure to higher BPA concentration is illustrated in Fig. 8(d). This morphological investigation clearly show the effect of BPA on RBCs during interaction with RBCs.
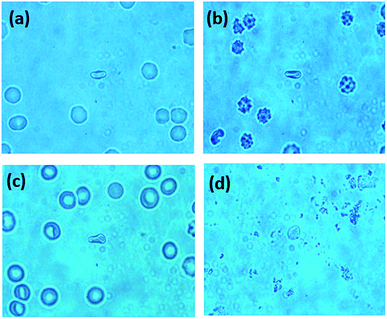 | ||
| Fig. 7 Microscopy images of RBCs treated with different BPA concentrations (a) control (b) ∼60 μg mL−1 (c) ∼180 μg mL−1 and (d) ∼390 μg mL−1. | ||
Recently Chen et al. have carried out theoretical calculations on bisphenol interaction with phospholipid membranes using molecular dynamics simulation.38 As per the study, BPA in aqueous phase can easily enter the lipid membrane. At higher concentrations, BPA also shows tendency to form clusters by aggregation and finally can lead to pore formation once the cluster penetrates into the membrane. When aggregated in the membrane, BPA cluster can extract lipids and adsorb them on its surface, resulting in pore formation. This clustering mechanism may result in the potential cytotoxicity of bisphenol A. The molecular simulations seems to be confirmed from the experimental results obtained from our studies. The effect of live, human RBCs exposed to bisphenol content from thermal papers was investigated by performing Raman spectroscopy experiments at single-cell level. To the best of our knowledge this is the first report on micro-Raman investigation of BPA exposure to human live RBCs. Bands representing the oxygenation markers in Raman spectra displayed remarkable intensity enhancement in case of BPA treated RBCs. The vitality of RBCs was examined by evaluating the intensity of the porphyrin breathing mode of hemoglobin that appears at 752 cm−1. The decrease in the intensity of the 752 cm−1 band became more rapid and prominent as the BPA concentration increased. The exposure to highly concentrated BPA for short times induces toxicity in red blood cells followed by complete cell lysis. The long term exposure of humans to low concentrations of BPA in real-life situations may also cause similar hemolysis concerns. This study highlights the necessity for further investigations on the stress effects that bisphenol A can cause on blood cell membranes.
Conclusions
Increased levels of BPA exposure is associated with major health disorders including reproductive impairment, autism, cardiovascular diseases, diabetes, obesity etc. The present study was aimed to investigate the effect of BPA extracted from thermal papers on single, live red blood cell using micro Raman spectroscopy. Significant differences were observed in the Raman spectra of control RBCs and BPA-treated RBCs. Hemoglobin oxygenation marker bands undergo significant changes similar to those during transition from deoxygenated to oxygenated state upon bisphenol addition. An increase in BPA concentration induced a greater oxygenation-type effect on red blood cell dispersed in normal saline. The frequency shift of the C–H bending frequency in heme molecule from 1209 cm−1 to 1224 cm−1 is similar to the shift during conformational changes in heme that occur during its transition from the deoxygenated state to the oxygenated state. The decrease in both the porphyrin breathing mode (752 cm−1) and phenyl alanine mode (999 cm−1) confirms the hemoglobin as well as membrane depletion in presence of BPA. The light microscope images clearly showed a morphological transition of RBCs to echinocytes and further stomatocytes upon BPA treatment, which is also a matter of critical concern. BPA treatment in high concentrations also resulted in drastic morphological alterations of RBC which ultimately led to complete cell damage. In view of the present study, the use of thermal papers and its impact on health aspects have to be critically addressed in future.Conflicts of interest
The authors declare that they have no conflict of interest.Acknowledgements
Authors are thankful to DBT, DST-FIST, Govt. of. India and VGST, Govt. of Karnataka for providing the financial support for the fellows working in the project. Jijo Lukose also acknowledge Manipal Academy of Higher Education for the post doctoral fellowship. Authors also like to acknowledge Dr V. B. Kartha, Dr Sajan D. George for their valuable suggestions, Vittal Shenoy, Udaya Kunder and the staffs in Blood Bank-KMC, Manipal for their support during this research work.References
- D. Zalko, C. Jacques, H. Duplan, S. Bruel and E. Perdu, Chemosphere, 2011, 82, 424–430 CrossRef CAS PubMed.
- C. A. Richter, L. S. Birnbaum, F. Farabollini, R. R. Newbold, B. S. Rubin, C. E. Talsness, J. G. Vandenbergh, D. R. Walser-Kuntz and F. S. vom Saal, Reprod. Toxicol., 2007, 24, 199–224 CrossRef CAS PubMed.
- B. S. Rubin, J. Steroid Biochem. Mol. Biol., 2011, 127, 27–34 CrossRef CAS.
- L. N. Vandenberg, R. Hauser, M. Marcus, N. Olea and W. V. Welshons, Reprod. Toxicol., 2007, 24, 139–177 CrossRef CAS PubMed.
- J. Leake, The Sunday Times, https://www.thetimes.co.uk/article/alert-as-oestrogen-mimicking-bpa-found-in-teens-ch82zvjz7, 2018.
- H. H. Le, E. M. Carlson, J. P. Chua and S. M. Belcher, Toxicol. Lett., 2008, 176, 149–156 CrossRef CAS.
- V. Santhi, N. Sakai, E. Ahmad and A. Mustafa, Sci. Total Environ., 2012, 427, 332–338 CrossRef PubMed.
- J. Lopez-Cervantes and P. Paseiro-Losada, Food Addit. Contam., 2003, 20, 596–606 CrossRef CAS PubMed.
- T. Mendum, E. Stoler, H. VanBenschoten and J. C. Warner, Green Chem. Lett. Rev., 2011, 4, 81–86 CrossRef CAS.
- M. Terasaki, F. Shiraishi, H. Fukazawa and M. Makino, Environ. Toxicol. Chem., 2007, 26, 2356–2366 CrossRef CAS PubMed.
- M. Sugiura-Ogasawara, Y. Ozaki, S.-i. Sonta, T. Makino and K. Suzumori, Hum. Reprod., 2005, 20, 2325–2329 CrossRef CAS PubMed.
- M. Fernández, N. Bourguignon, V. Lux-Lantos and C. Libertun, Environ. Health Perspect., 2010, 118, 1217 CrossRef PubMed.
- E. Kandaraki, A. Chatzigeorgiou, S. Livadas, E. Palioura, F. Economou, M. Koutsilieris, S. Palimeri, D. Panidis and E. Diamanti-Kandarakis, J. Clin. Endocrinol. Metab., 2011, 96, E480–E484 CrossRef CAS PubMed.
- D. Li, Z. Zhou, D. Qing, Y. He, T. Wu, M. Miao, J. Wang, X. Weng, J. Ferber and L. Herrinton, Hum. Reprod., 2009, 25, 519–527 CrossRef PubMed.
- S. Ehrlich, A. M. Calafat, O. Humblet, T. Smith and R. Hauser, J. Am. Med. Assoc., 2014, 311, 859–860 CrossRef CAS PubMed.
- A. Bankapur, E. Zachariah, S. Chidangil, M. Valiathan and D. Mathur, PLoS One, 2010, 5, e10427 CrossRef PubMed.
- D.-K. Li, Z. Zhou, M. Miao, Y. He, J. Wang, J. Ferber, L. J. Herrinton, E. Gao and W. Yuan, Fertil. Steril., 2011, 95, 625–630 CrossRef CAS PubMed.
- F. S. v. S. Annette, M. Hormann, S. C. Nagel, R. W. Stahlhut, C. L. Moyer, M. R. Ellersieck, W. V. Welshons, P.-L. Toutain and J. A. Taylor, PLoS One, 2014, 9, e110509 CrossRef PubMed.
- L. M. Divya, G. K. Prasanth and C. Sadasivan, Appl. Biochem. Biotechnol., 2013, 169, 1126–1133 CrossRef CAS PubMed.
- T. Geens, L. Goeyens, K. Kannan, H. Neels and A. Covaci, Sci. Total Environ., 2012, 435–436, 30–33 CrossRef CAS PubMed.
- R. W. Stahlhut, J. P. Myers, J. A. Taylor, A. Nadal, J. A. Dyer and F. S. vom Saal, J. Endocr. Soc., 2018, 2, 1173–1187 CrossRef PubMed.
- A. Ashkin and J. M. Dziedzic, Science, 1987, 235, 1517–1520 CrossRef CAS PubMed.
- A. Ashkin, J. M. Dziedzic and T. Yamane, Nature, 1987, 330, 769 CrossRef CAS PubMed.
- E. Zachariah, A. Bankapur, S. Chidangil, M. Valiathan and D. Mathur, J. Photochem. Photobiol., B, 2010, 100, 113–116 CrossRef CAS PubMed.
- A. Bankapur, S. Barkur, S. Chidangil and D. Mathur, PLoS One, 2014, 9, e103493 CrossRef PubMed.
- S. Barkur, A. Bankapur, S. Chidangil and D. Mathur, J. Photochem. Photobiol., B, 2017, 171, 104–116 CrossRef CAS PubMed.
- S. Barkur, D. Mathur and S. Chidangil, J. Raman Spectrosc., 2018, 49, 1155–1164 CrossRef CAS.
- W. Jia, P. Chen, W. Chen and Y. Li, Medicine, 2018, 97(39), e12611 CrossRef CAS PubMed.
- R. Liu, L. Zheng, D. M. Dwyre, F. Urbinati, D. B. Kohn, D. Matthews, J. Chan and N. Satake, Blood, 2011, 118, 4847 Search PubMed.
- R. Liu, Z. Mao, D. L. Matthews, C.-S. Li, J. W. Chan and N. Satake, Exp. Hematol., 2013, 41, 656–661 CrossRef CAS PubMed.
- JRC-IHCP, European Union Risk Assessment Report: 4,4′-isopropylidenediphenol (Bisphenol-A), 2008, pp. 201–245 Search PubMed.
- R. Ullah, I. Ahmad and Y. Zheng, J. Spectrosc., 2016, 2016, 1–5 CrossRef.
- R. Ullah and X. Wang, Appl. Opt., 2018, 57, D20–D26 CrossRef CAS PubMed.
- B. R. Wood and D. McNaughton, Biopolymers, 2002, 67, 259–262 CrossRef PubMed.
- S. Rao, Š. Bálint, B. Cossins, V. Guallar and D. Petrov, Biophys. J., 2009, 96, 209–216 CrossRef CAS PubMed.
- C. G. Atkins, H. G. Schulze, D. Chen, D. V. Devine, M. W. Blades and R. F. Turner, Analyst, 2017, 142, 2199–2210 RSC.
- S. Ahlawat, N. Kumar, R. Dasgupta, R. Shanker Verma, A. Uppal and P. Kumar Gupta, Appl. Phys. Lett., 2013, 103, 183704 CrossRef.
- L. Chen, J. Chen, G. Zhou, Y. Wang, C. Xu and X. Wang, Sci. Rep., 2016, 6, 33399 CrossRef CAS PubMed.
Footnote |
| † Electronic supplementary information (ESI) available. See DOI: 10.1039/c9ra01840a |
| This journal is © The Royal Society of Chemistry 2019 |

