
 Open Access Article
 This Open Access Article is licensed under a
 Creative Commons Attribution 3.0 Unported Licence
Synthesis of (Bi1−xSbx)2S3 solid solutions via thermal decomposition of bismuth and antimony piperidinedithiocarbamates†
Walter N. Kun ab,
Paul D. McNaughterb,
Linda D. Nyamena,
Ben F. Spencerc,
Paul O'Brienbc,
Peter T. Ndifon*a and
Neerish Revaprasadu*d
ab,
Paul D. McNaughterb,
Linda D. Nyamena,
Ben F. Spencerc,
Paul O'Brienbc,
Peter T. Ndifon*a and
Neerish Revaprasadu*d
aDepartment of Inorganic Chemistry, University of Yaoundé, I. P. O. Box 812, Yaoundé, Cameroon
bSchool of Materials, University of Manchester, Oxford Road, Manchester, M13 9PL, UK
cSchools of Chemistry and Materials, University of Manchester, Oxford Road, Manchester, M13 9PL, UK
dDepartment of Chemistry, University of Zululand, Private Bag X1001, Kwa-Dlangezwa, 3886 South Africa. E-mail: RevaprasaduN@unizulu.ac.za
First published on 21st May 2019
Abstract
The synthesis of the complete range of (Bi1−xSbx)2S3 solid solutions, where 0 ≤ x ≤ 1, by the variation of the mole ratio of bismuth and antimony piperidine dithiocarbamate complexes is reported. There was a near linear expansion of a and c lattice parameters as the mole ratio of the antimony precursor was increased. The composition of the particles directionally followed the amount of precursor ratio used. When the composition of particles was compared to cell parameters, a slight deviation from Vegard's law was observed with a corresponding contraction of the b parameter and an approximately 3.5% reduction of the lattice volume. The nanorods obtained showed aspect ratios that depend on the composition of the material. The Bi and Sb rich materials had high aspect ratios of 16.58 and 16.58 respectively with a minimum aspect ratio of 2.58 observed for x = 0.50.
Introduction
The composition, size, shape and surface topography play important roles in the performance of electronic, optoelectronic, and energy devices.1 The incorporation of a foreign atom or ion into a host crystal lattice of a semiconductor material can introduce new functional properties.2–4 Group V–VI compounds have attracted much attention due to their earth abundance and environmentally friendly nature. They display many important properties suitable for optoelectronic applications.1,5–8 Bi2S3 has a direct band gap between 1.30 eV and 1.70 eV close to the optimal band gap for terrestrial solar cell energy conversion and a high energy conversion efficiency (≥105 cm−1) and as such, is widely used for photovoltaic materials and photodiode arrays.9–13 Sb2S3 has an energy band gap between 1.78 eV and 2.50 eV covering the visible and the near infrared region of the electromagnetic spectrum and shows good photovoltaic properties.14,15 It has found use in thermoelectric devices, write once and read many (WORM) optical storage devices, IR region television cameras, infrared spectroscopy and in lithium/sodium ion batteries.16–22 solar cells based on Sb2S3 films have been fabricated with power conversion efficiency of 4.3%.23,24Despite the significant difference in their sizes Bi and Sb form a full range solid solution series between stibnite and bismuthinite.25,26 The formation of a solid solution between the two compounds is due to their similarity in charge, ability to crystallize in the same orthorhombic lattice with space group Pnma, having typical lattice parameters of a = 11.2690 Å, b = 3.9717 Å and c = 11.1290 Å for bismuthinite and a = 11.2990 Å, b = 3.8313 Å and c = 11.2270 Å for stibnite.27,28 Their orthorhombic unit cell volume differs by 3.5%.29–32 Analysis on various stibnite and bismuthinite samples from various localities show that replacement of Sb with Bi goes up to 55 moles% giving a limiting mixability range of (Bi0.45Sb0.55)2S3 in naturally occurring Bi2S3–Sb2S3 solid solution.25,32,33 This paucity of representation covering the whole solid solution range in natural samples is attributed to the different geological conditions under which bismuthinite and stibnite are deposited in nature.25,34 Kyono et al. synthesised a full range (BiSb)2S3 solid solution series with a nearly statistical substitution of Sb for bismuth by heating Bi2S3 and Sb2S3 at 800 to 1000 °C.30 However, their method provided no control over stoichiometry as four samples with the same composition range were obtained from a starting mixture with the same Bi2S3![[thin space (1/6-em)]](https://www.rsc.org/images/entities/char_2009.gif) :Sb2S3 molar ratio. This observation of large deviations from linear trends in the lattice constants was in contradiction to earlier work by Nayak et al. that showed good agreement with Vegard's law on the entire solid solution range by depositing thin films of the solid solution by a dip-dry method.10 Colloidal synthesis of nanostructures in surface passivating agents has proven to be an efficient route as it provides easy control over size and shape.35,36 Wang et al. used a dual precursor source route to synthesize a full range solid solution of (Bi1−xSbx)2S3 with aspect ratios that depended on their compositions.1 Patra et al. did similar work using diethyldithiocarbamate complexes in oleylamine and thiol.4 However, they did not investigate the influence of the Sb substitution on the lattice constant.37 Khan et al. prepared the entire range of (SnS1−xSex) from bis(selonobenzoato)dibutyltin(IV) and bis(thiobenzoato)-dibutyltin(IV) complexes by colloidal and melt methods and showed that the colloidal method provided superior control over composition, though both methods showed compositional dependence in the variation of the lattice parameters.38 In our earlier work, we showed that addition of a small amount of dodecanethiol was efficient in directing the shapes of Bi2S3 rods from single source precursors by thermal decomposition of bismuth dithiocarbamate complexes in high boiling point coordination solvents.39
:Sb2S3 molar ratio. This observation of large deviations from linear trends in the lattice constants was in contradiction to earlier work by Nayak et al. that showed good agreement with Vegard's law on the entire solid solution range by depositing thin films of the solid solution by a dip-dry method.10 Colloidal synthesis of nanostructures in surface passivating agents has proven to be an efficient route as it provides easy control over size and shape.35,36 Wang et al. used a dual precursor source route to synthesize a full range solid solution of (Bi1−xSbx)2S3 with aspect ratios that depended on their compositions.1 Patra et al. did similar work using diethyldithiocarbamate complexes in oleylamine and thiol.4 However, they did not investigate the influence of the Sb substitution on the lattice constant.37 Khan et al. prepared the entire range of (SnS1−xSex) from bis(selonobenzoato)dibutyltin(IV) and bis(thiobenzoato)-dibutyltin(IV) complexes by colloidal and melt methods and showed that the colloidal method provided superior control over composition, though both methods showed compositional dependence in the variation of the lattice parameters.38 In our earlier work, we showed that addition of a small amount of dodecanethiol was efficient in directing the shapes of Bi2S3 rods from single source precursors by thermal decomposition of bismuth dithiocarbamate complexes in high boiling point coordination solvents.39
This paper examines the effect of substituting antimony for bismuth on the structure of the bismuthinite–stibnite solid solution prepared by bismuth piperidine and antimony piperidine dithiocarbamate complexes.
Experimental section
Bismuth trichloride (98%, Sigma-Aldrich), antimony trichloride (99%, Sigma-Aldrich), carbon disulphide (99.9%, Sigma-Aldrich), piperidine (99.5% Sigma-Aldrich), oleylamine (98% Sigma-Aldrich), 1-dodecanethiol (98% Sigma-Aldrich), ethanol (99.8% Sigma-Aldrich), chloroform (99.8% Sigma-Aldrich), chloroform-d (99.8% Sigma-Aldrich), and sodium hydroxide (97% Fisher Scientific) were used as supplied without further purification.Synthesis of the precursors
![[double bond, length as m-dash]](https://www.rsc.org/images/entities/char_e001.gif) S), 1468 cm−1 (CN); elemental analysis (%) for C6H14NS2O2Na: C 32.86, H 6.43, N 6.39, Na 10.48, S 29.24; found: C 33.05, H 6.34, N 6.6.33, Na 10.66, S 28.88.S), 1468 cm−1 (CN); elemental analysis (%) for C18H32N3OS6Bi; calc; C 30.54, H 4.56, N 5.94, S 27.18, Bi 29.52. Found; C 30.99, H 4.28, N 5.98, S 26.80, Bi 29.39.
S), 1468 cm−1 (CN); elemental analysis (%) for C6H14NS2O2Na: C 32.86, H 6.43, N 6.39, Na 10.48, S 29.24; found: C 33.05, H 6.34, N 6.6.33, Na 10.66, S 28.88.S), 1468 cm−1 (CN); elemental analysis (%) for C18H32N3OS6Bi; calc; C 30.54, H 4.56, N 5.94, S 27.18, Bi 29.52. Found; C 30.99, H 4.28, N 5.98, S 26.80, Bi 29.39.Sb(PipDtc)3·3H2O: yield 82% mp 239 °C. Significant IR bands: ν = 3377 (O–H), 967 (CS), 1476 cm−1 (CN); elemental analysis (%) for C18H36N3O3S6Sb; calc; C 32.92, H 5.53, N 6.40, S 29.30, Sb 18.54. Found; C 32.72, H 5.84, N 6.47, S 30.14, Sb 19.15.
Synthesis of (BixSb1−x)2S3 solid solutions
(BixSb1−x)2S3 solid solutions were prepared by variation of the mole ratio of (2) and (3). In a typical experiment, a mixture of (2) and (3) totalling 0.29 mmol was dispersed in a mixture of oleylamine (4.0 mL) and 1-dodecanethiol (0.2 mL). This was injected into 8.0 mL of hot oleylamine (230 °C) under N2. After 30 min the reaction was quenched, and the ensuing black precipitate washed three times with ethanol (12.0 mL), centrifuged (11000 rpm) and dispersed in toluene (5.0 mL).
Instrumentation
Fourier transform infrared spectroscopy was performed using a Thermo Scientific Nicolet iS5 instrument (4000–400 cm−1, resolution 4 cm−1). Optical measurements were performed on a Shimadzu UV-1800 spectrophotometer. Elemental analysis was performed with a Thermo Flash 2000 and Carlo Erba EA 1108 elemental analysers (Department of Chemistry University of Manchester). Melting points were recorded on a Stuart SMP10 Melting point apparatus. Thermogravimetric analysis was performed on a Seiko SSC5200/S220TG/DTA model, at a heating rate of 10 °C min−1 from 30 °C to 600 °C, under nitrogen.XRD patterns of the thin films were collected on a PANalytical X'Pert PRO powder diffractometer (Material Science University of Manchester) with a Cu Kα radiation source (λ = 1.5406 Å). The samples were mounted flat and scanned over the 2θ range of 10–70° in a step size of 0.05.
X-ray photoelectron spectroscopy (XPS) was performed using an Axis Ultra Hybrid (Kratos Analytical, United Kingdom) using 10 mA emission (150 W) of monochromated Al Kα radiation (1486.6 eV). Samples were pressed onto carbon tape, and a charge neutraliser was used to replenish electrons at the surface and remove the effects of differential charging under the X-ray beam. High resolution spectra were collected using an electron energy analyser pass energy of 20 eV and survey spectra with 80 eV pass energy.
X-ray photoelectron spectroscopy (XPS) data were analysed using CASAXPS (www.casaxps.com): the binding energy scales were calibrated using the principle C 1s peak associated with hydrocarbon at 284.8 eV, Shirley backgrounds were fitted where appropriate, and atomic concentrations were calculated using relative sensitivity factors incorporating the photoionization cross section for each core electron orbital, as well as the transmission function of the electron energy analyser. Peak fitting using Voigt-approximation Gaussian–Lorentzian products was performed to obtain binding energy positions for chemical species determination.
Transmission electron microscope (TEM) images, high resolution transmission electron microscope (HRTEM) images, selected area electron diffraction (SAED) patterns and energy dispersive X-ray spectroscopy (EDS) spectra were obtained with an FEI Talos F200A microscope (PSI, University of Manchester) equipped with an X-FEG electron source and Super-X SDD EDS detectors. The experiment was performed using an acceleration voltage of 200 kV and a beam current of approximately 5 nA. Images were recorded with a FEI CETA 4k × 4k CMOS camera. Single crystal X-ray data were collected on a dual source Rigaku FR-X rotating anode diffractometer using Cu Kα wavelength at 150 K and reduced using CrysAlisPro 171.39.30c. Absorption correction was performed using empirical methods (SCALE3 ABSPACK) based upon symmetry-equivalent reflections combined with measurements at different azimuthal angles. The structure was solved and refined using Shelx-2016 implemented through Olex2 v1.2.9.2,3.
Results and discussion
Characterization of the precursors
The reaction of piperidine dithiocarbamate with BiCl3 and SbCl3 gave tris(piperidinedithiocarbamato)bismuth(III) (Bi(S2CPip)3) (2) and tris(piperidinedithiocarbamato)antimony(III) (Sb(S2CPip)3) (3) respectively. The presence of the dithiocarbamate moiety in the two complexes was shown by the characteristic thioureide band ν(CN) around the 1450–1500 cm−1 region and the ν(CS) band around the 960–1000 cm−1. These bands appeared shifted to higher frequencies in the spectrum of the corresponding free ligand. The bidentate nature of the coordination of the dithiocarbamate ligand was shown by the band around 960–1000 cm−1 which appeared unsplit.40 Broad bands around 3300–3500 cm−1 in the spectra of the ligands as well as the antimony piperidine complex is due to the presence of moisture in the compounds.
Single crystals of complex (3) were grown in chloroform/ethanol mixture, and their X-ray crystal structure was determined at 150 K. The low temperature structure of tris(piperidinedithiocarbamato)antimony(III) (Sb(S2CPip)3), crystallizes into a six coordinate Sb complex surrounded by three piperidinedithiocarbamato groups bonded through S donor atoms. There are three short Sb–S distances of ∼2.53 Å and three long Sb–S distances of ∼2.9–3.0 Å. There is a stereochemically active lone pair on the Sb atom such that the (seven) steric groups (6 S donors and 1 lone pair) occupy the vertices of an ‘elongated triangular pyramid’ in which there are parallel triangular sets of S donors with the lone pair pointed normal to the planes of 3 S atoms (the short Sb–S and the long Sb–S). A similar structure was reported by Liu and Tiekink41 at a much higher temperature of 223 K. The three short Sb–S bond length was found to be ∼2.52 Å and that of the three long Sb–S bonds were 2.86 Å, which favourably compares to those of complex (3). The mean interchelate S–Sb–S bond angles of 93.60 of complex (3) is also comparable to 92.32 of the reported structure. The crystal structure, some selected bond lengths together with the crystallographic data and structural refinement parameters for complex (3) are shown in ESI 2, 3 and 4 respectively.†
The thermogram of complex (2) shows a three-step decomposition pattern. The first mass loss of 3.05% (2.56% calculated) at 128 °C corresponds to the loss of H2O molecules. The second mass loss of 59.47% (58.56% calculated) at 281 °C corresponds to the loss of the organic moiety and sulfur, while the third mass loss of 10.41% (11.09% calculated) at 464 °C is attributed to the additional loss of sulfur with the formation of a final residue of 33.67% (35.9% calculated) corresponding to Bi2S3. Complex (3) shows a two-step decomposition pattern, with the first mass loses of 8.68% (8.14% calculated) at 100 °C corresponding to the loss of the three water molecules and a second mass loss of 70.49% (72.44% calculated) attributed to the loss of the organic moiety and sulfur with the formation of a residue of 26.16% (25.56% calculated) which corresponds to Sb2S3 (Fig. 1).
 | ||
| Fig. 1 Thermogram of complexes (2) and (3). | ||
Compositional characterization
The EDX data (Fig. 2) (where the sampling depth is ≫ the nanorod diameter) shows that the composition of the particles synthesised is in close agreement with the mole fraction of precursors used. This result is unusual with single source precursors as the difference in metal–sulfur bond strengths normally governs the rate of decomposition and consequentially skews the composition to the more reactive metal–sulfur bond. A plot of Sb precursor mole fraction against the proportion of antimony in the particles gave a close to straight line (Fig. 2b) with full details in Table 1. Many of the samples were sulfur rich which is possibly due to the relatively low reaction temperature which prevented evaporation of sulfur, a situation commonly observed in samples prepared at a much higher temperature.42,43 | ||
| Fig. 2 (a) EDS spectra of (Bi1−xSbx)2S3 nanorods at different Bi:Sb mole ratios (b) particle composition x obtained from EDS against precursor mole fraction. | ||
| XBi (%) | XSb (%) | Chemical composition (EDX) | a (Å) | b (Å) | c (Å) | V (Å)3 |
|---|---|---|---|---|---|---|
| 100.0 | 0.0 | Bi1.95S3.05 | 11.24 | 3.97 | 11.13 | 496.68 |
| 87.5 | 12.5 | Sb0.27Bi1.68S3.05 | 11.24 | 3.95 | 11.14 | 494.32 |
| 75.0 | 25.0 | Sb0.58Bi1.34S3.08 | 11.24 | 3.93 | 11.14 | 492.90 |
| 62.5 | 37.5 | Sb0.79Bi1.15S3.06 | 11.25 | 3.92 | 11.16 | 491.88 |
| 50.0 | 50.0 | Sb0.97Bi0.95S3.08 | 11.26 | 3.91 | 11.19 | 492.00 |
| 37.5 | 67.5 | Sb1.22Bi0.75S3.04 | 11.26 | 3.87 | 11.19 | 487.13 |
| 25.0 | 75.0 | Sb1.49Bi0.51S3.00 | 11.26 | 3.87 | 11.21 | 489.03 |
| 12.5 | 87.5 | Sb1.80Bi0.24S2.96 | 11.27 | 3.86 | 11.22 | 487.23 |
| 0.0 | 100.0 | Sb1.93S3.07 | 11.27 | 3.82 | 11.22 | 483.22 |
The X-ray diffraction patterns obtained for all the Bi/Sb ratios correspond well to the orthorhombic crystal system, with peaks for the Bi–Sb–S system falling between previously reported patterns of orthorhombic bismuthinite26 (a = 11.2690 Å, b = 3.9717 Å and c = 11.1290 Å) and orthorhombic stibnite27 (a = 11.2990 Å, b = 3.8313 Å and c = 11.2270 Å), Fig. 3a. Sb2S3 and Bi2S3 both crystallize in the same orthorhombic lattice system with a difference in cell volume of 3.5% due to Sb3+ possessing a smaller ionic radius than Bi3+. The enlarged portion of the XRD pattern of the samples show a shift in the peak position confirming the successful incorporation of Sb into the Bi2S3 lattice and the movement through the entire compositional range of the (Bi1−xSbx)2S3 solid solution, Fig. 3b. A plot of the d-spacing for the (112) plane shows a gradual decrease from Bi2S3 to the Sb2S3 end with a percentage difference of 2.26% (ESI 5†).
 | ||
| Fig. 3 (a) Powder XRD pattern of Bi2S3 bottom, (Bi1−xSbx)2S3 and Sb2S3 top, samples synthesized from different Bi/Sb ratios (b) p-XRD pattern of 2θ range 27–33 degree showing shift in peaks. | ||
Refinement of the powder XRD data shows that all three axis of the unit cell vary linearly (Fig. 4). Upon increased incorporation of antimony, a and c increase whereas b decreases which is the expected behaviour when moving between Bi2S3 and Sb2S3. All three cell parameters show a linear dependency on the amount of antimony in the solid solution which agrees with Vegard's law. The subtle deviations in a and c from ideal behaviour may be due to the contrasting effect of the stereochemical active lone pair of the 5s2 and 6s2 electrons of the antimony and bismuth atoms, which is positioned in the a–c plane of the lattice.37,44 With an increased concentration of antimony, there is expansion of the inter-rod space due to the expression of the stereochemically active lone electron pair with a resulting expansion of the a and c parameters.30 However, the b axis which is least affected by the stereochemical active lone pair experiences a continuous contraction on Sb substitution, probably due to decrease in the shortest M–S bond as we move from the Bi2S3 to the Sb2S3 end.26 There is a general shrinkage of the overall cell volume of (Bi1−xSbx)2S3 as Bi is replaced by Sb (Fig. 4d).
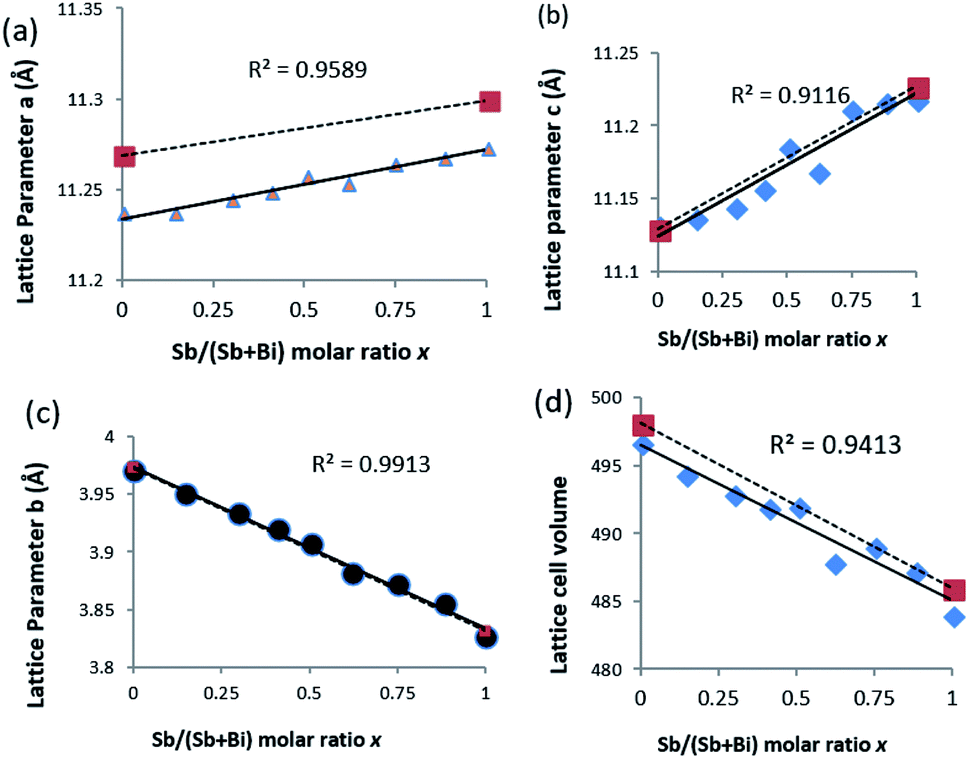 | ||
| Fig. 4 Variation of lattice constants with increasing mole fraction of Sb obtained from EDS. (a) Lattice parameter a, (b) lattice parameter b, (c) lattice parameter c and (d) cell volume. * values represent the reported standard value (dotted lines) for Bi2S3 and Sb2S3. | ||
The high-resolution transmission electron microscopy (HRTEM) images of the samples together with their selected area electron diffraction (SAED) patterns reveal the formation of highly polycrystalline powders showing two-dimensional lattice fringes (Fig. 4). Measured d-spacings of 3.69 and 4.98 Å were obtained for pure Bi2S3 (Fig. 5a) corresponding to the (011) and (102) planes (SG Pnma with a = 11.2690 Å, b = 3.9717 Å and c = 11.1290 Å) while for pure Sb2S3 (Fig. 5i) a d-spacings of 3.50 Å corresponding to the (111) (SG Pnma with a = 11.2990 Å, b = 3.8313 Å and c = 11.2270 Å) plane was recorded.
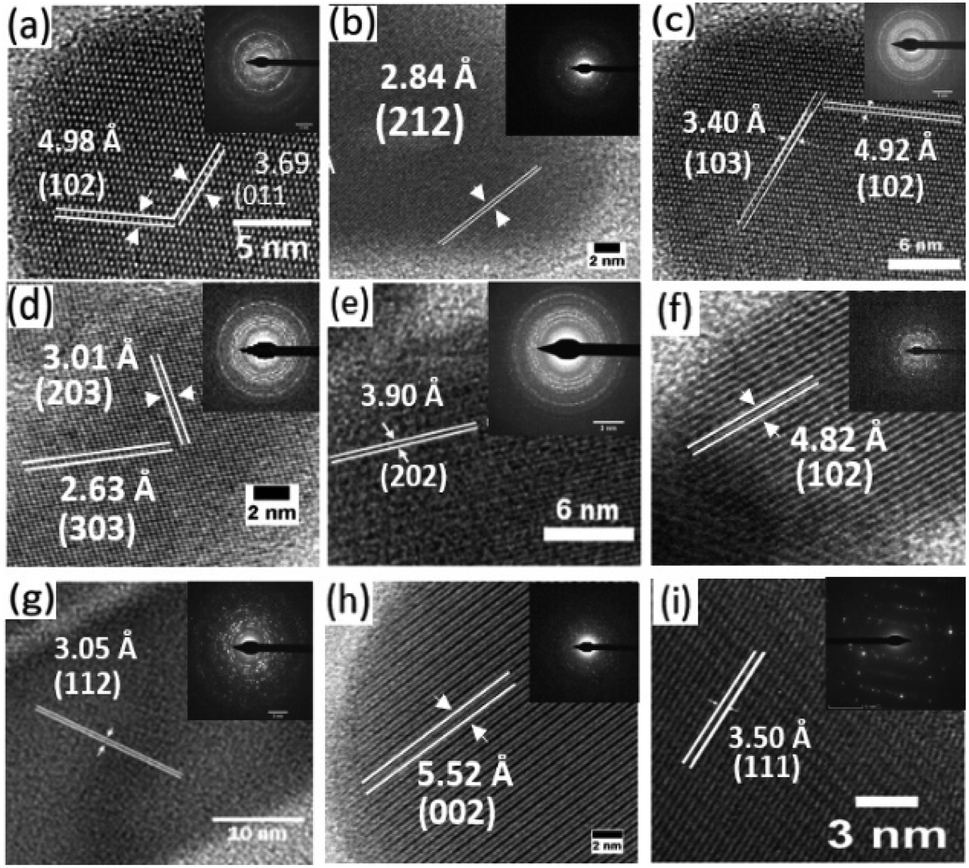 | ||
| Fig. 5 HRTEM images of synthesized nanorods with Sb/(Sb + Bi) mole fraction of (a) 1:0, (b) 7:1, (c) 3:1, (d) 5:3, (e) 1:1, (f) 3:5, (g) 1:3, (h) 1:7 and (i) 0:1. Inset in each image shows the SAED pattern. | ||
XPS is a much more surface sensitive technique than EDX, with sampling depths varying 6.3–9.0 nm for Sb, Bi and S,45 which is much less than the nanorod diameter. Bi 4f coincides with the S 2p region, and Sb 3d coincides with O 1s. Fig. 6 shows a pile-up of the Bi 4f/S 2p and Sb 3d/O 1s regions for Bi2S3, Sb2S3 and (Bi1−xSbx)2S3.
 | ||
| Fig. 6 XPS spectra for Sb2S3 (top panels (a) and (b)), Bi2S3 (bottom panels (e) and (f)), and (BixSb1−x)2S3 (middle panels (c) and (d)). The Bi 4f and S 2p spectral regions overlap ((a), (c), (e)), and the Sb 3d region overlaps with O 1s ((b), (d), (f)). | ||
In all cases the Bi 4f doublet required two chemical species (two sets of spin–orbit–split doublets) in order to obtain an adequate fit, with positions for the Bi 4f7/2 photoelectron peaks at 158.1 eV (associated with Bi2S346 and 158.8 eV (associated with oxidized Bi2O3.47 Likewise, the Sb 3d doublet required two chemical species for adequate fitting, with peak positions for 3d5/2 at 259.1 eV (associated with Sb2S348 and 530.1 eV (associated with oxidized Sb2O3).49 Note that O 1s photoelectron peaks are close to the Sb 3d5/2 signal, typically with binding energy positions at ∼530.5 eV associated with metal oxides (i.e., BiOx, SbOx), ∼532 eV associated with C–O contamination, and ∼533 eV associated with CO contamination. A variety of (BixSb1−x)2S3 samples were measured, and consistently a peak-fitting model including sulfide and oxide species was required for both Bi and Sb. However, no oxidation was seen for S, only one species for the S 2p doublet was observed for all the samples measured, with the peak position for 2p3/2 at ∼161.0 eV associated with sulfide,46,48 and in the spectra there is a clear absence of any signal associated with sulfate which is expected in the binding energy region 168–170 eV.50 Also, when calculating the atomic ratios of Bi:Sb:S, there is consistently an absence of S as expected for (Bi1−xSbx)2S3. In Fig. 6 the (BixSb1−x)2S3 sample exhibits a Bi:Sb:S ratio of 3:3:4 (or 1:1:1.3, short of the expected 1:1:1.5). This indicates that there is an absence of sulfur atoms at the surface of the nanorods hence the atomic concentrations (Table 2) are skewed from the bulk measurement by EDX analysis. This also explains the lack of sulfur oxidation while a small amount of Bi and Sb atoms at the surface of the nanorods are susceptible to oxidation. For the range of (Bi1−xSbx)2S3 nanorod materials measured, the amount of oxidation of Bi and Sb observed varied between 10–40% (with an average value of 20% for Bi and 26% for Sb).
| Sb/(Sb + Bi) | Bi–S% | Bi–O% | Total Bi% | Sb–S% | Sb–O% | Total Sb% | S% |
|---|---|---|---|---|---|---|---|
| 0 | 49.79 | 18.69 | 68.49 | 0.00 | 0.00 | 0.00 | 31.51 |
| 0.125 | 49.11 | 9.33 | 58.43 | 4.44 | 0.49 | 4.93 | 36.64 |
| 0.25 | 45.20 | 8.61 | 53.81 | 7.86 | 1.56 | 9.43 | 36.76 |
| 0.375 | 37.32 | 8.25 | 45.57 | 17.53 | 1.76 | 19.29 | 35.14 |
| 0.5 | 34.86 | 5.81 | 40.67 | 15.55 | 6.17 | 21.72 | 37.60 |
| 0.625 | 27.85 | 5.32 | 33.17 | 20.94 | 7.39 | 28.34 | 38.49 |
| 0.75 | 27.45 | 3.40 | 30.85 | 23.36 | 6.67 | 30.03 | 39.13 |
| 0.875 | 17.09 | 1.66 | 18.74 | 29.75 | 11.16 | 40.91 | 40.35 |
| 1 | 3.56 | 0.00 | 3.56 | 38.20 | 12.14 | 50.34 | 46.10 |
Morphological characterization
TEM analysis on the samples showed the presence of particles with a rod-shaped morphology, Fig. 7a–i. When the bismuth precursor was exclusively used, uniform elongated cylindrical nanorods of Bi2S3 were obtained however the antimony precursor gave long sheaf-like collections of Sb2S3 rods in the sub-micrometre range (Fig. 7i and 8e). | ||
| Fig. 7 TEM images showing the as synthesized nanorods with Bi:Sb mole ratios of (a) 1:0, (b) 7:1, (c) 3:1, (d) 5:3, (e) 1:1, (f) 3:5, (g) 1:3, (h) 1:7 and (i) 0:1. | ||
 | ||
| Fig. 8 SEM images showing surface scan of films with Bi:Sb mole ratios of (a) 1:0, (b) 3:1, (c) 1:1, (d) 1:3, (e) 0:1. | ||
There was a conspicuous change in the aspect ratio of the rods as the Bi:Sb precursor mole ratio was varied, Table 3. With a Bi:Sb precursor mole ratio of 7:1, there was a considerable reduction in both the length and aspect ratio of the nanorods compared to pure Bi2S3 until a mole ratio of 1:1, which gave an aspect ratio of 2.58 (Table 3). Wang et al. prepared (Bi1−xSbx)2S3 1-d rods, by reacting bismuth chloride, antimony chloride, sulphur powder, oleylamine and thiols and observed composition dependant aspect ratios.1 Sun et al. synthesized flower-like architectures Sb2−xBixS3 by solvothermal treatment of bismuth and antimony diethyldithiocarbamate complexes. They proposed a mechanism in which 3-d flowers grow through an epitaxial growth on Sb2−xBixS3 core.51 When we increased the precursor mole ratio of Sb beyond 1:1, the aspect ratio increased along with the length of the rods. At a mole ratio of 1:7 the longest rods of the solid solution were observed. Sb2S3 has a partial fractal splitting growth habit which often lead to the formation of sheaf-like morphologies.52 However, the inclusion of Bi ions alters the growth dynamics by inducing complete splitting growth and consequently changes morphology from very long sheaf-like sub-micrometre Sb2S3 rods to shorter separate nanorods. The particle size distribution of the as synthesized nanorods are shown in ESI 6.† TEM images of intermediate Bi:Sb ratio to those reported are shown in ESI 7.†
| Sb/(Sb + Bi) | Length (nm) | Width (nm) | Aspect ratio |
|---|---|---|---|
| 0 | 474.4 ± 92.62 | 28.61 ± 12.90 | 16.58 |
| 0.125 | 104.99 ± 46.38 | 19.79 ± 9.13 | 5.31 |
| 0.25 | 65.13 ± 13.52 | 23.69 ± 6.50 | 2.75 |
| 0.375 | 57.00 ± 11.12 | 15.55 ± 4.07 | 3.66 |
| 0.5 | 60.38 ± 12.60 | 23.38 ± 4.38 | 2.58 |
| 0.625 | 25.04 ± 7.37 | 5.56 ± 1.09 | 4.51 |
| 0.75 | 142.81 ± 56.58 | 28.56 ± 5.01 | 5.00 |
| 0.875 | 386.32 ± 137.43 | 40.05 ± 11.08 | 9.65 |
| 1 | 2880.47 ± 550.22 | 137.09 ± 44.82 | 21.01 |
Optical properties
Bi2S3 and Sb2S3 possess direct band gaps of approximately 1.3 and 1.7 eV respectively, corresponding to 954 and 729 nm. The band gap of the ternary (Bi1−xSbx)2S3 solid solutions made using different ratios of Bi and Sb should be a linear interpolation of the two parent materials. Fig. 9a shows the UV-visible absorption spectra of the as-prepared ternary (Bi1−xSbx)2S3 in which a strong broad absorption was seen within the wavelength range of 300–1100 nm. In general, the absorption edge of (Bi1−xSbx)2S3 nanorods is blue-shifted with the increase of Sb ratio.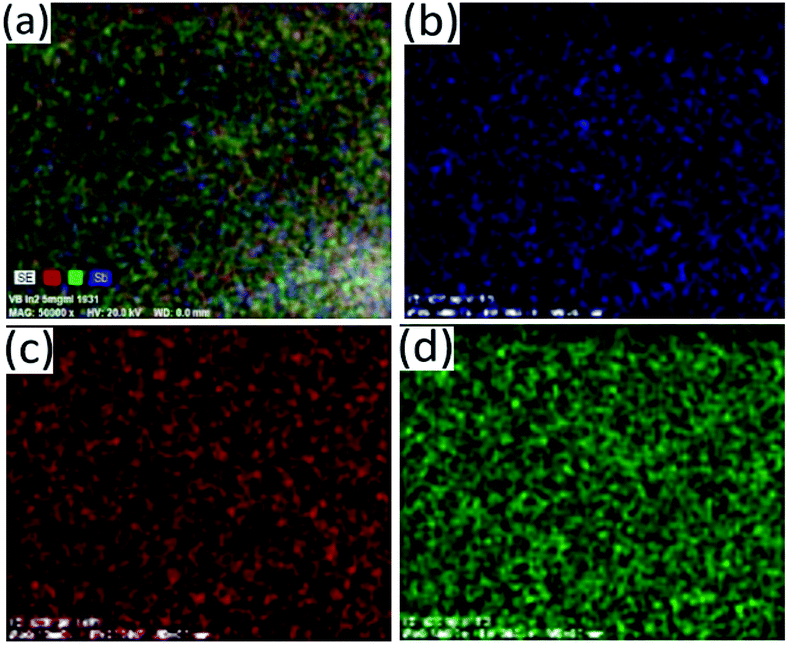 | ||
| Fig. 9 Elemental mapping of the particles synthesized at Bi:Sb mole ratio of 1:1 showing distribution of atoms (a) SE, (b) Sb, (c) Bi and (d) S. | ||
However, a plot of the absorption maximum against the antimony mole fraction shows a marked deviation from the expected linear behaviour of the band gap of ternary semiconductor materials (Fig. 10). This phenomenon known as band gap bowing is often ascribed to local compositional fluctuations which occur on substitution. The extent of such local atom displacements usually brings about nonlinear dependence on optical properties in ternary materials.44,53 O'Brien et al. synthesize Bi2−2xSb2xS3 solid solutions from solvent less thermolysis of metal xanthate precursors and showed a slight deviation from linearity in the energy band gap on Sb substitution due to stoichiometric variations in the synthesized solid solution.54
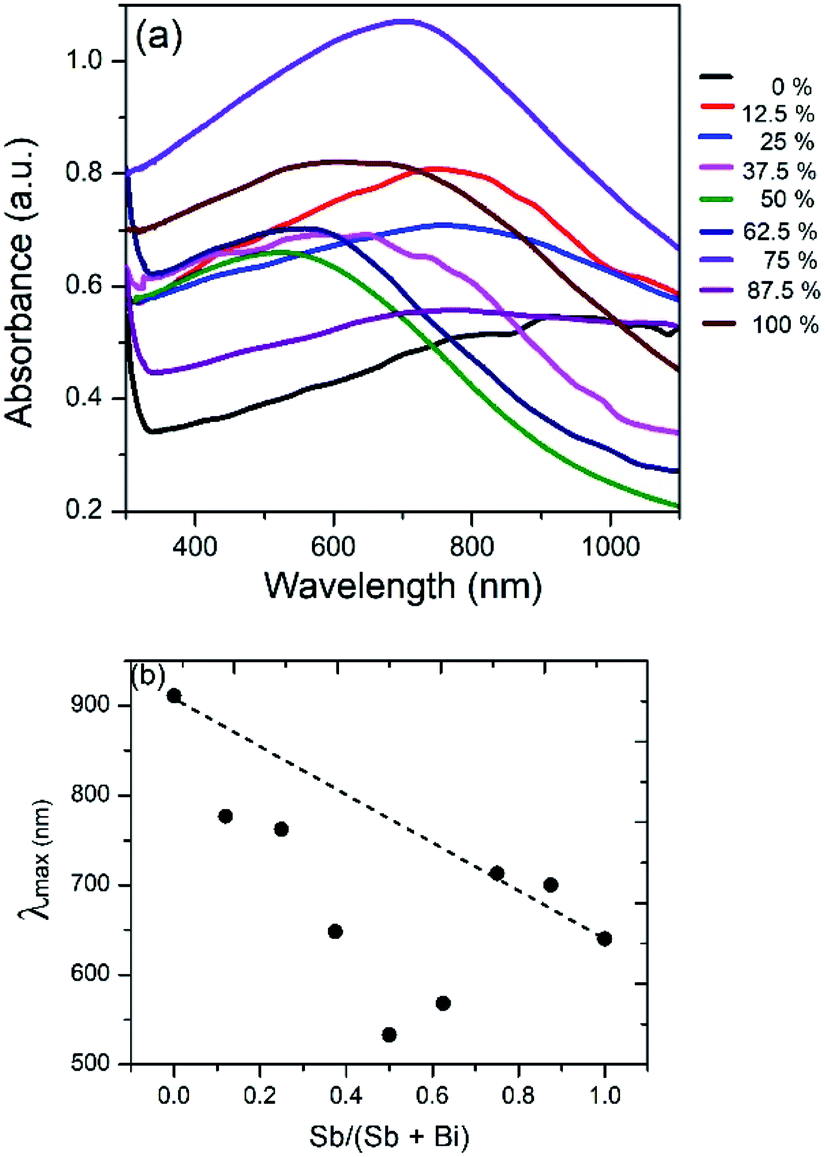 | ||
| Fig. 10 (a) UV/visible absorption spectrum of Bi2S3, Sb2S3 and (Bi1−xSbx)2S3 solid solutions. (b) Plot of absorption maximum against mole fraction of Sb, showing deviation from ideal behaviour. | ||
The Raman spectra of the particles are shown in Fig. 11. In case of pure Bi2S3 sample, a minor peak was observed at 184 cm−1 and two prominent peaks at 236 and 256 cm−1, which is in agreement with the previously reported Raman data for Bi2S3. The minor peak is assigned as Ag symmetric bending mode, whereas the dominant peaks (236 and 256 cm−1) are Ag and B1g anti-symmetric stretching modes, respectively.55,56 Similarly, one minor and two major peaks at 186, 272 and 294 cm−1 were observed for pure Sb2S3, which are in good agreement with the previous reports.57–59 The peak at 186 cm−1 can be assigned to the B1g anti-symmetric S–Sb–S bending modes, whereas the peaks at 272 and 294 cm−1 are assigned to the Ag and B1g anti-symmetric Sb–S stretching modes, respectively.56,57 The solid solutions consisting of 25% antimony show mainly one broad band around 240 cm−1, which shift to higher frequencies of 253 and 260 cm−1 when the percentage of antimony is increased to 50 and 75% respectively. The shift towards the higher wavenumber is due to lower mass of Sb as compare to Bi and shorter Sb–S bond respectively.60,61
 | ||
| Fig. 11 Raman spectra of nanorods of Sb2S3, Bi2S3 and (Bi1−xSbx)2S3 solid solutions. | ||
Conclusions
By the thermal decomposition of bismuth and antimony piperidinedithiocarbamates in oleylamine nanorods of the entire compositional range of (Bi1−xSbx)2S3 of solid solutions have been produced by varying the bismuth and antimony precursor mole fraction. The morphologies of the nanorods depended on their compositions, and aspect ratios that decreased to a minimum of 2.58 with maxima of 16.58 when using just the bismuth precursor and 21.01 when using the antimony precursor.The XRD peaks at all ratios correspond to the orthorhombic crystals system and fall between those of orthorhombic Bi2S3 and orthorhombic Sb2S3. The gradual shift in the peaks position in combination with compositional data from EDX confirms the successful incorporation of antimony into bismuth sulphide which almost adheres to Vegard's law.
Conflicts of interest
There are no conflicts to declare.Acknowledgements
The authors thank the Royal Society-Department for International Development (RS-DFID) for their financial support. NR acknowledges the National Research Foundation (NRF), South Africa through the South African Research Chair Initiative (SARChI) for financial support. We thank Dr George Whiteheard of the X-ray crystallography unit, School of Chemistry of the University of Manchester for the X-ray crystal structure of complex (3).References
- J. Wang, H. Yu, T. Wang, Y. Qiao, Y. Feng and K. Chen, ACS Appl. Mater. Interfaces, 2018, 10, 7334–7343 CrossRef CAS PubMed.
- D. Mocatta, G. Cohen, J. Schattner, O. Millo, E. Rabani and U. Banin, Science, 2011, 332, 77–81 CrossRef CAS PubMed.
- H.-Y. Chen, S. Maiti and D. H. Son, ACS Nano, 2012, 6, 583–591 CrossRef CAS PubMed.
- B. K. Patra, S. Khilari, A. Bera, S. K. Mehetor, D. Pradhan and N. Pradhan, Chem. Mater., 2017, 29, 1116–1126 CrossRef CAS.
- V. V. Killedar, C. D. Lokhande and C. H. Bhosale, Thin Solid Films, 1996, 289, 14–16 CrossRef CAS.
- B. Yang, D.-J. Xue, M. Leng, J. Zhong, L. Wang, H. Song, Y. Zhou and J. Tang, Sci. Rep., 2015, 5 DOI:10.1038/srep10978.
- F. Caruso, M. R. Filip and F. Giustino, Phys. Rev. B: Condens. Matter Mater. Phys., 2015, 92 DOI:10.1103/PhysRevB.92.125134.
- A. Hussain, A. Begum and A. Rahman, Mater. Sci. Semicond. Process., 2014, 21, 74–81 CrossRef CAS.
- O. C. Monteiro, H. I. S. Nogueira, T. Trindade and M. Motevalli, Chem. Mater., 2001, 13, 2103–2111 CrossRef CAS.
- B. B. Nayak, H. N. Acharya, G. B. Mitra and B. K. Mathur, Thin Solid Films, 1983, 105, 17–24 CrossRef CAS.
- G. Konstantatos, L. Levina, J. Tang and E. H. Sargent, Nano Lett., 2008, 8, 4002–4006 CrossRef CAS PubMed.
- M. Bernechea, Y. Cao and G. Konstantatos, J. Mater. Chem. A, 2015, 3, 20642–20648 RSC.
- W. Lou, M. Chen, X. Wang and W. Liu, Chem. Mater., 2007, 19, 872–878 CrossRef CAS.
- J. B. Biswal, N. V. Sawant and S. S. Garje, Thin Solid Films, 2010, 518, 3164–3168 CrossRef CAS.
- L. P. Deshmukh, J. Electrochem. Soc., 1994, 141, 1779 CrossRef CAS.
- X. Xiong, G. Wang, Y. Lin, Y. Wang, X. Ou, F. Zheng, C. Yang, J.-H. Wang and M. Liu, ACS Nano, 2016, 10, 10953–10959 CrossRef CAS PubMed.
- D. Y. W. Yu, P. V. Prikhodchenko, C. W. Mason, S. K. Batabyal, J. Gun, S. Sladkevich, A. G. Medvedev and O. Lev, Nat. Commun., 2013, 4 DOI:10.1038/ncomms3922.
- K. Ramasamy, H. Sims, W. H. Butler and A. Gupta, J. Am. Chem. Soc., 2014, 136, 1587–1598 CrossRef CAS PubMed.
- S. Sarkar, A. K. Guria, B. K. Patra and N. Pradhan, Angew. Chem., Int. Ed., 2014, 12566–12570 CAS.
- G. Manna, R. Bose and N. Pradhan, Angew. Chem., Int. Ed., 2014, 53, 6743–6746 CrossRef CAS PubMed.
- J. Ma, Y. Wang, Y. Wang, Q. Chen, J. Lian and W. Zheng, J. Phys. Chem. C, 2009, 113, 13588–13592 CrossRef CAS.
- S. Yao, J. Cui, Z. Lu, Z.-L. Xu, L. Qin, J. Huang, Z. Sadighi, F. Ciucci and J.-K. Kim, Adv. Energy Mater., 2017, 7, 1602149 CrossRef.
- K. Zhang, T. Luo, H. Chen, Z. Lou and G. Shen, J. Mater. Chem. C, 2017, 5, 3330–3335 RSC.
- X. Wang, R. Tang, C. Wu, C. Zhu and T. Chen, J. Energy Chem., 2018, 27, 713–721 CrossRef.
- V. W. Lueth, P. C. Goodell and N. E. Pngitore, Econ. Geol., 1990, 85, 1462–1472 CrossRef CAS.
- D. Poleti, L. Karanović, T. Balić-Žunić and I. Gržetić, Neues Jahrb. Mineral., Abh., 2012, 189, 177–187 CAS.
- L. F. Lundegaard, R. Miletich, T. Balic-Zunic and E. Makovicky, Phys. Chem. Miner., 2003, 30, 463–468 CrossRef CAS.
- L. F. Lundegaard, E. Makovicky, T. Boffa-Ballaran and T. Balic-Zunic, Phys. Chem. Miner., 2005, 32, 578–584 CrossRef CAS.
- M. R. Filip, C. E. Patrick and F. Giustino, Phys. Rev. B: Condens. Matter Mater. Phys., 2013, 87 DOI:10.1103/PhysRevB.87.205125.
- A. Kyono and M. Kimata, Am. Mineral., 2004, 89, 932–940 CrossRef CAS.
- J. Liu, J. Liu, J. Li, H. Xie, J. Wang, J. Deng, C. Feng, F. Qi and N. Zhang, Int. Geol. Rev., 2008, 50, 163–176 CrossRef.
- G. Springer, Mineral. Mag., 1969, 37, 294 CrossRef CAS.
- P. S. Nair, T. Radhakrishnan, N. Revaprasadu, G. A. Kolawole and P. O'Brien, Chem. Commun., 2002, 564–565 RSC.
- S. Ghosal and R. O. Sack, Mineral. Mag., 1999, 63, 723–733 CrossRef CAS.
- J. Chang and E. R. Waclawik, RSC Adv., 2014, 4, 23505–23527 RSC.
- A. V. Nikam, B. L. V. Prasad and A. A. Kulkarni, CrystEngComm, 2018, 20, 5091–5107 RSC.
- M. Leszczynski, E. Litwin-Staszewska and T. Suski, Acta Phys. Pol., A, 1995, 88, 837–840 CrossRef CAS.
- M. D. Khan, M. Aamir, G. Murtaza, M. A. Malik and N. Revaprasadu, Dalton Trans., 2018, 47, 10025–10034 RSC.
- W. N. Kun, S. Mlowe, L. D. Nyamen, P. T. Ndifon, M. A. Malik, O. Q. Munro and N. Revaprasadu, Chem.–Eur. J., 2016, 22, 13127–13135 CrossRef CAS PubMed.
- R. Kellner, G. St. Nikolov and N. Trendafilova, Inorg. Chim. Acta, 1984, 84, 233–239 CrossRef CAS.
- Y. Liu and E. R. T. Tiekink, CrystEngComm, 2005, 7, 20 RSC.
- L. Chen, H. Deng, J. Cui, J. Tao, W. Zhou, H. Cao, L. Sun, P. Yang and J. Chu, J. Alloys Compd., 2015, 627, 388–392 CrossRef CAS.
- J. He, L. Sun, K. Zhang, W. Wang, J. Jiang, Y. Chen, P. Yang and J. Chu, Appl. Surf. Sci., 2013, 264, 133–138 CrossRef CAS.
- R. A. Groom, A. Jacobs, M. Cepeda, R. Drummey and S. E. Latturner, Inorg. Chem., 2017, 56, 12362–12368 CrossRef CAS PubMed.
- S. Tanuma, C. J. Powell and D. R. Penn, Surf. Interface Anal., 1994, 21, 165–176 CrossRef CAS.
- J. Grigas, E. Talik and V. Lazauskas, Phys. Status Solidi B, 2002, 232, 220–230 CrossRef CAS.
- K. Uchida and A. Ayame, Surf. Sci., 1996, 357–358, 170–175 CrossRef CAS.
- V. P. Zakaznova-Herzog, S. L. Harmer, H. W. Nesbitt, G. M. Bancroft, R. Flemming and A. R. Pratt, Surf. Sci., 2006, 600, 348–356 CrossRef CAS.
- C. D. Wagner, Faraday Discuss. Chem. Soc., 1975, 60, 291 RSC.
- A. A. Audi and P. M. A. Sherwood, Surf. Interface Anal., 2000, 29, 265–275 CrossRef CAS.
- J. Sun, X. Shen, L. Guo, G. Wang, J. Park and K. Wang, Nanoscale Res. Lett., 2010, 5, 364–369 CrossRef CAS PubMed.
- J. Wang, Y. Qiao, T. Wang, H. Yu, Y. Feng and J. Zhang, CrystEngComm, 2019, 21, 554–562 RSC.
- M. J. Seong, H. Alawadhi, I. Miotkowski, A. K. Ramdas and S. Miotkowska, Solid State Commun., 1999, 112, 329–334 CrossRef CAS.
- T. Alqahtani, M. D. Khan, D. J. Kelly, S. J. Haigh, D. J. Lewis and P. O'Brien, J. Mater. Chem. C, 2018, 6, 12652–12659 RSC.
- V. Kaltenhauser, T. Rath, W. Haas, A. Torvisco, S. K. Müller, B. Friedel, B. Kunert, R. Saf, F. Hofer and G. Trimmel, J. Mater. Chem. C, 2013, 1, 7825 RSC.
- S. Kharbish, E. Libowitzky and A. Beran, Eur. J. Mineral., 2009, 21, 325–333 CrossRef CAS.
- M. Medles, N. Benramdane, A. Bouzidi, K. Sahraou, R. Miloua, R. Desfeux and C. Mathie, J. Optoelectron. Adv. Mater., 2014, 16, 726–731 CAS.
- G. Wang and C. L. Cheung, Mater. Lett., 2012, 67, 222–225 CrossRef CAS.
- J. Ota, P. Roy, S. K. Srivastava, B. B. Nayak and A. K. Saxena, Cryst. Growth Des., 2008, 8, 2019–2023 CrossRef CAS.
- I. Zumeta-Dubé, J.-L. Ortiz-Quiñonez, D. Díaz, C. Trallero-Giner and V.-F. Ruiz-Ruiz, J. Phys. Chem. C, 2014, 118, 30244–30252 CrossRef.
- B. Minceva-Sukarova, M. Najdoski, I. Grozdanov and C. J. Chunnilall, J. Mol. Struct., 1997, 410–411, 267–270 CAS.
Footnote |
| † Electronic supplementary information (ESI) available. CCDC 1889653. For ESI and crystallographic data in CIF or other electronic format see DOI: 10.1039/c9ra01127g |
| This journal is © The Royal Society of Chemistry 2019 |