
 Open Access Article
 This Open Access Article is licensed under a Creative Commons Attribution-Non Commercial 3.0 Unported Licence
Comparative effects of mercury chloride and methylmercury exposure on early neurodevelopment in zebrafish larvae
Jun Zhu†
a,
Chundan Wang†a,
Xingsu Gaoa,
Jiansheng Zhub,
Li Wanga,
Shuyuan Caoa,
Qian Wua,
Shanlei Qiao*a,
Zhan Zhang *a and
Lei Li*a
*a and
Lei Li*a
aCenter for Global Health, School of Public Health, Nanjing Medical University, 101 Longmian Avenue, Nanjing, Jiangsu 211166, P. R. China. E-mail: drleili@hotmail.com; zhanzhang@njmu.edu.cn; alexqiao@139.com; Fax: +86-25-8686-8499; Tel: +86-25-8686-8402 Tel: +86-25-8686-8404
bKey Lab of Modern Toxicology of Ministry of Education, School of Public Health, Nanjing Medical University, 101 Longmian Avenue, Nanjing, Jiangsu 211166, P. R. China
First published on 5th April 2019
Abstract
Mercury (Hg) is a ubiquitous environmental toxicant with important public health implications. Hg causes neurotoxicity through astrocytes, Ca2+, neurotransmitters, mitochondrial damage, elevations of reactive oxygen species and post-translational modifications. However, the similarities and differences between the neurotoxic mechanisms caused by different chemical forms of Hg remain unclear. Zebrafish embryos were exposed to methylmercury (MeHgCl) or mercury chloride (HgCl2) (0, 4, 40, 400 nM) up for 96 h. HgCl2 exposure could significantly decrease survival rate, body length and eye size, delay the hatching period, induce tail bending and reduce the locomotor activity, and these effects were aggravated in the MeHgCl group. The compounds could increase the number of apoptotic cells in the brain and downregulate the expression of Shha, Ngn1 and Nrd, which contribute to early nervous development. The underlying mechanisms were investigated by metabolomics data. Galactose metabolism, tyrosine metabolism and starch and sucrose metabolism pathways were disturbed after HgCl2 or MeHgCl exposure. In addition, the levels of three neurotransmitters including tyrosine, dopamine and tryptophan were reduced after HgCl2 or MeHgCl exposure. Oxidative stress is related to metabolite changes, such as changes in the putrescine, niacinamide and uric acid contents in the HgCl2 group, and squalene in the MeHgCl group. These data indicated that downregulation of these genes and abnormal metabolic profile and pathways contribute to the neurotoxicity of HgCl2 and MeHgCl.
1. Introduction
Mercury (Hg) is severely detrimental to organisms and is ubiquitous in both terrestrial and aquatic ecosystems.1 It is released from a variety of anthropogenic, industrial processes, enters the Earth's atmosphere and is re-deposited onto the Earth's surface in rainfall.2 In natural systems, mercury is found in elemental, inorganic, and organometallic forms. The environmental emission of mercury could reach up to 8900 tons annually, of which 90% consist of anthropogenic emissions from processes such as artisanal gold mining.3 Unfortunately, China is the largest emitter of Hg, responsible for 25% of the world's mercury emissions.4 Estimated annual sedimentary fluxes of mercury in the East China Sea are 5.1 × 10⁷ g, which accounts for 9% of China's annual mercury emissions.5 A recent study has shown that the concentration of total Hg in untreated sewage was as high as 15 ± 4.4 μg L−1 and MeHg concentration was 17 ± 1.8 ng L−1 in Tibet, China.6 Worse still, it can bioaccumulate through the food chain. The concentrations of total Hg and MeHg were 0.5–272 ng g−1 and 0.1–199 ng g−1 (wet weight) in fish muscle from the Three Gorges Reservoir, respectively.7 The concentration of MeHg in fresh shellfish was 0.46–6.38 μg kg−1 in the typical coastal cities (Lianyungang and Yantai) in China.8Mercury is a well-known teratogenic and neurotoxin to wildlife and humans. However, the toxicity, absorption and distribution of mercury vary among different forms, such as the metallic element, inorganic salts and organic compounds.9 Among them, methylmercury (MeHg) has attracted much attention due to its strong toxicity and ability to pass through biofilms.10 Previous studies had shown on the mechanism of MeHg-induced neurotoxicity, such as astrocytes, Ca2+, neurotransmitters, mitochondrial damage, elevations of reactive oxygen species and post-translational modifications, etc.11 And inorganic mercury caused cell death by cytotoxicity and induction of apoptosis with a decreased number of neurons and astrocytes in the motor cortex.12 However, the interpretation of their neurotoxic mechanisms from metabolites was undefined.
Metabolomics is a rapidly evolving technology for identifying and quantifying all metabolites that are present in a biological sample and might provide mechanistic insights into the etiology of various psychiatric disorders.13 Metabolomics analysis indicated that paraquat exposure induced alteration in the metabolites, which may lead to oxidative stress and neurodegeneration along with movement disorder in Drosophil.14 The integration of metabolomics and oxidative stress endpoints allowed the identification of reduced glutathione as a first line of defense against Hg in fish.15 Nuclear magnetic resonance (NMR)-based metabolomics revealed that exposure of Hg metabolites reduced glutathione and its constituent amino acids, glutamate and glycine in fish.16 MeHg could also change metabolome, including lipid metabolism and neurotransmission in mouse brain and larval fish.17 Therefore, metabolomics is an efficient approach for pre-screening of environmental chemicals, such as Hg and MeHg, for their neurodegenerative potential with altered metabolism.
In recent years, larval stage zebrafish have been emerging as a standard vertebrate model in a number of fields, ranging from developmental biology to pharmacology and toxicology. It has been recognized as a privileged vertebrate model due to its small size, wide distribution, easy growth conditions offering the possibility to perform high-throughput analysis for metabolic profiling and relative genetic proximity to humans.18,19 The differences between the neurotoxic mechanisms caused by different chemical forms of Hg in zebrafish remain unclear. The present study integrated the metabolomics and conventional neurodevelopmental endpoints to reveal the neurotoxicity and related mechanism of HgCl2 and MeHg in zebrafish larvae.
2. Materials and methods
2.1. Reagents
Methylmercury chloride (MeHgCl, 95% purity) and N,O-bis(trimethylsilyl) trifluoroacetamide (BSTFA) were purchased from Sigma Aldrich (St. Louis, MO, USA). Mercury chloride (HgCl2, 95% purity) was obtained from Xiya Chemical Reagent Co., Ltd. (Shandong, China). HPLC grade acetonitrile and isopropanol were all purchased from Merck (Darmstadt, Germany). Deionized water was manufactured by Milli-Q50SP Reagent system (Millipore Corporation, MA, USA). The acridine orange (AO) kits and MS-222 reagent was obtained from YSY Biotech Co., Ltd. (Nanjing, China). Trizol reagent was obtained from Invitrogen (Carlsbad, CA, USA).2.2. Zebrafish maintenance and embryo collection
Adult wild-type zebrafish (AB strain) were obtained from Nanjing YSY Biotech Company Ltd. Adult fish were housed at 28 °C on a 14![[thin space (1/6-em)]](https://www.rsc.org/images/entities/char_2009.gif) :10 light–dark photoperiod under semi-static conditions with charcoal filtered water. Zebrafish embryos were procured from zebrafish adults of wild type strain. Embryos were collected from spawning adult fish after 0.5 hour post fertilization (hpf). Embryos from different adult pairs were pooled in order to avoid batch effects. After collection, embryos were rinsed in egg water and maintained at 28 ± 0.5 °C in an incubator until 6 hpf, at which time exposure was initiated.
:10 light–dark photoperiod under semi-static conditions with charcoal filtered water. Zebrafish embryos were procured from zebrafish adults of wild type strain. Embryos were collected from spawning adult fish after 0.5 hour post fertilization (hpf). Embryos from different adult pairs were pooled in order to avoid batch effects. After collection, embryos were rinsed in egg water and maintained at 28 ± 0.5 °C in an incubator until 6 hpf, at which time exposure was initiated.
2.3. Mercury preparation and exposure
This study was performed in strict accordance with the NIH guidelines for the care and use of laboratory animals (NIH publication no. 85-23 rev. 1985) and was approved by the Animal Care and Welfare Committee of Nanjing Medical University (Nanjing, China). MeHgCl and HgCl2 were initially dissolved in sterile deionized water to a concentration of 400 μM respectively and further diluted with embryo medium for zebrafish embryos exposure. All stock solutions were stored at 4 °C until used. Zebrafish embryos were exposed to different concentrations of MeHgCl or HgCl2 in 6-well plates. Briefly, normal embryos at 6 hpf were distributed randomly into well containing 30 mL of MeHgCl (0, 4, 40, 400 nM) or HgCl2 (0, 4, 40, 400 nM) solutions. Six independent experiments were performed with 60 embryos per experiment (total 360 embryos per group). After 24 h exposure to each concentration, all surviving embryos were transferred to fresh embryo medium without mercury. Survival and hatching rates of embryos and larvae were observed at intervals of 12 hpf up to 96 hpf. At 30 hpf, 20 larvae each group were collected for GC-TOF-MS analysis and 30 larvae each group were collected for polymerase chain reaction (PCR) detection. While locomotor activity measurement and analysis of apoptosis were performed for each group of 12 larvae at 96 hpf.2.4. Morphological analysis of developmental neurotoxicity
12 embryos per group were photographed from the side, and the central nervous system (CNS) anomalies were evaluated at 96 hpf according to the previously reported methods.20 Briefly, morphological analysis of neurotoxicity was performed by measuring body length and eye size. The body length was measured horizontally from the foremost mouth to the tip of the tail. The eye size was examined when both eyes were completely overlapped. All measurements were performed using Nikon optical microscope (Nikon SMZ18, Japan).2.5. Locomotor activity measurement
Locomotor activity was monitored and analyzed by Noldus system with Eth0VIsion XT software (DanioVisio, Noldus (Beijing) Information Technology Co., Ltd, Netherlands). Larval swimming behavior was monitored in response to dark-to-light transitions. The software program: firstly, giving the larval 5 min for adaptation period, then opening the automatic light to stimulate 10 min, dark 10 min, and the light and dark alternate process cycle 3 times. The data (frequency of movements, distance traveled, and total duration of movements) were collected every 20 s. Locomotor behavior was monitored in a total of 12 larvae each group.2.6. Analysis of apoptosis in brain using acridine orange (AO)
Zebrafish exposed for 95 hpf were transferred to an AO solution diluted to 5 μg mL−1 in embryo medium and incubated for 1 h without light. Subsequently, AO was removed and the zebrafish washed several times with fresh embryo medium were examined. Before examination, the larvae were anesthetized with 0.03% MS-222 for 1 min. Stained larvae were photographed under a fluorescent stereo microscope (Nikon SMZ18, Japan). The apoptotic cells appear overt bright spots.21 12 embryos per group were analyzed and the number of cells showing acridine orange positivity in the brain region was compared between groups.2.7. Total RNA isolation and quantitative real-time PCR analysis
Total RNA was extracted from 30 living zebrafish larvae (30 hpf) treated with HgCl2 or MeHgCl using Trizol reagent. The expression of early neurogenesis related genes were measured by real-time polymerase chain reaction (PCR). The primers were synthesized by GenScript Biotech Corp. (Nanjing, China): Sonic hedgehog a (Shha) (forward AGACCGAGACTCCACGACGC and reverse, TGCAGTCACTGGTGCGAACG), Neurogenin1 (Ngn1) (forward TGCACAACCTTAACGACGCATTGG and reverse, TGCCCAGATGTAGTTGTGAGCGAA) and Neuro D (Nrd) (forward CAGCAAGTGCTTCCTTTTCC and reverse, TAAGGGGTCCGTCAAATGAG) and β-actin (forward ATGGATGAGGAAATCGCTGCC and reverse, CTCCCTGATGTCTGGGTCGTC). PCR was performed in 10 μL reaction volume on a LightCycler® 96 Detection System (Roche Diagnostics (Shanghai) Ltd., Switzerland).2.8. Sample preparation and GC-TOF-MS analysis
At 30 hpf, 20 larvae per replicate were strained and washed several times with egg water to remove any bound particulates or chemical residues attached to body surfaces. Next, the 20 larvae were transferred into 1.5 mL centrifuge tubes and chilled on ice to anesthetize and suppress enzymatic activity. 10 μL of the two internal standard, p-chlorophenylalanine (0.1 mg L−1) and heptadecanoic acid (1 mg mL−1), as well as 1 mL of the cold extraction solvent (acetonitrile:isopropanol:water, 3:3:2; v/v/v) mixture was added to each sample on ice. The tubes were vortexed for 30 s. Afterwards, the sample was homogenized in a ball mill for 30 min at 30 hz while being incubated in ice water. 150 μL liquid from each tube was pooled as quality control (QC) solution after centrifugation at 13000 rpm for 15 min at 4 °C. Then, an aliquot of 800 μL of supernatant was transferred into a fresh 2 mL GC-TOF-MS glass vial and dried in a vacuum concentrator. The residue was derivatized by addition of 80 μL of methoxyamine hydrochloride (15 mg mL−1 in pyridine) incubated for 90 min at 37 °C, followed by the addition of 50 μL BSTFA and incubated for 60 min at 70 °C.
According to previous study,22 trimethylsilyl derivatives can be stable for 30 h after derivatization. 1 μL of solution was immediately injected into an Agilent 7890 gas chromatograph system (Agilent Corporation, Santa Clara, CA, USA) coupled with a Leco Pegasus time-of-flight mass spectrometer (GC-TOF-MS) in splitless mode. The system was equipped with a DB-5MS capillary column (30 m × 0.25 mm inner diameter, 0.25 μm film thickness; J&W Scientific, Folsom, CA, USA). Helium was used as the carrier gas, with a constant flow rate of 1 mL min−1. The temperature program was set up as follows: the initial temperature was kept at 50 °C for 2 min, then elevated to 180 °C at a rate of 10 °C min−1, then elevated to 240 °C at a rate of 5 °Cmin−1, then elevated to 290 °C at a rate of 25 °Cmin−1 and sustained for 10 min at 290 °C. The temperatures of the injector, transfer line and ion source were set to 270, 260 and 240 °C, respectively. A mass range of 50–550 m/z in full-scan mode for electron impact ionization (70 eV) was applied. The solvent delay time was set to 7.33 min.
2.9. Statistical analyses
The differences in toxic effects, morphological alterations related to developmental neurotoxicity, gene expression and metabolite change were analyzed using one-way analysis of variance (ANOVA) by SPSS 13.0 software (Chicago, IL, USA). The Chroma TOF4.3X software of LECO Corporation and LECO-Fiehn Rtx5 database were used for raw peak extracting, data baselines filtering and calibration of the baseline, peak alignment, deconvolution analysis, peak identification and integration of the peak area. The statistical significance was calculated using the Student t-test. Metabolic data were analyzed using R to screen for metabolic differences. Differences were considered statistically significant at P ≤ 0.05, after a fdr correction by “BH” method. R package “pheatmap” is used to draw heat maps. The free web-based tool MetaboAnalyst 4.0 uses a high-quality KEGG metabolic pathway (Danio rerio) database as a back-end knowledge base for pathway analysis and visualization (http://www.metaboanalyst.ca).3. Results
3.1. Effects of HgCl2 and MeHgCl on the embryonic development in zebrafish
The survival rate significantly decreased at 48 hpf when the zebrafishes were exposed to 400 nM HgCl2 or 40 nM MeHgCl. At 96 hpf, survival rate in 400 nM HgCl2 and 400 nM MeHgCl were 77.54 ± 4.53% (P = 0.0009) and 75.36 ± 5.02% (P = 0.0003) of control, respectively. There were about 5% dead in the control group at 96 hpf (Fig. 1A). 400 nM HgCl2 and 40 nM MeHgCl could significantly delay the zebrafish hatching at 60 hpf and 72 hpf (Fig. 1B). The tail bending was observed in 40 nM HgCl2 and 40 nM MeHgCl at 96 hpf (Fig. 1C). The body length in 400 nM HgCl2 and 400 nM MeHgCl group were 87.58 ± 7.2% (P = 0.0001) and 92.16 ± 9.50% (P = 0.0001) of control, respectively (Fig. 1D). The eye size decreased significantly to 64.79 ± 12.02% (P = 0.0001) and 75.96 ± 15.86% (P = 0.0001) in 400 nM HgCl2 and 400 nM MeHgCl, respectively (Fig. 1E).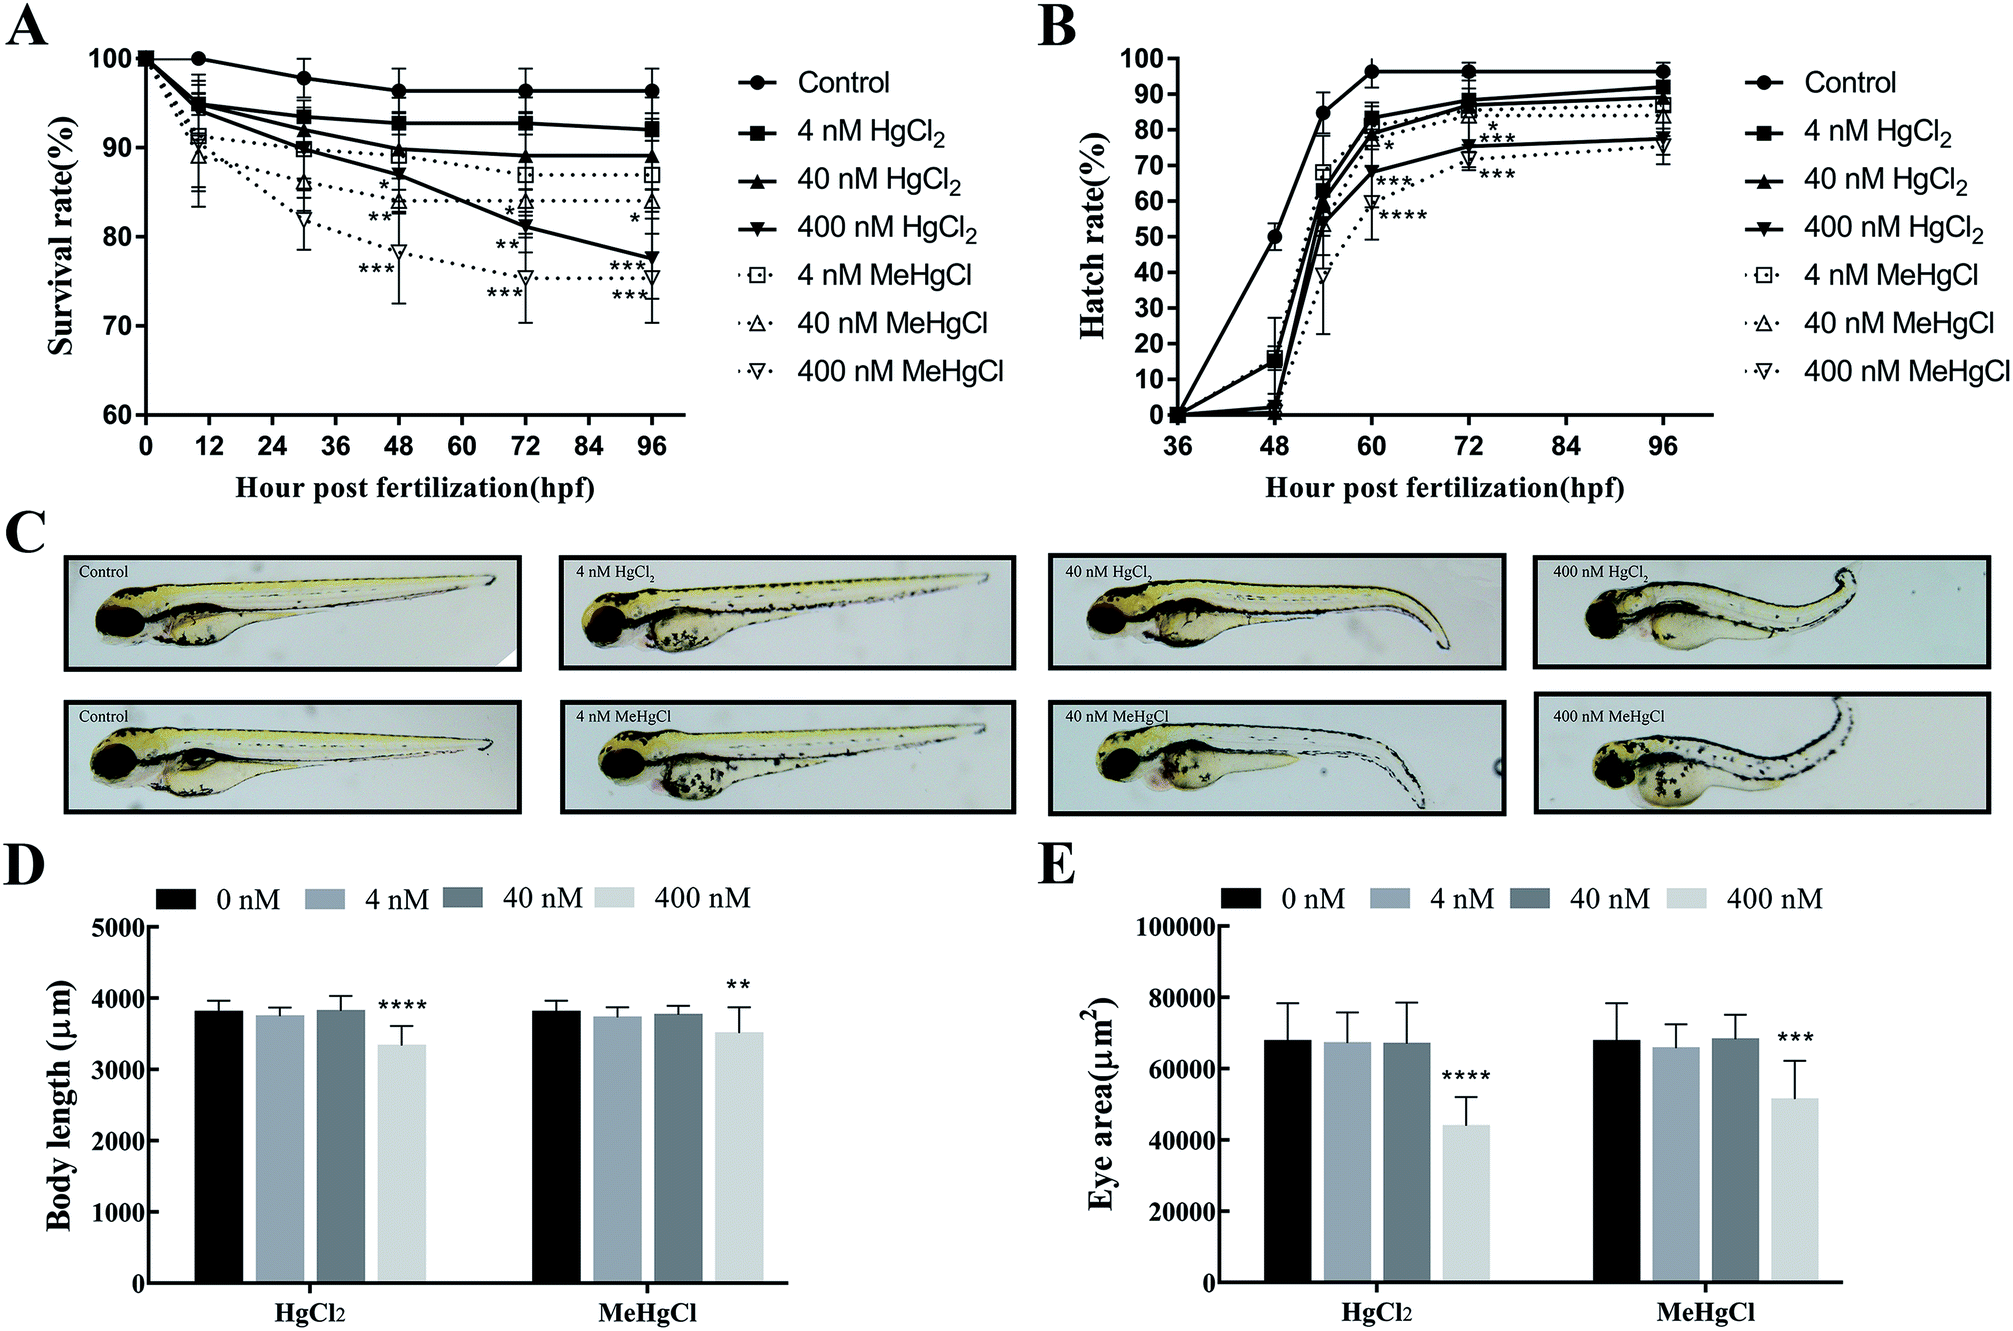 | ||
| Fig. 1 Effects of mercury chloride (HgCl2) and methylmercury chloride (MeHgCl) on the embryonic development. Zebrafish embryos were exposed to MeHgCl (control, 4, 40, 400 nM) and HgCl2 (control, 4, 40, 400 nM) for up to 96 hpf. (A) Survival rates, (B) hatching rates, (C) morphological abnormalities, (D) body length, (E) eye size of embryos were investigated. Data represent the mean ± SD of three experiments. *P < 0.05; **P < 0.01, ***P < 0.001, ****P < 0.0001; compared with control group. | ||
3.2. Effects of HgCl2 and MeHgCl on the locomotor activity of zebrafish
MeHgCl exposure could significantly decrease the average moving distance, while this effect was not observed after HgCl2 exposure (Fig. 2A and C). The trajectory disturbance was observed in HgCl2 or MeHgCl group at the concentration of 40 nM or 400 nM, reflecting increased traces in the middle area (Fig. 2B). | ||
| Fig. 2 Effects of mercury chloride (HgCl2) and methylmercury chloride (MeHgCl) on the locomotor activity. The embryos/larvae were exposed to MeHgCl (control, 4, 40, 400 nM) or HgCl2 (control, 4, 40, 400 nM), and their locomotor behavior were analyzed by the dark-light-dark photoperiod stimulation test at 96 hpf. (A) Average moving distance, (B) locomotor traces chart, (C) locomotor traces. *P < 0.05; **P < 0.01; compared with control group. | ||
3.3. Effects of HgCl2 and MeHgCl on brain cell apoptosis and the expression of neural development related genes
Acridine orange staining was performed to detect the apoptosis in the brain. 8.25 ± 1.86 positive cells were detected in control. There were 20.08 ± 3.68 and 27.5 ± 6.43 positive cells in the brain of zebrafish exposed to 40 nM and 400 nM HgCl2, respectively. Compared with HgCl2, 400 nM MeHgCl induced more apoptotic cell (34.42 ± 6.16) (Fig. 3A and B). The expression of Shh, Ngn1 and Nrd were significantly downregulated by HgCl2 and MeHgCl even at 4 nM (Fig. 3C–E).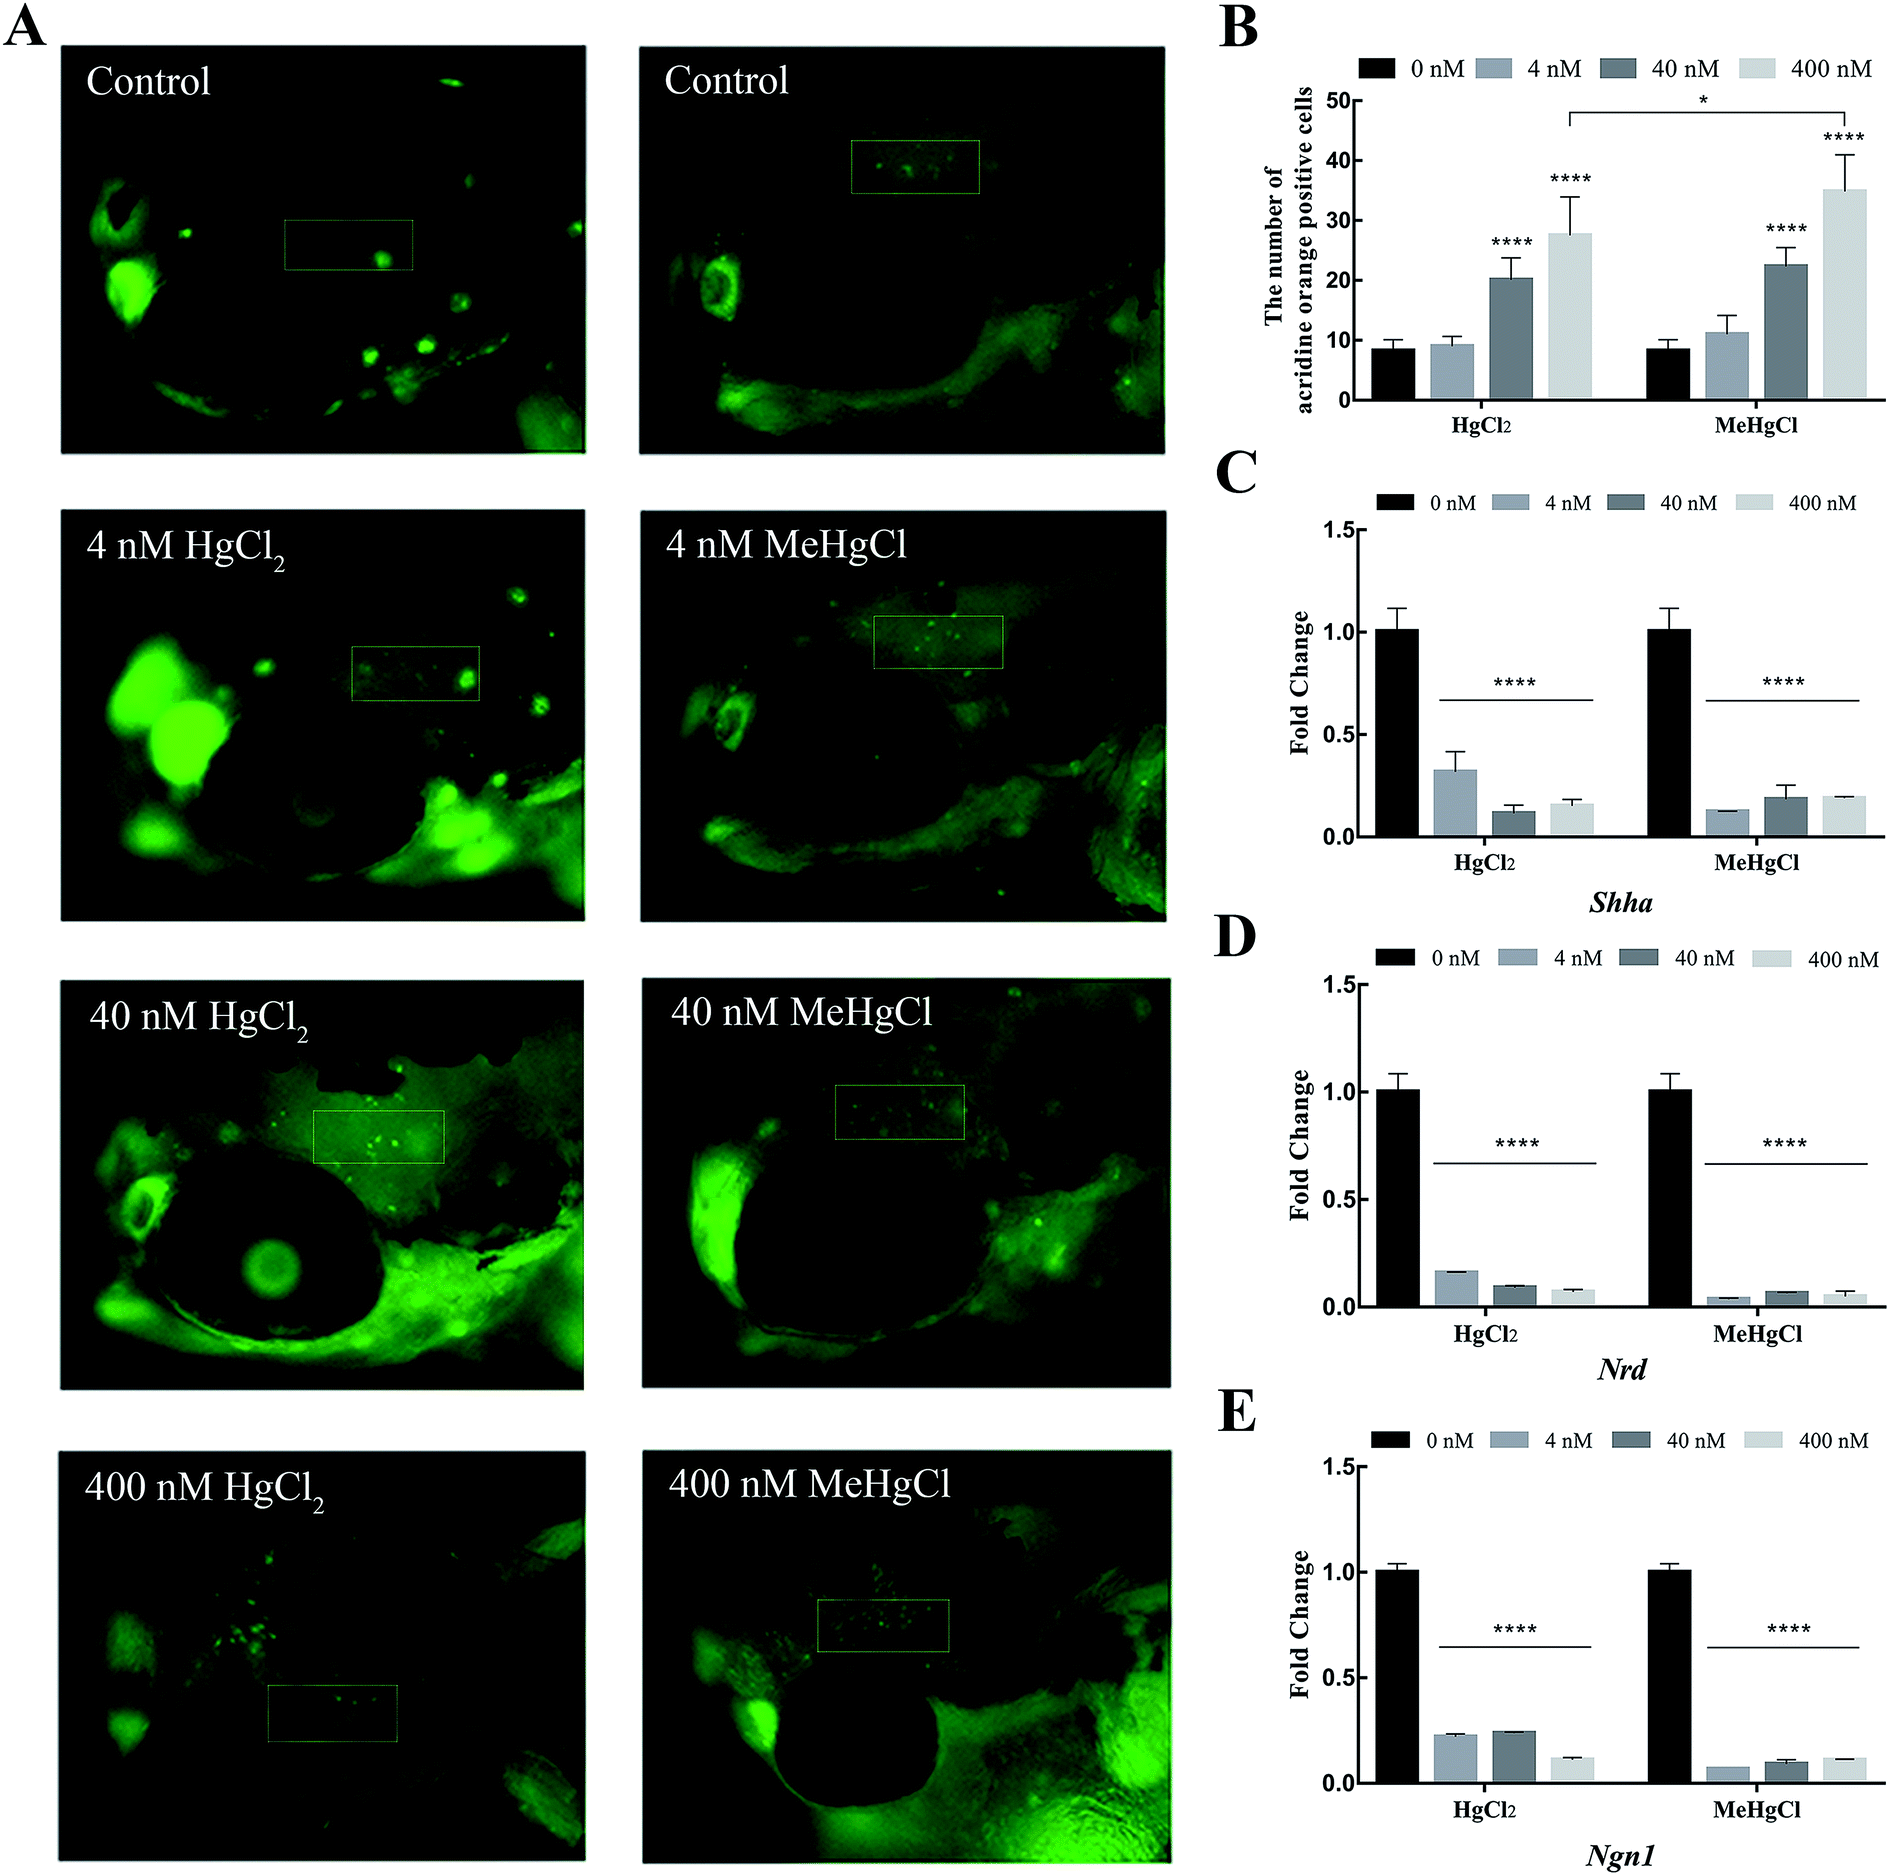 | ||
| Fig. 3 Effects of mercury chloride (HgCl2) and methylmercury chloride (MeHgCl) on brain cell apoptosis and the expression of neural development related genes. The embryos/larvae were exposed to MeHgCl (control, 4, 40, 400 nM) or HgCl2 (control, 4, 40, 400 nM), and the apoptotic cells in the brain were analyzed by acridine orange (AO) staining at 96 hpf. (A) Representative images of AO staining and (B) the number of AO positive cells in brain. n = 12 embryos per group. The expression of (C) Shha, (D) Ngn1 and (E) Nrd in the zebrafish treated with HgCl2 and MeHgCl for 30 hpf. Data represent the mean ± SD. **P < 0.01, ***P < 0.001, ****P < 0.0001; compared with control group. | ||
3.4. Metabolite profile changes
There 2369 metabolite peaks were routinely identified in extracted zebrafish embryo samples. After deleting RSD > 30% in QC samples and the unnamed peak, 15 metabolites were identified (P < 0.05) significantly different between 40 nM HgCl2 and control group, and 13 significantly different metabolite peaks in 40 nM MeHgCl group (Table 1). The heatmap was developed based on normalized data using autoscale features for standardization (Fig. 4A and B). Pathway analysis revealed perturbation of five main pathways by HgCl2, including (i) galactose metabolism, (ii) tyrosine metabolism, (iii) starch and sucrose metabolism (iv) phenylalanine, tyrosine and tryptophan biosynthesis and (v) alpha-linolenic acid metabolism. And for MeHgCl, (i) tyrosine metabolism, (ii) starch and sucrose metabolism, (iii) galactose metabolism (iv) sphingolipid metabolism and (v) arachidonic acid metabolism (Fig. 4C and D) were disturbed. The 8 metabolites (L-tyrosine, dopamine, L-tryptophan, sphingosine, arachidonic acid, melibiose, sucrose, gentisic acid) were found in both groups (Table 1). Among them, tyrosine (Fig. 4E), dopamine (Fig. 4F) and tryptophan (Fig. 4G) were associated with the neurotransmitter system. In addition, uric acid, putrescine, docosahexaenoic acid, D-ribulose 5-phosphate, alpha-linolenic acid, niacinamide, and D-glucose were significantly changed upon HgCl2 exposure; while L-dopa, urea, squalene, eicosapentaenoic acid and D-maltose were significantly changed in MeHgCl group.| Metabolites | 40 nM HgCl2 vs. control | 40 nM MeHgCl vs. control | ||||||
|---|---|---|---|---|---|---|---|---|
| Fold | p | q | Corresponding metabolic pathway | Fold | p | q | Corresponding metabolic pathway | |
| a q: corrected P value by the “BH” method. | ||||||||
| L-Tyrosine | 0.65 | 0.042 | 0.042 | Phenylalanine, tyrosine and tryptophan biosynthesis/phenylalanine metabolism/aminoacyl-tRNA biosynthesis | 0.31 | 0.004 | 0.041 | Phenylalanine, tyrosine and tryptophan biosynthesis/phenylalanine metabolism/aminoacyl-tRNA biosynthesis |
| Dopamine | 0.64 | 0.002 | 0.037 | Tyrosine metabolism | 0.56 | 0.040 | 0.046 | Tyrosine metabolism |
| L-Tryptophan | 0.75 | 0.015 | 0.042 | Tyrosine metabolism/ubiquinone and other terpenoid-quinone biosynthesis/aminoacyl-tRNA biosynthesis/tryptophan metabolism | 0.61 | 0.015 | 0.042 | Tryptophan metabolism/aminoacyl-tRNA biosynthesis |
| Sphingosine | 1.59 | 0.017 | 0.042 | Sphingolipid metabolism | 2.41 | 0.021 | 0.042 | Sphingolipid metabolism |
| Arachidonic acid | 1.31 | 0.021 | Biosynthesis of unsaturated fatty acids/arachidonic acid metabolism | 1.94 | 0.037 | 0.046 | Biosynthesis of unsaturated fatty acids/arachidonic acid metabolism | |
| Melibiose | 1.07 | 0.025 | 0.042 | Galactose metabolism | 1.14 | 0.042 | 0.046 | Galactose metabolism |
| Sucrose | 1.07 | 0.025 | 0.042 | Galactose metabolism/starch and sucrose metabolism | 1.14 | 0.042 | 0.046 | Starch and sucrose metabolism/galactose metabolism |
| Gentisic acid | 0.82 | 0.048 | 0.059 | Tyrosine metabolism | 0.72 | 0.035 | 0.046 | Tyrosine metabolism |
| Uric acid | 0.54 | 0.004 | 0.037 | Purine metabolism | 0.71 | 0.390 | 0.468 | — |
| Putrescine | 0.63 | 0.006 | 0.037 | Glutathione metabolism/arginine and proline metabolism | 0.58 | 0.170 | 0.339 | — |
| Docosahexaenoic acid | 1.44 | 0.007 | 0.037 | Biosynthesis of unsaturated fatty acids | 1.56 | 0.056 | 0.056 | — |
| D-Ribulose 5-phosphate | 0.70 | 0.012 | 0.042 | Pentose and glucuronate interconversions | 1.20 | 0.260 | 0.390 | — |
| Alpha-linolenic acid | 0.81 | 0.019 | 0.042 | Biosynthesis of unsaturated fatty acids/alpha-linolenic acid metabolism | 0.84 | 0.154 | 0.339 | — |
| Niacinamide | 0.83 | 0.023 | 0.042 | Nicotinate and nicotinamide metabolism | 0.78 | 0.069 | 0.339 | — |
| D-Glucose | 0.88 | 0.031 | 0.042 | Galactose metabolism/starch and sucrose metabolism | 0.15 | 0.960 | 0.960 | — |
| L-Dopa | 1.54 | 0.119 | 0.133 | — | 2.19 | 0.006 | 0.041 | Tyrosine metabolism |
| Urea | 1.38 | 0.109 | 0.130 | — | 1.56 | 0.013 | 0.042 | Arginine and proline metabolism/purine metabolism |
| Squalene | 1.26 | 0.587 | 0.587 | — | 0.81 | 0.019 | 0.042 | Steroid biosynthesis |
| Eicosapentaenoic acid | 1.09 | 0.110 | 0.130 | — | 1.20 | 0.021 | 0.042 | Biosynthesis of unsaturated fatty acids |
| D-Maltose | 1.10 | 0.184 | 0.194 | — | 1.21 | 0.026 | 0.045 | Starch and sucrose metabolism |
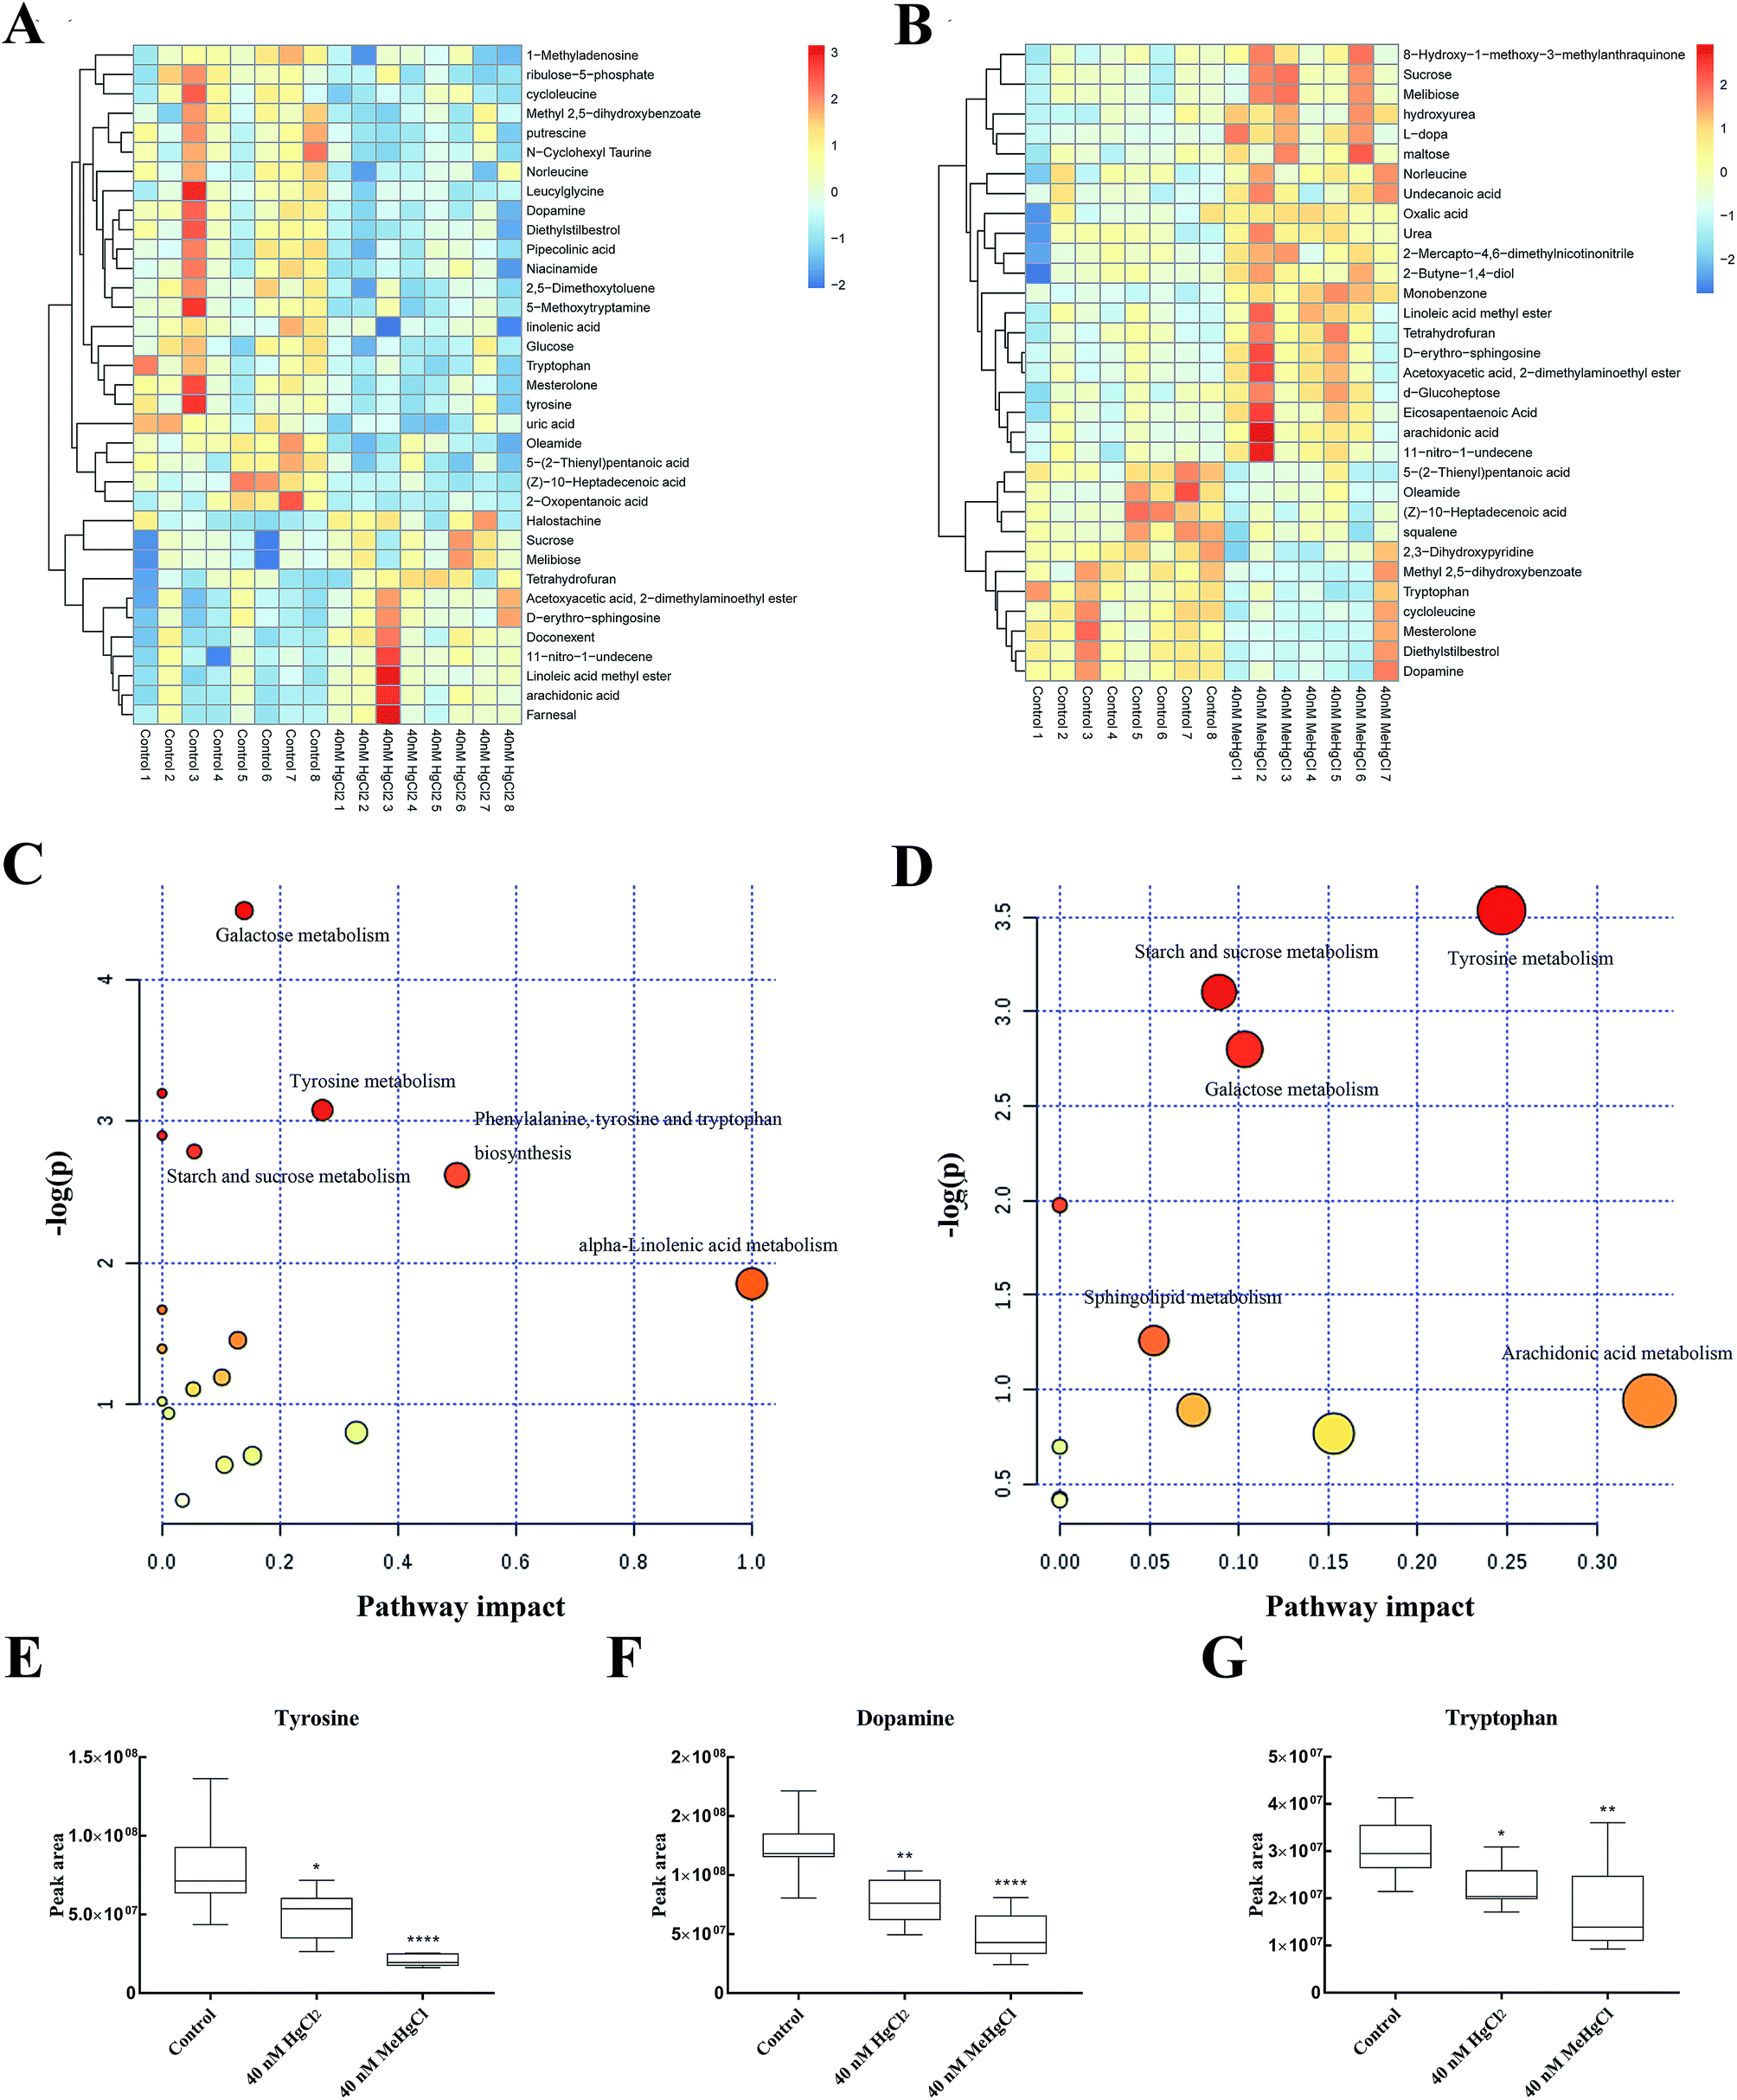 | ||
| Fig. 4 Effects of mercury chloride (HgCl2) and methylmercury chloride (MeHgCl) on the metabolic profile. Heat map and hierarchical clustering analyses of zebrafish exposed to 40 nM of HgCl2 (A) and MeHgCl (B). Red colour represents an upregulation of the metabolite while blue color represents a downregulation. Relevant pathways disturbed by HgCl2 (C) and MeHgCl (D). Bubble area is proportional to the impact of each pathway, with color denoting the significance from highest in red to lowest in white. Peak area of different metabolites across the different exposure groups at 30 hpf. The effect of HgCl2 and MeHgCl on (E) tyrosine, (F) dopamine, (G) tryptophan. Bars represent mean values (n = 8) and error bars represent standard deviations. *P < 0.05, **P < 0.01; compared with control group. | ||
4. Discussion
Mercury (Hg) is ubiquitary, naturally enriched in volcanic regions, and has wide applications in science, industry, and agriculture. MeHgCl and HgCl2 are potent neurotoxins which present considerable risk to the health of marine food chains. MeHg is the main mercury species in fish, normally accounting for 90%.7 Relatively low total Hg and MeHg concentrations were found in the majority of the white rice samples from 15 provinces across China with an overall mean of 4.74 μg kg−1 and 0.682 μg kg−1, respectively.23 The MeHg levels of the fish samples from Hongkong ranged from <2–1498.7 ng g−1, and the median estimated MeHg intake for children and mothers were 0.29 and 0.22 μg per kg bw per week, respectively.24 The concentration of total Hg in blood of bottlenose dolphins was 63.9 ± 34.0 μg L−1 (319.5–489.5 nM),2 which is near to 400 nM, the maximum dose in this study.Numerous of evidence indicates that embryonic exposure to mercury can produce detrimental effects on neurocognitive functions in the children from infancy to adolescence.25 Neurotoxicity caused by different forms of mercury included the alteration of lipid peroxidation (LPO), Na+/K+-ATPase activities, and nitric oxide (NOx) in the brain tissues from developing offspring mice.26 However, few studies compare the differences between the two. In the present study, zebrafish larvae was exposed to HgCl2 or MeHgCl for up to 96 h. Both HgCl2 and MeHgCl exposure could decrease the survival rate, hatching rate and body length. MeHgCl, but not Hg could significantly decreased the locomotor activity, reflecting more developmental toxicity than Hg in zebrafish. In addition, both HgCl2 and MeHgCl increased the apoptotic cells in zebrafish brain and downregulated the expression of Shha, Ngn1 and Nrd, which regulate proliferation, differentiation and migration of neural progenitor and precursor cells. Then, metabolomics data was used to investigate metabolic signatures and underlying mechanism of neurotoxicity of mercury exposure.
In this study, both MeHgCl and HgCl2 could impair the embryonic development and locomotor activity, suggesting their neurotoxicity. This is supported by findings from another study where embryonic MeHg exposure induced learning impairments, persisting for at least three generations.27 Assessment of the developmental neurotoxicity of compounds by measuring locomotor activity in zebrafish embryos and larvae has become an alternative to developmental neurotoxicity testing.28 Although the nanomolar concentration of HgCl2 and MeHgCl used in this study, they show embryonic developmental toxicity. These development and locomotor activity data show that HgCl2 and MeHgCl may increase the permeability barrier and penetrate the chorion, which protect the developing embryo from the environmental toxins.28 In this study, MeHgCl exposure induced more apoptotic cells in the brain than those of HgCl2 at the same concentration, indicating that MeHgCl was more neurotoxic than HgCl2. Absorbed MeHg is assimilated through the gastrointestinal barrier, then passes into the blood where it is distributed into target organs, mainly brain and muscle. Chronic consumption of MeHg contaminated fish can cause adverse health effects in humans, especially on the central nervous and immune systems.29 In contrast, inorganic mercury tends to be accumulated in detoxification organs (liver and kidney).30
Malformation is a common symptom in zebrafish exposed to environmental chemical exposure. Exposure of pyraoxystrobin triclosan or lead could result in malformed larvae exhibiting spinal curvature and bent tail.31,32 In the present study, exposure of HgCl2 or MeHgCl caused shortened body length, smaller eyes size and tail bending in zebrafish larvae. They also increased apoptotic cell in the brain, which may result in abnormal neurological development. The tail deformity is associated with early neurodevelopmental abnormalities.33 Furthermore, previous studies noted that increased apoptosis at this developmental stage is related to curled tail.34,35 In addition, abnormal neurological development may also impair the locomotor activity.36,37 Decreased movement distance after HgCl2 or MeHgCl exposure may result from abnormal neurological development induced tail bending.
To investigate the mechanism of neurotoxicity of HgCl2 and MeHgCl, the expression of three genes (Shha, Ngn1, Nrd) involving in early neural developmental stages was assessed. Shha controls key developmental processes, including neural tube patterns, neural stem cell proliferation, and survival of neurons and glial cells.38,39 Ngn is a marker for neuronal precursors and expressed in the central nervous system regulated by Shha.40 Ngn1 is expressed in the neural plate and can induce the expression of Nrd, which may in turn cause proliferative neural precursor cells to become post-mitotic neurons.33 Trimethyltin chloride could inhibit neuronal cell differentiation in zebrafish embryo neurodevelopment via upregulation of the expression of Shha and Ngn1.41 Aqueous cigarette tar extracts reduced the expression Nrd and affected cortical neuron development and neurodegeneration in human embryonic stem cells in vitro.42 In this study, HgCl2 and MeHgCl could significantly reduce the expression of Shha, Ngn1 and Nrd even at the concentration of 4 nM, suggesting that they could cause early developmental abnormalities of neurons and neural progenitors after exposure to the gastrula stage.
Characteristic metabolic deregulations of HgCl2 or MeHgCl exposure may enable novel mechanism discovery for their neurotoxicity. Galactose metabolism, tyrosine metabolism and starch and sucrose metabolism pathways were disturbed after HgCl2 or MeHgCl exposure. Phenylalanine, tyrosine and tryptophan biosynthesis pathway was also affected by HgCl2 exposure. Phenylalanine is a precursor of the amino acid tyrosine, which in turn causes the formation of neurotransmitters such as dopamine.43 Dopamine and serotonin are neuromodulators which contribute to associative learning performance in zebrafish.44 In the present study, dopamine and tyrosine were decreased in the HgCl2 or MeHgCl group, indicating that neurotransmitter production may be affected. HgCl2 or MeHgCl exposure also decreased tryptophan, which is a neurotransmitter system belonging to serotonin.45 Intraspinal serotonergic signaling suppresses locomotor activity in larval zebrafish and chemogenetic ablation of dopaminergic neurons leads to transient locomotor impairments in zebrafish larvae.46,47 Putrescine, niacinamide, uric acid, and squalene all can induce oxidative stress, which may cause apoptosis and nerve damage.13,48 But in HgCl2 group, putrescine, niacinamide, uric acid was observed changed, whereas squalene in MeHgCl.
5. Conclusions
Our study demonstrated that HgCl2 exposure could delay the hatching period, impair the locomotor activity and increase apoptotic brain cell number in the zebrafish larvae, and these effects were aggravated in MeHgCl group. Their neurotoxicity may result from downregulation of neural development related genes, including Shh, Ngn1 and Nrd. The metabolic profile showed that HgCl2 and MeHgCl could also disturb neuro-related tyrosine metabolism and phenylalanine, tyrosine and tryptophan biosynthesis. Furthermore, three neurotransmitters including tyrosine, dopamine and tryptophan were reduced after HgCl2 or MeHgCl exposure. Oxidative stress related to metabolite changes, such as putrescine, niacinamide, uric acid in HgCl2 group, whereas squalene in MeHgCl. However, specific toxicological mechanisms of neurodevelopmental disorder induced by HgCl2 and MeHgCl need further explanation.Conflicts of interest
The authors declare that there are no conflicts of interest.Acknowledgements
This work was supported by the National Natural Science Foundation of China (81673228), and a project funded by the Priority Academic Program Development of Jiangsu Higher Education Institutions (2014).References
- Q. Shi, N. Sun, H. Kou, H. Wang and H. Zhao, Ecotoxicol. Environ. Saf., 2018, 164, 500–509 CrossRef CAS PubMed.
- J. S. Reif, A. M. Schaefer and G. D. Bossart, Vet. Sci., 2015, 2, 407–422 CrossRef PubMed.
- L. The, Lancet, 2017, 390, 822 Search PubMed.
- S. Liang, Y. Wang, S. Cinnirella and N. Pirrone, Environ. Sci. Technol., 2015, 49, 3566–3574 CrossRef CAS PubMed.
- A. Dong, S. Zhai, P. Louchouarn, G. Izon, H. Zhang and X. Jiang, Environ. Sci. Pollut. Res. Int., 2019, 26, 4667–4679 CrossRef PubMed.
- M. Liu, P. Du, C. Yu, Y. He, H. Zhang, X. Sun, H. Lin, Y. Luo, H. Xie, J. Guo, Y. Tong, Q. Zhang, L. Chen, W. Zhang, X. Li and X. Wang, Environ. Sci. Technol., 2018, 52, 124–134 CrossRef CAS PubMed.
- Q. Xu, L. Zhao, Y. Wang, Q. Xie, D. Yin, X. Feng and D. Wang, Environ. Pollut., 2018, 243, 115–126 CrossRef CAS PubMed.
- P. Li, Y. Pan, Y. Fang, M. Du, F. Pei, F. Shen, B. Xu and Q. Hu, Food Chem., 2019, 278, 587–592 CrossRef CAS PubMed.
- M. Korbas, T. C. Macdonald, I. J. Pickering, G. N. George and P. H. Krone, ACS Chem. Biol., 2012, 7, 411–420 CrossRef CAS PubMed.
- C. C. Bridges and R. K. Zalups, Arch. Toxicol., 2017, 91, 63–81 CrossRef CAS PubMed.
- T. Ke, F. M. Goncalves, C. L. Goncalves, A. A. Dos Santos, J. B. T. Rocha, M. Farina, A. Skalny, A. Tsatsakis, A. B. Bowman and M. Aschner, Biochim. Biophys. Acta, Mol. Basis Dis., 2018 DOI:10.1016/j.bbadis.2018.10.024.
- F. B. Teixeira, A. C. A. de Oliveira, L. K. R. Leao, N. C. F. Fagundes, R. M. Fernandes, L. M. P. Fernandes, M. C. F. da Silva, L. L. Amado, F. E. S. Sagica, E. H. C. de Oliveira, M. E. Crespo-Lopez, C. S. F. Maia and R. R. Lima, Front. Mol. Neurosci., 2018, 11, 125 CrossRef PubMed.
- G. Nedic Erjavec, M. Konjevod, M. Nikolac Perkovic, D. Svob Strac, L. Tudor, C. Barbas, T. Grune, N. Zarkovic and N. Pivac, Redox Biol., 2018, 14, 178–186 CrossRef CAS PubMed.
- A. K. Shukla, C. Ratnasekhar, P. Pragya, H. S. Chaouhan, D. K. Patel, D. K. Chowdhuri and M. K. R. Mudiam, Mol. Neurobiol., 2016, 53, 254–269 CrossRef CAS PubMed.
- F. Brandao, T. Cappello, J. Raimundo, M. A. Santos, M. Maisano, A. Mauceri, M. Pacheco and P. Pereira, Metallomics, 2015, 7, 1352–1363 RSC.
- T. Cappello, F. Brandao, S. Guilherme, M. A. Santos, M. Maisano, A. Mauceri, J. Canario, M. Pacheco and P. Pereira, Sci. Total Environ., 2016, 548–549, 13–24 CrossRef CAS PubMed.
- K. N. Bridges, Y. Zhang, T. E. Curran, J. T. Magnuson, B. J. Venables, K. E. Durrer, M. S. Allen and A. P. Roberts, Environ. Sci. Technol., 2018, 52, 8774–8784 CrossRef CAS PubMed.
- M. M. Santoro, Trends Endocrinol. Metab., 2014, 25, 546–554 CrossRef CAS PubMed.
- M. Kamel and N. Ninov, Curr. Opin. Pharmacol., 2017, 37, 41–50 CrossRef CAS PubMed.
- M. Zoupa and K. Machera, Int. J. Mol. Sci., 2017, 18, E817 CrossRef PubMed.
- C. Zeng, H. Sun, P. Xie, J. Wang, G. Zhang, N. Chen, W. Yan and G. Li, Aquat. Toxicol., 2014, 149, 25–32 CrossRef CAS PubMed.
- P. Begley, S. Francis-McIntyre, W. B. Dunn, D. I. Broadhurst, A. Halsall, A. Tseng, J. Knowles, H. Consortium, R. Goodacre and D. B. Kell, Anal. Chem., 2009, 81, 7038–7046 CrossRef CAS PubMed.
- H. Zhao, H. Yan, L. Zhang, G. Sun, P. Li and X. Feng, Environ. Int., 2019, 126, 406–412 CrossRef CAS PubMed.
- P. H. Y. Chan, M. H. M. Chan, A. M. Li, R. C. K. Cheung, X. T. Yu and H. S. Lam, Environ. Res., 2018, 166, 418–426 CrossRef CAS PubMed.
- P. Grandjean and P. J. Landrigan, Lancet Neurol., 2014, 13, 330–338 CrossRef CAS PubMed.
- C. F. Huang, S. H. Liu, C. J. Hsu and S. Y. Lin-Shiau, Toxicol. Lett., 2011, 201, 196–204 CrossRef CAS PubMed.
- X. Xu, D. Weber, A. Martin and D. Lone, Neurotoxicol. Teratol., 2016, 53, 19–23 CrossRef CAS PubMed.
- I. W. Selderslaghs, J. Hooyberghs, R. Blust and H. E. Witters, Neurotoxicol. Teratol., 2013, 37, 44–56 CrossRef CAS PubMed.
- M. R. Karagas, A. L. Choi, E. Oken, M. Horvat, R. Schoeny, E. Kamai, W. Cowell, P. Grandjean and S. Korrick, Environ. Health Perspect., 2012, 120, 799–806 CrossRef CAS PubMed.
- S. Gentes, R. Maury-Brachet, C. Feng, Z. Pedrero, E. Tessier, A. Legeay, N. Mesmer-Dudons, M. Baudrimont, L. Maurice, D. Amouroux and P. Gonzalez, Environ. Sci. Technol., 2015, 49, 14560–14569 CrossRef CAS PubMed.
- C. Dou and J. Zhang, J. Hazard. Mater., 2011, 194, 277–282 CrossRef CAS PubMed.
- H. Li, S. Yu, F. Cao, C. Wang, M. Zheng, X. Li and L. Qiu, Ecotoxicol. Environ. Saf., 2018, 151, 1–9 CrossRef CAS PubMed.
- J. Kim, H. Oh, B. Ryu, U. Kim, J. M. Lee, C. R. Jung, C. Y. Kim and J. H. Park, Environ. Pollut., 2018, 236, 304–312 CrossRef CAS PubMed.
- T. Fukuda, A. Tokunaga, R. Sakamoto and N. Yoshida, Mol. Cell. Neurosci., 2011, 46, 614–624 CrossRef CAS PubMed.
- T. C. Tsai, C. C. Shih, H. P. Chien, A. H. Yang, J. K. Lu and J. H. Lu, BMC Dev. Biol., 2018, 18, 5 CrossRef PubMed.
- H. Tu, T. Peng, J. Liu, X. Chen, C. Fan, Z. Huang, Y. Zhang, F. Zou and X. Meng, Aquat. Toxicol., 2018, 194, 167–175 CrossRef CAS PubMed.
- B. Zhu, Q. Wang, X. Shi, Y. Guo, T. Xu and B. Zhou, Chemosphere, 2016, 144, 1646–1654 CrossRef CAS PubMed.
- A. Kim, C. Savary, C. Dubourg, W. Carre, C. Mouden, H. Hamdi-Roze, H. Guyodo, J. L. Douce and G. C. Frex Consortium, Brain, 2019, 142, 35–49 CrossRef PubMed.
- T. S. Corman, S. E. Bergendahl and D. J. Epstein, Development, 2018, 145, dev167379 CrossRef PubMed.
- M. B. Johnson, P. P. Wang, K. D. Atabay, E. A. Murphy, R. N. Doan, J. L. Hecht and C. A. Walsh, Nat. Neurosci., 2015, 18, 637–646 CrossRef CAS PubMed.
- J. Kim, C. Y. Kim, J. Song, H. Oh, C. H. Kim and J. H. Park, Neurotoxicol. Teratol., 2016, 54, 29–35 CrossRef CAS PubMed.
- A. N. Begum, J. S. Aguilar and Y. Hong, Environ. Res., 2017, 158, 194–202 CrossRef CAS PubMed.
- M. D. McCoole, N. J. Atkinson, D. I. Graham, E. B. Grasser, A. L. Joselow, N. M. McCall, A. M. Welker, E. J. Wilsterman Jr, K. N. Baer, A. R. Tilden and A. E. Christie, Comp. Biochem. Physiol., Part D: Genomics Proteomics, 2012, 7, 35–58 CAS.
- M. Naderi, A. Jamwal, D. P. Chivers and S. Niyogi, Behav. Brain Res., 2016, 303, 109–119 CrossRef CAS PubMed.
- C. Gomez-Canela, D. Tornero-Canadas, E. Prats, B. Pina, R. Tauler and D. Raldua, Anal. Bioanal. Chem., 2018, 410, 1735–1748 CrossRef CAS PubMed.
- J. E. Montgomery, S. Wahlstrom-Helgren, T. D. Wiggin, B. M. Corwin, C. Lillesaar and M. A. Masino, Dev. Neurobiol., 2018 DOI:10.1002/dneu.22606.
- R. Godoy, S. Noble, K. Yoon, H. Anisman and M. Ekker, J. Neurochem., 2015, 135, 249–260 CrossRef CAS PubMed.
- N. Wang, J. Wei, Y. Liu, D. Pei, Q. Hu, Y. Wang and D. Di, Biomarkers, 2016, 21, 449–457 Search PubMed.
Footnote |
| † These authors contributed equally to this work. |
| This journal is © The Royal Society of Chemistry 2019 |