 Open Access Article
Preparation and photocatalytic performance of tungstovanadophosphoric heteropoly acid salts
Dandan Ji *abc,
Rong Xuea,
Maojuan Zhoua,
Ying Zhud,
Fengshan Zhang*b and
Lihua Zang*a
aCollege of Environmental Science and Engineering, Qilu University of Technology (Shandong Academy of Science), Jinan, Shandong, China 250353. E-mail: zlh@qlu.edu.cn; jdd@qlu.edu.cn; Tel: +86 053189631680
bHuatai Group, Guangrao, Shandong, China 257335. E-mail: htjszx@163.com; Tel: +86 05467798857
cJiangsu Key Laboratory of Anaerobic Biotechnology, Jiangnan University, Wuxi, Jiangsu, China 214122
dAdvanced Material Institute, Qilu University of Technology (Shandong Academy of Science), Jinan, Shandong, China 250014
First published on 11th June 2019
Abstract
Tungstovanadophosphoric heteropoly acid H5PW10V2O40·5.76H2O (HPWV) has been synthesized via stepwise acidification and gradual addition of elements. Some metals like Fe, Al and Cu were introduced into the heteropoly acid (HPA) in the molar ratio of 10![[thin space (1/6-em)]](https://www.rsc.org/images/entities/char_2009.gif) :
:![[thin space (1/6-em)]](https://www.rsc.org/images/entities/char_2009.gif) 6, 10
6, 10![[thin space (1/6-em)]](https://www.rsc.org/images/entities/char_2009.gif) :
:![[thin space (1/6-em)]](https://www.rsc.org/images/entities/char_2009.gif) 6 and 10
6 and 10![[thin space (1/6-em)]](https://www.rsc.org/images/entities/char_2009.gif) :
:![[thin space (1/6-em)]](https://www.rsc.org/images/entities/char_2009.gif) 4 respectively. The prepared catalysts were characterized by UV, FTIR, TG/DTA and XRD. The results indicated that HPWV and its metal salts all contain Keggin units, which are the primary structures of the heteropoly acids. The homogeneous photocatalytic degradation of phenol by heteropoly acid salts was studied in detail under artificial UV irradiation and addition of hydrogen peroxide (H2O2), and the effects of initial phenol and H2O2 concentrations on the rate of photocatalytic phenol degradation were examined. The results suggested that the heteropoly acid salts showed good catalytic activities for phenol degradation via the ·OH radical mechanism. Under irradiation with a 10 W Hg lamp, 96% phenol was degraded within less than 60 min in the solution containing 50 mg L−1 phenol + 2 μmol L−1 Fe5(PW10V2O40)3 + 4 μmol L−1 H2O2, with the performance of the catalysts in order FePWV > AlPWV > CuPWV > HPWV. This work demonstrated that the photo-Fenton reaction catalyzed by the heteropoly acid salts was a promising advanced oxidation tool for the treatment of phenol-containing wastewater.
4 respectively. The prepared catalysts were characterized by UV, FTIR, TG/DTA and XRD. The results indicated that HPWV and its metal salts all contain Keggin units, which are the primary structures of the heteropoly acids. The homogeneous photocatalytic degradation of phenol by heteropoly acid salts was studied in detail under artificial UV irradiation and addition of hydrogen peroxide (H2O2), and the effects of initial phenol and H2O2 concentrations on the rate of photocatalytic phenol degradation were examined. The results suggested that the heteropoly acid salts showed good catalytic activities for phenol degradation via the ·OH radical mechanism. Under irradiation with a 10 W Hg lamp, 96% phenol was degraded within less than 60 min in the solution containing 50 mg L−1 phenol + 2 μmol L−1 Fe5(PW10V2O40)3 + 4 μmol L−1 H2O2, with the performance of the catalysts in order FePWV > AlPWV > CuPWV > HPWV. This work demonstrated that the photo-Fenton reaction catalyzed by the heteropoly acid salts was a promising advanced oxidation tool for the treatment of phenol-containing wastewater.
1. Introduction
Advanced oxidation processes (AOPs), defined as a set of tools that utilize radicals (for example ·OH, SO˙4− and so on)1 for oxidation, have received increasing attention in the degradation of bio-refractory organic compounds in wastewater treatment processes. AOPs can be classified into several categories, depending on the different reagent systems used for the generation of radicals, such as ultraviolet or visible radiation, catalytic ozonation, photocatalytic ozonation, photocatalytic oxidation and Fenton-like processes. Among different AOPs, Fenton and photo-Fenton oxidation processes are environmentally friendly because they do not involve the use of hazardous chemical reagents.2 In addition, these methods are easy to handle and can be operated with uncomplicated design reactors. In the last past few decades, the homogeneous-Fenton reaction has been considered to be one of the most efficient methods for the treatment of polluted water containing recalcitrant chemicals.3–6 The Fenton technique is based on an electron transfer between hydrogen peroxide and a homogeneous metal in solution, generally iron(II) (Fe2+), causing the formation of hydroxyl radicals.7 The reactions are described as follows:| Fe2+ + H2O2 → Fe3+ + OH− + ·OH (Fenton reaction), | (1) |
 | (2) |
The photo-Fenton method combined of UV irradiation and Fenton process, has been developed in order to improve the oxidation efficiency of the most recalcitrant organic compounds.8 In this process, the oxidation rate increases, leading to a higher degree of mineralization due to the enhanced production of ·OH radicals. Hydroxyl radicals are generated from the photo-decomposition of hydrogen peroxide and the decomposition of its iron-catalyst:9
| H2O2 + UV → ·OH + ·OH (photolysis of H2O2) | (3) |
| Fe2+ + H2O2 → Fe3+ + OH− + ·OH (photo-Fenton reaction) | (4) |
In the past few years, there has been significant research efforts in the search for alternative technologies for the photo-Fenton reagent for degradation of various organic pollutants and pathogens.10,11 Depending on the activity of the catalyst used, photo-Fenton catalytic degradation methods have been demonstrated to be one of the most innovative, green and efficient alternative treatments of organic wastewater. Numerous studies have reported on photo-Fenton reagents for dealing with different organic pollutants in batch experiments.12–16 Among these, recently, there has been growing interest in the use of nanoparticles as photocatalytic agents17–20
Heteropoly acids (HPAs) and their derivatives represent an increasingly important class of eco-catalysts for many organic reactions.21 HPAs are formed by inorganic metal–oxygen cluster anions and compounds with strong Brønsted acid characteristics and unique redox properties. The strong Brønsted acidity is caused by two main reasons: such as dispersion of the negative charge over lots of atoms of the polyanion and the fact that the negative charge is less distributed over its outer surface due to the double-bond character of the M–Od bond, polarizing the negative charge of Od to M.22 For HPA-catalyzed reactions, the conventional mechanism of Brønsted acid catalysis was widely accepted, including two catalysis types of surface and bulk. Generally, the catalytic activity of HPA may be higher, 3–100 times, than conventional organic and inorganic acids. In addition, HPAs salts are good water-tolerant hydrophobic solid catalysts as well as having biphasic reaction systems containing an aqueous phase. Taking advantage of these properties, the HPAs have been mainly applied as catalysts for acid catalysis and catalytic synthesis.23,24 More importantly, the use of heteropoly acids as catalysts is at the forefront of fundamental and applied catalysis.25 As a special class of multifunctional materials, heteropoly acids and their polyoxometalates have been payed considerable attention due to their important applications in a variety of fields such as nonlinear optics, magnetism, and medicine, and in particular as a catalyst material.26 Furthermore, their potential applications in fuel cells, electrochemical capacitors, and other electrochemical devices.27
In this paper, phosphotungstovanadic heteropoly acids with the formula H5PW10V2O40·5.76H2O were synthesized using the hydrothermal method. Fe5(PW10V2O40)3(FePWV), Al5(PW10V2O40)3(AlPWV), and Cu5(PW10V2O40)2(CuPWV) were obtained by doping H5PW10V2O40·5.76H2O with Fe, Al and Cu. Then, their performance and mechanism in the photo-Fenton reaction were investigated.
2. Materials and methods
2.1. Synthesis of H5PW10V2O40·5.76H2O
H5PW10V2O40·5.76H2O (HPWV) was synthesized by using a modification of the method described in previous study.28 A 20 mL aqueous solution of sodium phosphate (3.80 g, Na3PO4·12H2O) was added dropwise to an 80 mL aqueous solution of sodium tungstate (32.9 g, Na2WO4·2H2O). The pH value of the mixture was adjusted to 2.5. Ammonium molybdate (2.34 g, NH4VO3) was added to the mixture, and the pH was adjusted to 2.5 again. Then, the mixture was incessancy heated at 140 °C for 8 h. After cooling, the solution was extracted with ether (150 mL) in a sulphuric acid medium. The red-orange powder H5PW10V2O40·5.76H2O was obtained by vacuum drying to remove diethyl ether. The structure formation process of H5PW10V2O40·5.76H2O can be observed by X-ray diffraction methods in the water/dimethyl sulfoxide mixture (1![[thin space (1/6-em)]](https://www.rsc.org/images/entities/char_2009.gif) :
:![[thin space (1/6-em)]](https://www.rsc.org/images/entities/char_2009.gif) 1 by volume, 20 mL, at room temperature).
1 by volume, 20 mL, at room temperature).
2.2. Preparation of Fe5(PW10V2O40)3, Al5(PW10V2O40)3, Cu5(PW10V2O40)2
H5PW10V2O40·5.76H2O (1.6320 g) was dissolved in a flask with 20 mL of deionized water. Fe(NO3)3·9H2O (0.4040 g), Al(NO3)3·9H2O (0.3751 g), and Cu(NO3)2·3H2O (0.3768 g) were dissolved in 10 mL of deionized water and dropped into a flask at 80 °C.29 The solution was observed for changes in colors during the dissolution. When Fe(NO3)3·9H2O were added, the solution turned yellow, when Cu(NO3)2·3H2O were added, the solution turned dark green, and when Al(NO3)3·9H2O were added, there was no obvious color change. The resulting suspension was dried through evaporation at 80 °C to dryness to obtain the precursors of the Fe5(PW10V2O40)3(FePWV), Al5(PW10V2O40)3(AlPWV) and Cu5(PW10V2O40)2(CuPWV) catalysts.2.3. Degradation experiments and characterization
An immersed UV lamp (10 W 254 nm) was used in the experiment. The intensity of light irradiation was 202 μW cm−2, which was measured with a radiometer (Vilber-Lourmat) at 254 nm. The reaction temperature kept 25 ± 1 °C. The effects of initial phenol concentration, reaction time and dosage of H2O2 on the removal of TOC and phenol degradation were examined. Phenol and its degradation products were determined using a 15C HPLC with an SPD-15C UV-vis detector and an Inertsil/WondaSil C-18 reverse-phase chromatographic column (Shimadzu, Japan). The mobile phase was a mixture of water and acetonitrile (60![[thin space (1/6-em)]](https://www.rsc.org/images/entities/char_2009.gif) :
:![[thin space (1/6-em)]](https://www.rsc.org/images/entities/char_2009.gif) 40, v/v) at 1 mL min−1. The detection wavelength was 210 nm. TOC was measured using a Shimadzu TOC analyzer. FT-IR spectrum was recorded using an IR Prestige-21 FT/IR spectrometer (Shimadzu, Japan) over the 400–4000 cm−1 wavenumber range. The UV spectrum was determined using a TU-1810 PC UV-vis spectrophotometer. The X-ray powder diffraction (XRD) was obtained using a Bruker D8 ADVANCE X-ray diffractometer at 40 kV and 40 mA in the range of 2θ = 3–40° at a rate of 0.02° s−1. The thermal stability of the sample was performed using thermogravimetry (TG) methods from room temperature to 800 °C, which was conducted by a TGA Q50 in a nitrogen stream, with a scanning rate of 10 °C min−1. All reagents were analysis grade.
40, v/v) at 1 mL min−1. The detection wavelength was 210 nm. TOC was measured using a Shimadzu TOC analyzer. FT-IR spectrum was recorded using an IR Prestige-21 FT/IR spectrometer (Shimadzu, Japan) over the 400–4000 cm−1 wavenumber range. The UV spectrum was determined using a TU-1810 PC UV-vis spectrophotometer. The X-ray powder diffraction (XRD) was obtained using a Bruker D8 ADVANCE X-ray diffractometer at 40 kV and 40 mA in the range of 2θ = 3–40° at a rate of 0.02° s−1. The thermal stability of the sample was performed using thermogravimetry (TG) methods from room temperature to 800 °C, which was conducted by a TGA Q50 in a nitrogen stream, with a scanning rate of 10 °C min−1. All reagents were analysis grade.
3. Results and discussion
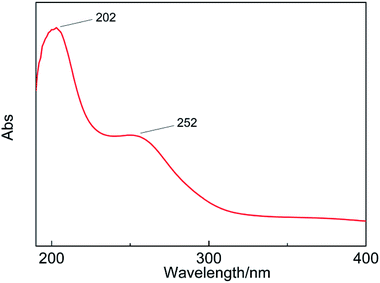
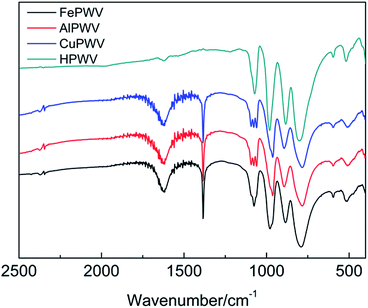
The absorption band of the H5PW10V2O40·5.76H2O UV spectrum indicates the charge-transfer between a coordinated metal atom and oxygen. The absorption band at 200–260 nm comes from the electron transfer of the bridge-oxygen to metal atoms in the Keggin unit.30 The absorption peaks of H5PW10V2O40·5.76H2O appear at 202 nm and 252 nm (Ob/Oc → W) (Fig. 1). This result presents that compounds contain Keggin units.The characteristic 790–1080 cm−1 bands of heteropolyanion with the Keggin structure are observed. Moreover, the vibrational frequencies are in the sequence υas(M–Oc–M) < υas(M–Ob–M) < υas(M–Od) < υas(P–Oa) (M = W, V). The IR spectra of HPA and its salts are shown in Fig. 2. It is clear that HPAs show frequency shifts relative to the spectrum of original HPA. Stand of the vibration modes of all M–O bonds are strongly influenced by the interactions between the solvents and neighboring anions. The stretching modes show that Ob or Oc atoms are different owing to the mixed bending–stretching character, which can be deduced from geometrical considerations. Because M–Ob–M and M–Oc–M vibrations are not pure and cannot be cast off from bending character, the antagonistic with the opposite effect is present. The abatement in the electrostatic anion–anion interactions results in a reduce in the stretching frequencies, but causes an increase in the bending vibrations. As a result, the frequency shifts of M–Ob–M and M–Oc–M may present different transformation. The wavenumber of the M–Ob–M asymmetrical stretching vibrations increases from 882 cm−1 (H5PW10V2O40) to 886 cm−1 (Fe5(PW10V2O40)3), 895 cm−1 (Al5(PW10V2O40)3), and 895 cm−1 (Cu5(PW10V2O40)2). The frequency of the M–Oc–M asymmetrical stretching vibrations decreases from 802 cm−1 (H5PW10V2O40) to 790 cm−1 (Fe5(PW10V2O40)3), 786 cm−1 (Al5(PW10V2O40)3), and 786 cm−1 (Cu5(PW10V2O40)2).
The complete correlative assignments of vibrational peaks are described in Table 1. Although there are four characteristics peaks of the Keggin structure ranging from 700 cm−1 to 1100 cm−1, Keggin units still exist in both compounds. The bands in the 1620 to 1650 cm−1 range are attributed to the bands corresponding to the H–O–H bending vibrations. The results of FTIR indicated that there are no significant changes in Keggin structure comparing HPA with their salts. Therefore it is reasonable to assume that the metals of Fe, Cu and Al is not incorporated in the primary Keggin structure. In all probability, they occupy positions as counter-cations. This was also proved by the characteristic peaks appeared at 1384 cm−1 in HPA salts, which corresponded to symmetrical bend of the O–Fe, Cu or Al.31
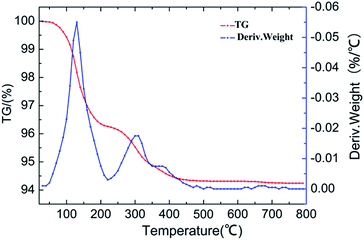
Generally, HPAs consist of protons, water, and HPAs anions. TG and DTA curves of the HPA synthesized in the study are shown in Fig. 3. The total percent weight loss of the powder product is 5.65 wt%, indicating that 8.70 water molecules are lost during thermogravimetric analysis. The peak in the temperature range of 100–200 °C corresponding to the loss of hydration water, which are hydrogen-bonded to the acidic protons to form the [H2O⋯H+⋯OH2] ions and were calculated to be 5.76H2O molecules per formula unit. The peak in the range 220 to 350 °C due to the loss of 1.41H2O molecules per unit corresponding to protonated water. As for the peak at the temperature 380 °C, it was accounted for the loss of 0.5 molecules of structural water per formula unit.32–34 So, the accurate molecular formula of the product is H5PW10V2O40·5.76H2O.
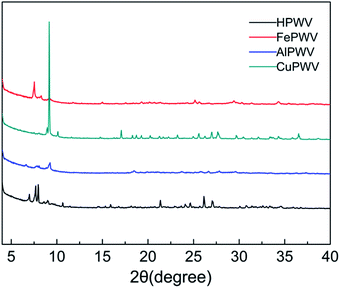
The X-ray powder diffraction (XRD) patterns of HPA and its metal salts is presented in Fig. 4. The XRD patterns of the hybrid materials are in marked contrast with that of pristine HPA where the most intense peak is present at approximately 7.60°. Despite the introduction of the metal, the characteristic diffraction peaks of H5PW10V2O40·5.76H2O are still conscious of in curves b and c in the range of 2θ = 6–10°. The sharp diffraction bands at approximately 5–11° are the properties of the Keggin unit, which indicate the existence of Keggin anions in the metal salts, agreeing with the infrared spectra data.37 No peaks corresponding to crystalline phases are visible at 14–40° of XRD powder patterns for Fe5(PW10V2O40)3, Al5(PW10V2O40)3, Cu5(PW10V2O40)2. These features indicate that these HPA metal salts consist of a mostly amorphous structure.
The effects of different metal heteropoly acid salts on the degradation of phenol were shown in Fig. 5a, showing performance in order of FePWV > AlPWV > CuPWV > HPWV, similar to the results of Oturan.38 The enhancement of catalytic activity of metal heteropoly acid salts comparing with HPWV was mainly attributed to the synergetic effect between Brønsted acid catalysis and Fenton process. Among these metal heteropoly acid salts, moly site shows the best catalytic effect. This may be explained by the fact that Fe shows superior catalytic activity in comparison to the other transition metals.39
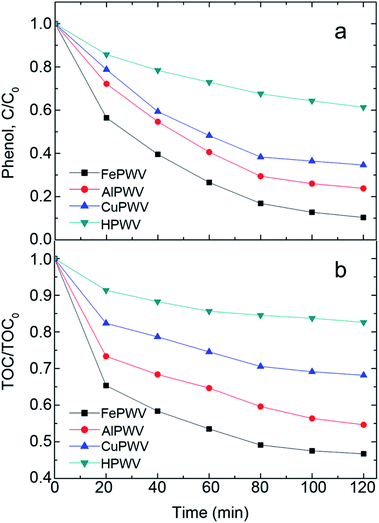 | ||
| Fig. 5 Effect of different catalyst on (a) phenol degradation and (b) TOC removal. Reaction condition: 1 μmol L−1 catalyst + 50 mg L−1 phenol + 2 μmol L−1 H2O2 + 10 W UV lamp. | ||
In the entire reaction, there was no additional acid added to significantly reduce the cost because the pH was approximately 3 due to the acidity of the heteropoly acid salts. The TOC curves in Fig. 5b are basically consistent with the results presented in Fig. 5a of the TOC removal of up to 54% after 120 min, showing that this method cannot completely mineralize phenol under experimental conditions. Nevertheless, the method can be used as a pretreatment for a subsequent biological treatment.
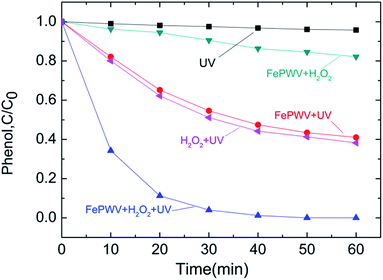
The phenol degradation curves under different conditions are shown in Fig. 6. Phenol concentration declined slightly under UV irradiation for 60 min, suggesting that a small amount of phenol was degraded. Following the addition of the Fe5(PW10V2O40)3 catalyst to the solution, the rate of the decrease of the curve increased significantly, resulting in phenol degradation of approximately 59% for 60 min. This is similar to the curve that is obtained when H2O2 was added to the solution that is related to the generation of hydroxyl radicals.40,41 However, because H2O can be hydrolyzed to HO˙ under UV irradiation via catalysis by Fe5(PW10V2O40)3, the phenol degradation curve declined significantly to 96% when the Fe5(PW10V2O40)3 catalyst and H2O2 were added simultaneously for 30 min, indicating that H2O2 can be rapidly decomposed to HO˙ due to both the UV irradiation and the effect of Fe5(PW10V2O40)3. For catalyst absorption in the 200–260 nm range, the results could be explained by the following mechanism:
| MPWV(H2O) + H2O2 ⇌ MPWV(H2O2) + H2O | (5) |
| MPWV(H2O) + UV → MPWV(OH)− + H+ | (6) |
| MPWV(OH)− + H2O → MPWV(H2O)− + HO˙ | (7) |
| MPWV(H2O2) + UV → MPWV(O2H)− + H+ | (8) |
| MPWV(O2H)− + H2O → MPWV(OH)− + 2OH˙ | (9) |
| MPWV(OH)− + H+ → MPWV(H2O) | (10) |
| HO˙ + phenol → products | (11) |
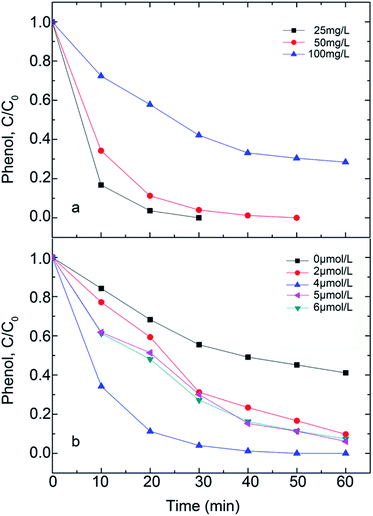
Even though the initial phenol concentration varies, phenol concentration diminishes with reaction time under the Fe5(PW10V2O40)3 photo catalysis (Fig. 7a). This reaction time shows that the degradation rate apparently decreases with the increase in the initial phenol concentration. Therefore, a long time is required to fully degrade the phenol at high concentration. Phenol can be degraded completely under the condition of initial concentration of 25 mg L−1 and reaction time of 20 min. This degradation displays obvious advantages in energy consumption and cost compared with the previously obtained results.42
When H2O2 was added, phenol was mainly degraded by the hydroxyl radicals produced by the H2O2 decomposition, so that H2O2 concentration is a key factor in controlling the rate of phenol degradation (Fig. 7b). The percentage of phenol degradation rises with the increasing concentration of H2O2 up to 0.2 μmol L−1, but then declines when the concentration of H2O2 surpasses 0.2 μmol L−1. This may be related to the disproportionation reaction and the “suppression” action of hydroxyl radicals at high H2O2 concentration.43 Kleiser had explained the suppression using the self-scavenging of OH radicals. At high H2O2 concentration, more hydroxyl radicals are formed. However, the high concentration of H2O2 means more OH-radicals are scavenged by itself, as presented below.44
 | (12) |
Herefore, in this study, it is found that the optimal concentration of H2O2 for phenol degradation is 0.2 μmol L−1.
4. Conclusions
Three heteropoly acid salts were successfully prepared and their effectiveness in the application to photocatalysis was studied. The results indicated that catalytic performance was all improved comparing with HPWV, and FePWV showed the best catalytic effect. The photocatalytic activities for degradation of phenol over FePWV reached 96% in 30 min in the case of H2O2 added simultaneously. In addition, H2O2 concentration is a key factor in controlling the rate of phenol degradation due to the balance of the forming and self-scavenging of OH radicals. However, more deep research such as the catalytic mechanisms, reusability test and application for other organic compounds still need to be further investigated. Recently, research in the field of novel catalysts has received intense interest, with a special focus on green, environmentally friendly catalysts. Therefore, heteropoly acid catalysts will probably become the novel catalyst used in the environmental applications of the future.Conflicts of interest
There are no conflicts to declare.Acknowledgements
This work was supported by the Project of Green Manufacturing system; the Open Subject of Jiangsu Key Laboratory of Anaerobic Biotechnology (JKLAB201605); the Young Doctorate Cooperation Fund Project of Advanced Materials Institute, Shandong Academy of Science (2018QNHZ04).References
- S. Wu, H. Li, X. Li, H. He and C. Yang, Chem. Eng. J., 2018, 353, 533–541 CrossRef CAS.
- A. Babuponnusami and K. Muthukumar, J. Environ. Chem. Eng., 2014, 2, 557–572 CrossRef CAS.
- L. F. Liotta, M. Gruttadauria, G. Di Carlo, G. Perrini and V. Librando, J. Hazard. Mater., 2009, 162, 588–606 CrossRef CAS PubMed.
- M. Pera-Titus, V. García-Molina, M. A. Baños, J. Giménez and S. Esplugas, Appl. Catal., B, 2004, 47, 219–256 CrossRef CAS.
- M. Bobu, S. Wilson, T. Greibrokk, E. Lundanes and I. Siminiceanu, Chemosphere, 2006, 63, 1718–1727 CrossRef CAS PubMed.
- M. N. Chong, B. Jin, C. W. Chow and C. Saint, Water Res., 2010, 44, 2997–3027 CrossRef CAS PubMed.
- S. Wang, Dyes Pigm., 2008, 76, 714–720 CrossRef CAS.
- V. Kavitha and K. Palanivelu, Int. J. Environ. Sci. Technol., 2016, 13, 927–936 CrossRef CAS.
- P. Maletzky and R. Bauer, Chemosphere, 1998, 37, 899–909 CrossRef CAS.
- M.-Y. Kuo, C.-F. Hsiao, Y.-H. Chiu, T.-H. Lai, M.-J. Fang, J.-Y. Wu, J.-W. Chen, C.-L. Wu, K.-H. Wei and H.-C. Lin, Appl. Catal., B, 2019, 242, 499–506 CrossRef CAS.
- J. Rodríguez-Chueca, M. P. Ormad, R. Mosteo and J. L. Ovelleiro, Chem. Eng. Sci., 2015, 138, 730–740 CrossRef.
- B. Li, Y. Dong, M. Li and Z. Ding, J. Mater. Sci., 2014, 49, 7639–7647 CrossRef CAS.
- D. Liang, J. Li and G. Pang, J. Mater. Sci., 2016, 51, 5412–5420 CrossRef CAS.
- A. V. Russo, L. F. Toriggia and S. E. Jacobo, J. Mater. Sci., 2013, 49, 614–620 CrossRef.
- M. Aleksić, H. Kušić, N. Koprivanac, D. Leszczynska and A. L. Božić, Desalination, 2010, 257, 22–29 CrossRef.
- Y. Lin, S. Wu, C. Yang, M. Chen and X. Li, Appl. Catal., B, 2019, 245, 71–86 CrossRef CAS.
- B. Rodríguez-Cabo, I. Rodríguez-Palmeiro, R. Rodil, E. Rodil, A. Arce and A. Soto, J. Mater. Sci., 2015, 50, 3576–3585 CrossRef.
- O. S. N. Sum, J. Feng, X. Hu and P. L. Yue, Chem. Eng. Sci., 2004, 59, 5269–5275 CrossRef CAS.
- Y.-H. Chiu and Y.-J. Hsu, Nano Energy, 2017, 31, 286–295 CrossRef CAS.
- S. Wu, H. He, X. Li, C. Yang, G. Zeng, B. Wu, S. He and L. Lu, Chem. Eng. J., 2018, 341, 126–136 CrossRef CAS.
- P. P. Yang, X. L. Wang, L. C. Li and D. Z. Liao, Dalton Trans., 2011, 40, 4155–4161 RSC.
- L. Hong, H. F. Li, J. Sun, J. L. Zhu, G. H. Ai, L. Li, B. Zhang, F. L. Chi and X. W. Tong, J. Minim. Invasive Gynecol., 2012, 19, 684–688 CrossRef PubMed.
- S. J. Freakley, R. J. Lewis, D. J. Morgan, J. K. Edwards and G. J. Hutchings, Catal. Today, 2015, 248, 10–17 CrossRef CAS.
- X. Han, W. Yan, K. Chen, C.-T. Hung, L.-L. Liu, P.-H. Wu, S.-J. Huang and S.-B. Liu, Appl. Catal., A, 2014, 485, 149–156 CrossRef CAS.
- J. A. Lopez, J. C. Lopez, D. E. Valerdi, G. G. Salgado, T. Diaz-Becerril, A. P. Pedraza and F. J. Gracia, Nanoscale Res. Lett., 2012, 7, 604 CrossRef PubMed.
- D. W. Thompson, D. J. Seidel, W. J. Randel, C. Z. Zou, A. H. Butler, C. Mears, A. Osso, C. Long and R. Lin, Nature, 2012, 491, 692–697 CrossRef CAS PubMed.
- J. A. Asensio, E. M. Sanchez and P. Gomez-Romero, Chem. Soc. Rev., 2010, 39, 3210–3239 RSC.
- J. Zhang, Y. Tang, Z. Luo, M. Jian and C. Hu, Chin. J. Inorg. Chem., 2014, 20, 935–940 Search PubMed.
- H. Zhang, R. Yan, L. Yang, Y. Diao, L. Wang and S. Zhang, Ind. Eng. Chem. Res., 2013, 52, 4484–4490 CrossRef CAS.
- X. Tong, N. Tian, W. Wu, W. Zhu, Q. Wu, F. Cao, W. Yan and A. B. Yaroslavtsev, J. Phys. Chem. C, 2013, 117, 3258–3263 CrossRef CAS.
- S. Venkateswarlu and M. Yoon, RSC Adv., 2015, 5, 65444–65453 RSC.
- S. Denis, E. Baudrin, M. Touboul and J. M. Tarascon, J. Electrochem. Soc., 1997, 144, 4099–4109 CrossRef CAS.
- I. V. Kozhevnikov, J. Mol. Catal. A: Chem., 2007, 262, 86–92 CrossRef CAS.
- A. Devadas, S. Baranton, T. W. Napporn and C. Coutanceau, J. Power Sources, 2011, 196, 4044–4053 CrossRef CAS.
- Q. Wu, X. Sang, F. Shao and W. Pang, Mater. Chem. Phys., 2005, 92, 16–20 CrossRef CAS.
- Y. Leng, J. Wang, D. Zhu, X. Ren, H. Ge and L. Shen, Angew. Chem., Int. Ed., 2009, 48, 168–171 CrossRef CAS PubMed.
- X. Tong, N. Tian, W. Zhu, Q. Wu, F. Cao and W. Yan, J. Alloys Compd., 2012, 544, 37–41 CrossRef CAS.
- N. Oturan, M. Zhou and M. A. Oturan, J. Phys. Chem. A, 2010, 114, 10605–10611 CrossRef CAS PubMed.
- X.-R. Xu, H.-B. Li, W.-H. Wang and J.-D. Gu, Chemosphere, 2004, 57, 595–600 CrossRef CAS PubMed.
- H. Bel Hadjltaief, P. Da Costa, P. Beaunier, M. E. Gálvez and M. Ben Zina, Appl. Clay Sci., 2014, 91–92, 46–54 CrossRef CAS.
- J. Chen and L. Zhu, Catal. Today, 2007, 126, 463–470 CrossRef CAS.
- M. Luo, S. Yuan, M. Tong, P. Liao, W. Xie and X. Xu, Water Res., 2014, 48, 190–199 CrossRef CAS PubMed.
- M. A. Oturan and J. Pinson, J. Phys. Chem., 1995, 99, 13948–13954 CrossRef CAS.
- G. Kleiser and F. H. Frimmel, Sci. Total Environ., 2000, 256, 1–9 CrossRef CAS PubMed.
| This journal is © The Royal Society of Chemistry 2019 |

