DOI:
10.1039/C9RA00566H
(Paper)
RSC Adv., 2019,
9, 7115-7122
Optimizing the average power factor of p-type (Na, Ag) co-doped polycrystalline SnSe
Received
22nd January 2019
, Accepted 16th February 2019
First published on 1st March 2019
Abstract
Despite the achievable high thermoelectric properties in SnSe single crystals, the poor mechanical properties and the relatively high cost of synthesis restrict the large scale commercial application of SnSe. Herein, we reported that co-doping with Na and Ag effectively improves the thermoelectric properties of polycrystalline SnSe. Temperature-dependent carrier mobility indicates that the grain boundary scattering is the dominant scattering mechanism near room temperature, giving rise to low electrical conductivity for the polycrystalline SnSe in comparison with that of the single crystal. Co-doping with Na and Ag improves the electrical conductivity of polycrystalline SnSe with a maximum value of 90.1 S cm−1 at 323 K in Na0.005Ag0.015Sn0.98Se, and the electrical conductivity of the (Na, Ag) co-doped samples is higher than that of the single doped samples over the whole temperature range (300–773 K). Considering the relatively high Seebeck coefficient of 335 μV K−1 at 673 K and the minimum thermal conductivity of 0.48 W m−1 K−1 at 773 K, Na0.005Ag0.015Sn0.98Se is observed to have the highest PF and ZT among the series of samples, with values of 0.50 mW cm−1 K−2 and 0.81 at 773 K, respectively. Its average PF and ZT are 0.43 mW cm−1 K−2 and 0.37, which is 92% and 68% higher than that of Na0.02Sn0.98Se, 40% and 43% higher than that of Ag0.02Sn0.98Se, and 304% and 277% higher than that of the previously reported SnSe, respectively.
1. Introduction
Thermoelectric materials, being capable of converting waste heat directly into electricity, have drawn great attention in recent years. The conversion efficiency of a thermoelectric device is mostly dictated by the materials' dimensionless figure of merit, defined as ZT = α2σT/κ, where α, σ, κ, T are the Seebeck coefficient, electrical conductivity, thermal conductivity, and operating temperature, respectively. The overall electronic performance is measured by the thermoelectric power factor, PF = α2σ, while the thermal conductivity can be described as κ = κE + κL, where κE is the electronic thermal conductivity, and κL is the lattice thermal conductivity.1 Due to the coupling between the electronic properties and thermal properties, to achieve a synergetic optimization of the electronic and the thermal transport properties is the key to improve the thermoelectric performance of the materials.2
Recently, SnSe has drawn much attention due to its record high figure of merit ZT.3–8 Below ∼800 K, the SnSe compound crystallizes orthorhombically within the Pnma space group. The unique crystal structure and much larger lattice parameter along the a-axis causes highly anisotropic thermoelectric properties along different crystal axis.5,9–11 Despite the achievable high thermoelectric properties in SnSe single crystals, however, the poor mechanical properties and the relatively high cost of synthesis restrict the large scale commercial application of SnSe. Unfortunately, the thermoelectric properties of the polycrystalline sample, even with boosted texture (anisotropy), are inferior to the single crystal. It is well known that the conversion efficiency of the device is strongly related to the average ZT over a range of temperatures relevant to applications.12–17 Therefore, it is crucial to improve the thermoelectric properties of polycrystalline SnSe in a wide temperature range.
Chemical doping has been widely used to optimize the carrier concentration and enhance thermoelectric properties in SnSe.13,17–41 In p-type SnSe, Na and Ag are the most effective p-type dopants to optimize the carrier concentration.3,6,8,19–28 However, the role of Ag and Na is still distinct. Doping with Ag can adjust the carrier concentration in the range of 1017 cm−3 to 1019 cm−3, and maintains a relatively high Seebeck coefficient and a low thermal conductivity of 1.1 Wm−1 K−1 for Ag0.01Sn0.99Se sample at room temperature by the increasing of phonon scattering.18 Whereas Na is more effective in enhancing the electrical conductivity by providing a higher carrier concentration around 1020 cm−3.24 Considering the distinct but complementary advantages in Na-doped and Ag-doped samples, co-doping with Na and Ag could produce a significant synergistic enhancement of ZT.
In this work, by adjusting the Ag/Na ratio in Na0.02−xAgxSn0.98Se (x = 0, 0.005, 0.01, 0.015, and 0.02), the electrical conductivity of the (Na, Ag) co-doped samples are much higher than that of the single doped samples in the whole temperature range. We find the highest power factor and figure of merit in Na0.005Ag0.015Sn0.98Se, and the average values of PF and ZT have been greatly improved in the co-doped sample Na0.005Ag0.015Sn0.98Se compared to the single doped samples.
2. Experimental section
P-type polycrystalline samples were synthesized via melting, annealing, and subsequent sparking plasma sintering (SPS). High purity elements (Sinopharm Chemical Reagent Co., Ltd., China) of Sn (shot, 99.999%), Se (shot, 99.999%), Ag (wire, 99.999%), and Na (chunk, 99.99%) were weighed according to the stoichiometry of Na0.02−xAgxSn0.98Se (x = 0, 0.005, 0.01, 0.015, and 0.02), and loaded into a quartz tube under argon atmosphere in the glove box. The inner wall of the tube was carbon coated to prevent reaction with Na. The quartz tube was sealed under the vacuum of 10−4 torr. And then the sealed quartz tube was put into a larger tube which was evacuated and sealed again. The larger tube was used to protect the materials from oxidation caused by cracking of the inner tube, which likely occurs as SnSe cools through its phase transition temperature near 540 °C. The double-tube was slowly heated up to 950 °C, kept at the temperature for 12 hours, slowly cooled to 650 °C, and annealed for 72 hours in the muffle furnace. Fine powders were obtained by hand grinding the annealed ingot, and the powders were then sieved into particles below 53 μm. The powders were densified by SPS at 500 °C under a uniaxial pressure of 50 MPa for 5 min. Each sintered pellet was obtained with 14 mm in height and Φ15 mm in diameter. 3 × 3 × 12 mm3 bars, 8 × 8 × 1.2 mm3 plates, and 3 × 1 × 8 mm3 bars were cut in the directions parallel (∥) with or perpendicular (⊥) to the pressing direction for measurements of the electronic properties, thermal transport properties, and Hall coefficient, respectively.
The phase composition, lattice parameter, and grain orientation distribution were identified by powder and bulk X-ray diffraction (XRD, PANalytical-Empyrean, Almelo, The Netherlands: X'Pert PRO) with Cu Kα radiation. Microstructures of the fractured surfaces were observed by a field-emission scanning electron microscopy (FESEM, Hitachi SU-8020, Tokyo, Japan) with secondary electron (SE) images. Backscattered electron (BSE) images and energy dispersive X-ray spectroscopy (EDS) of specimens were acquired by an electron probe micro-analyzer (EPMA, JXA-8230, JEOL, Japan) with an energy dispersive spectrometer (INCAX-ACT, Tokyo, Japan). The electrical conductivity (σ) and Seebeck coefficient (α) were measured simultaneously from 300 K to 773 K by using an ZEM-3 apparatus (Ulvac Riko Inc., Kanagawa, Japan) under a helium atmosphere. The thermal conductivity (κ) was calculated from the equation κ = DCPd, where CP is the heat capacity calculated from the Dulong–Petit law, the thermal diffusivity (D) was measured by using a laser flash system (LFA 457, Netzsch, Selb, Germany) in an argon atmosphere, and d is the density obtained using Archimedes' method. The uncertainty of the electrical conductivity and Seebeck coefficient measurements by ZEM-3 is estimated to be ±5%, and that of thermal diffusivity measured by LFA457 is ±3%. Therefore, by considering additional uncertainties of CP and d, the error bar of the measured ZT is estimated to be ±15–20%. The low temperature Hall coefficient (RH) measurement was carried out by a physical property measurement system (PPMS-9, Quantum Design, San Diego, CA, USA) from 10 K to 300 K with magnetic field up to ±1 T, and the low temperature electrical conductivity was also obtained from PPMS from 2 K to 300 K. We assumed a single parabolic band model to extract the carrier concentration, nH = (RHe)−1, and to calculate the carrier mobility as μH = σRH, where RH is the measured Hall coefficient.
3. Results and discussion
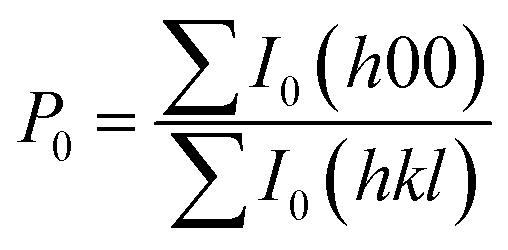
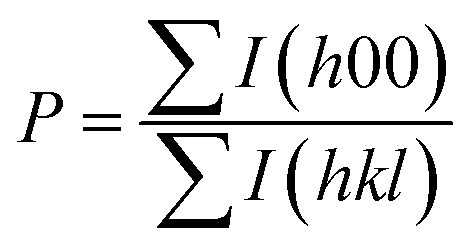
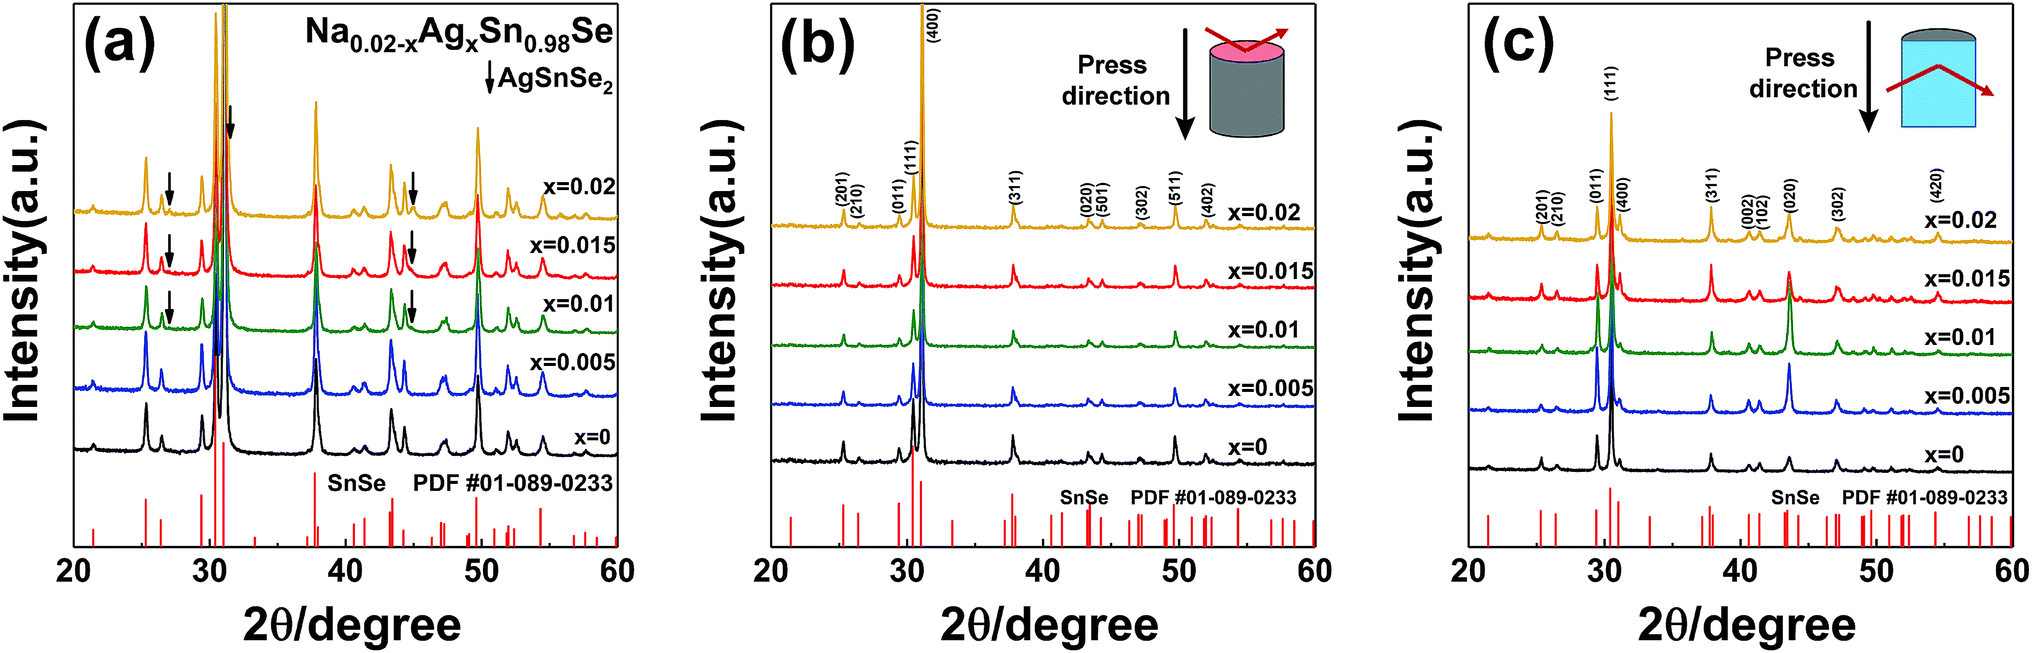
The powder XRD results of the Na0.02−xAgxSn0.98Se (x = 0, 0.005, 0.01, 0.015, and 0.02) samples after SPS are displayed in Fig. 1a. The patterns can be identified as the orthorhombic phase with a Pnma symmetry as the major phase in all samples, besides a small amount of secondary phase of AgSnSe2 present in doped samples when the Ag content x is higher than 0.01. The existence of the AgSnSe2 secondary phase suggests that the solubility limit of Ag in SnSe is less than 1 at% under the situation of co-doping with Na in the system. Fig. 1b shows the lattice parameters calculated by the Rietveld refinement method through the Fullprof software.42 As mentioned in the introduction part, the thermoelectric properties of SnSe is highly related to the orientation of the bulks. To probe the orientation of the bulks, bulk XRD results of all samples perpendicular to and parallel with the pressing direction are shown in Fig. 1b and c. The structural anisotropy is observed from the intensity ratio of the (400) and (111) peaks, and there are obvious differences from the two sample directions. The degree of grain alignment can be described quantitatively by the orientation factor (F) according to the Lotgering method,43 as follows:| |
 | (1) |
| |
 | (2) |
| |
 | (3) |
where I(hkl) is the intensity of the (hkl) plane from bulk XRD results, I0(hkl) is the relative intensity of the corresponding plane from powder XRD data, while P and P0 are the ratios of the integral intensity of the (h00) planes to the intensities of the (hkl) planes for preferentially and randomly oriented samples. To clarify the preferential grain orientation, the calculated F of the ∥ samples and the ⊥ samples are shown in Table 1. Values range from 0.09–0.13 and 0.42–0.52, demonstrating a preferred grain orientation in ⊥ samples. The similar F values for all ⊥ samples with different doping levels indicate that co-doping with Na and Ag does not change the orientation of the samples.
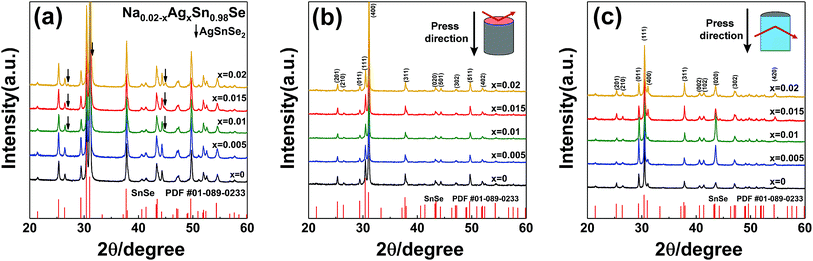 |
| | Fig. 1 XRD results of Na0.02−xAgxSn0.98Se (x = 0, 0.005, 0.01, 0.015, and 0.02) compounds after the SPS process. (a) Powder XRD patterns, showing that Ag doping leads to a secondary phase of AgSnSe2 among a SnSe matrix; bulk XRD patterns of samples (b) perpendicular to, and (c) parallel with the SPS pressing direction. | |
Table 1 Calculated orientation factor (F) of the polycrystalline Na0.02−xAgxSn0.98Se (x = 0, 0.005, 0.001, 0.015, and 0.02) samples cut parallel and perpendicular to the pressing direction during the SPS process
| Samples |
x = 0 |
x = 0.005 |
x = 0.01 |
x = 0.015 |
x = 0.02 |
| F (⊥) |
0.42 |
0.43 |
0.52 |
0.51 |
0.47 |
| F (∥) |
0.12 |
0.13 |
0.11 |
0.09 |
0.13 |
To observe the grain orientation and grain size directly, we select Na0.005Ag0.015Sn0.98Se as a typical representative for the FESEM characterization, since the morphology of other samples with different ratio of Na to Ag is almost the same and Na0.005Ag0.015Sn0.98Se sample has the best thermoelectric performance in this work. The fractured surface perpendicular to the pressing direction is displayed in Fig. 2a, and exhibits the microscale grain orientation. A more distinct fractured surface image is shown in Fig. 2b, illustrating the layered structure of the sintered bulk materials. The BSE image of the polished surface in Fig. 2c reveals the grain boundaries, a small amount of secondary phase, and several cracks. The grain size distribution of the matrix can be calculated from Fig. 2c by using the linear intercept method, as displayed in Fig. 2d, and the mean size is 13.86 μm. The calculated mean grain size of all samples are summarized in Table 2, and is in the range of 12.10–15.47 μm. EDS mappings of Sn, Se, Na, and Ag elements from the selected region indicated in Fig. 2c are included in Fig. 2e–h, and the results evidence a nicely homogenized matrix with the presence of a Ag- and Sn-rich secondary phase. The AgSnSe2 secondary phase can also be seen in the microscopy analysis of the x = 0.015, and x = 0.02 samples, which is consistent with the XRD results.
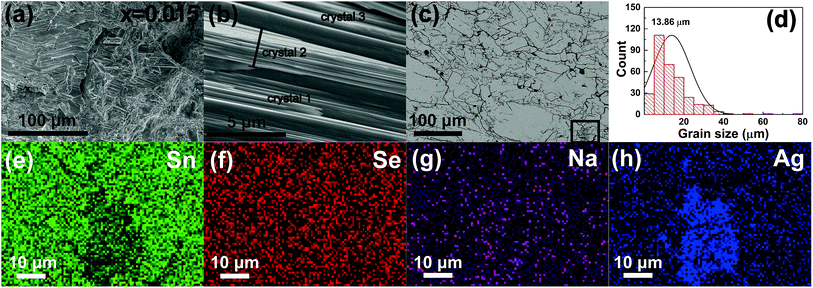 |
| | Fig. 2 (a) Fractured surfaces SEM image, (b) layered structure SEM image, (c) BSE image, (d) grain size distribution, and the EDS mappings of (e) Sn, (f) Se, (g) Na, and (h) Ag of polycrystalline Na0.005Ag0.015Sn0.98Se, which indicate a nicely homogenized matrix and show the presence of an Ag- and Sn-rich secondary phase. | |
Table 2 The room temperature Hall coefficient RH, carrier concentration nH, mobility μH, electrical conductivity σ, Seebeck coefficient α, density d, and mean grain size l of polycrystalline Na0.02−xAgxSn0.98Se (x = 0, 0.005, 0.001, 0.015, and 0.02) as a function of (Na, Ag) co-doping content
| |
RH (cm3 C−1) |
nH (1019 cm−3) |
μH (cm2 V−1 s−1) |
σ (S cm−1) |
α (μV K−1) |
d (g cm−3) |
l (μm) |
| x = 0 |
0.25 |
2.53 |
10.6 |
43.0 |
125 |
5.93 |
15.67 |
| x = 0.005 |
0.24 |
2.66 |
14.6 |
62.2 |
140 |
5.97 |
13.25 |
| x = 0.01 |
0.24 |
2.60 |
16.3 |
67.6 |
144 |
6.00 |
14.41 |
| x = 0.015 |
0.28 |
2.25 |
20.7 |
74.4 |
183 |
6.08 |
13.86 |
| x = 0.02 |
0.58 |
1.08 |
28.6 |
49.5 |
220 |
6.05 |
12.10 |
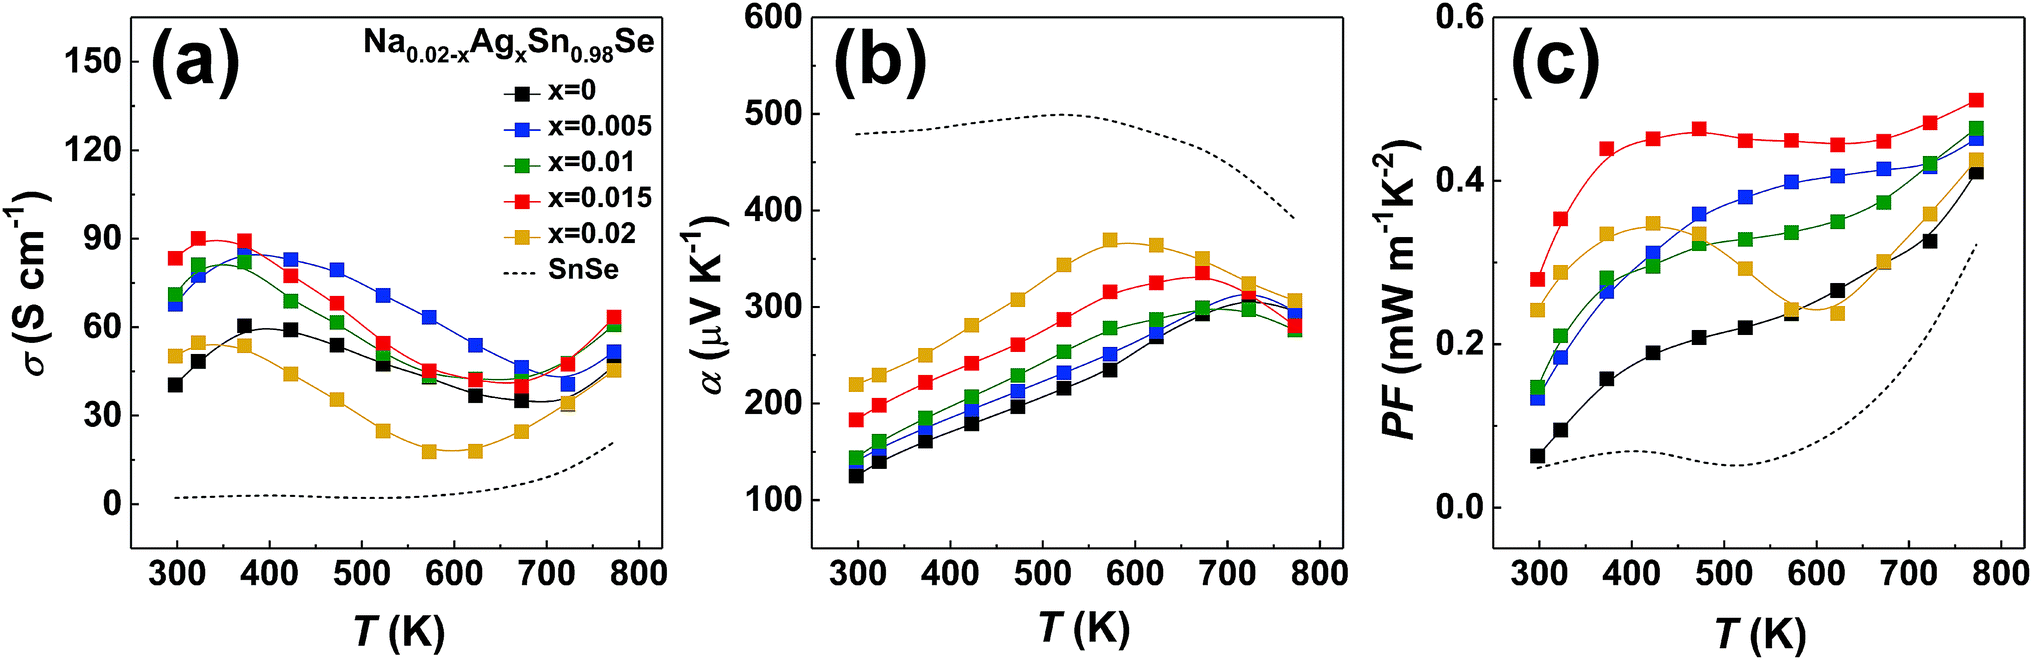
Since there is little difference in the grain orientation between our ⊥ samples, and it has been confirmed that the power factor and figure of merit ZT of ⊥ samples are better than those of the ∥ samples,18,22,25 we assume that the orientation distribution exerts the same influence on transport properties between our ⊥ samples. Therefore, we present the thermoelectric properties of the polycrystalline Na0.02−xAgxSn0.98Se (x = 0, 0.005, 0.01, 0.015, and 0.02) samples only perpendicular to the pressing direction in Fig. 3, together with the undoped polycrystalline SnSe as a reference (dashed line).44 Fig. 3a depicts the temperature-dependent electrical conductivity of (Na, Ag) co-doped samples. The electrical conductivity exhibits a similar temperature trend in all samples. When temperature increases, the electrical conductivity increases with a semiconducting transport behavior below 373 K, then decreases with a metallic conduction behavior in the temperature range of 573–723 K, and finally increases with a semiconducting behavior that is attributed to thermal excitation of minority carriers at high temperature.5,25 The electrical conductivity of the (Na, Ag) co-doped samples are much higher than that of the undoped and single doped samples in the whole temperature range. Especially at low temperature, the electrical conductivity is markedly enhanced, with a maximum value of 90.1 S cm−1 at 323 K for Na0.005Ag0.015Sn0.98Se compound. The positive values of the temperature-dependent Seebeck coefficients are shown in Fig. 3b, indicating that all doped samples are p-type, which is consistent with the Hall measurement. For the entire series of samples, the Seebeck coefficient increases with the increasing temperature up to around 573–723 K, then decreases with the temperature further increasing. The peak of the Seebeck coefficient is usually a result of the thermal excitation of minority carriers. In our measurement, this temperature range is consistent with the electrical conductivity in Fig. 3a. The 2 at% Ag doped sample has the highest Seebeck coefficient in the whole temperature range, and the 2 at% Na doped sample is observed to have a relatively lower Seebeck coefficient. In the co-doped samples, as the Ag/Na ratio increases, the Seebeck coefficient increases, and the temperature corresponding to the maximum Seebeck coefficient shifts to lower temperature. Because of the increasing of carrier concentration by dopants, the Seebeck coefficient of all doped samples is lower than that of the undoped sample. The temperature-dependent power factor is displayed in Fig. 3c. The power factor of all doped samples are obviously enhanced comparing to the undoped sample. It is worth noting that the power factor of Na0.005Ag0.015Sn0.98Se is higher than that of the other samples in the whole temperature range, with a maximum of 0.50 mW m−1 K−2 at 773 K. We calculated the average power factor of all doped samples from 300–773 K, and obtained PFavg = 0.43 mW cm−1 K−2 for Na0.005Ag0.015Sn0.98Se, which is 92% higher than that of Na0.02Sn0.98Se, 40% higher than that of Ag0.02Sn0.98Se, and 304% higher than that of the undoped SnSe,25 respectively.
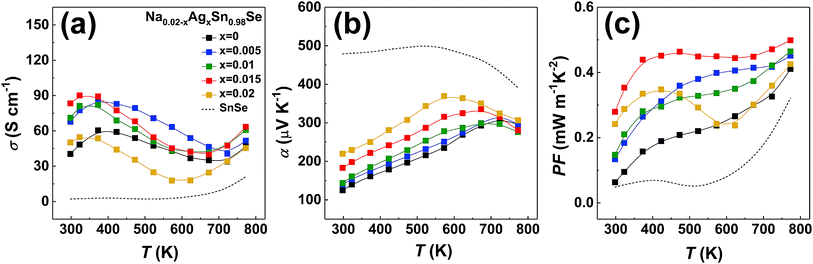 |
| | Fig. 3 Transport properties of polycrystalline samples of Na0.02−xAgxSn0.98Se (x = 0, 0.005, 0.001, 0.015, 0.02) measured perpendicular to the pressing direction during the SPS process, together with the undoped polycrystalline SnSe in ref. 44 (dashed line). (a) Electrical conductivity, (b) Seebeck coefficient, and (c) power factor PF. | |
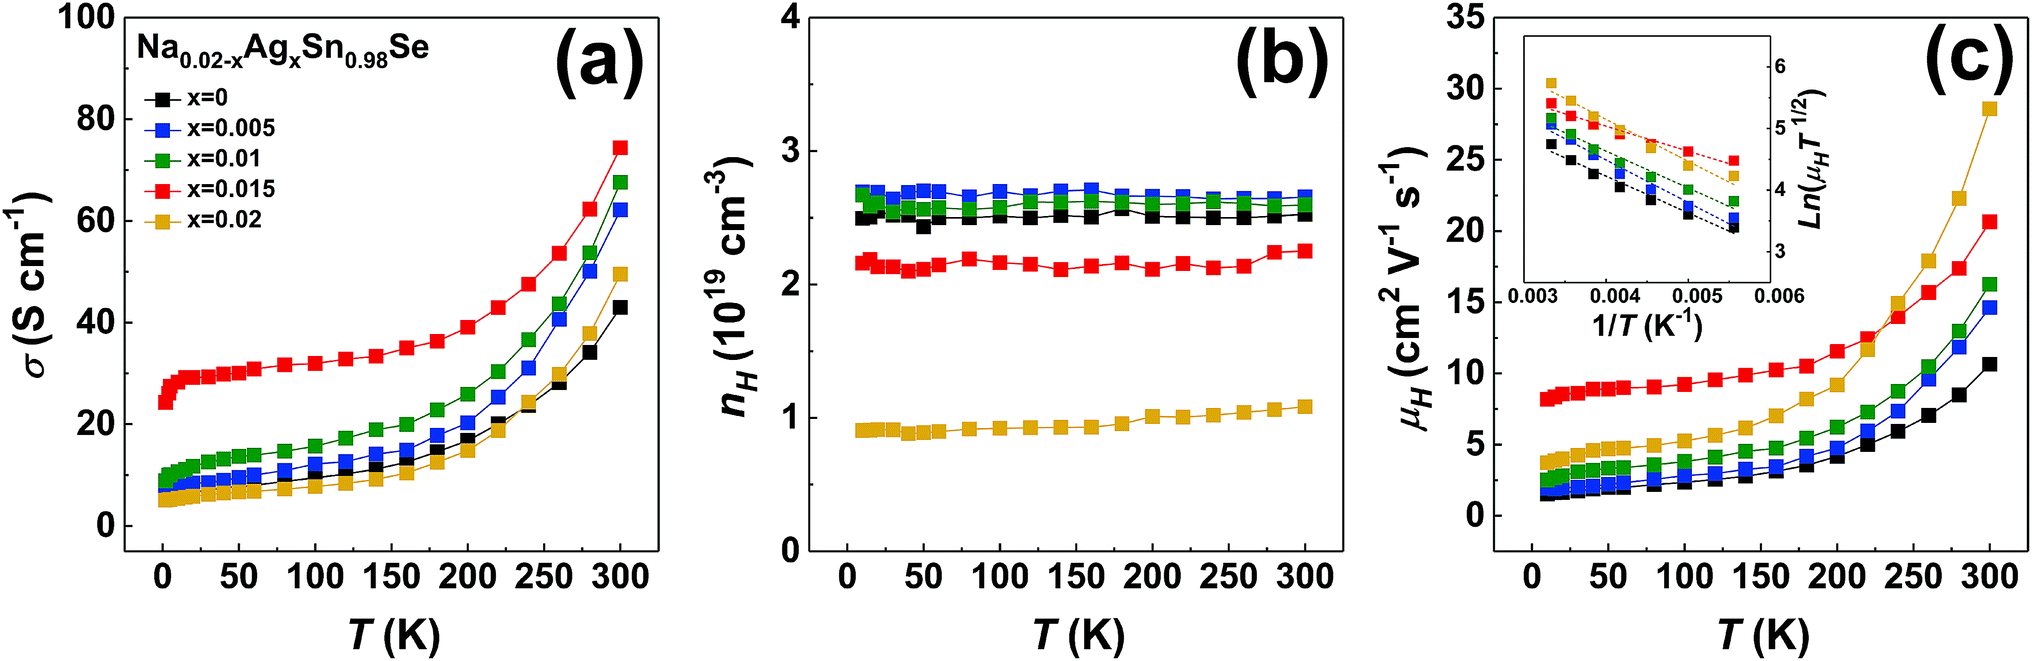
It is well known that the electrical properties of SnSe is strongly correlated with the carrier concentration and carrier scattering mechanism. To further understand the scattering mechanisms in (Na, Ag) co-doped polycrystalline SnSe, low temperature electrical conductivity and carrier concentration were measured, presented in Fig. 4a and b. The electrical conductivity rises exponentially with temperature, while the carrier concentration has a weak temperature dependence over the whole temperature range. The carrier concentration of co-doped samples is in the range from 1.1 × 1019 cm−3 to 2.7 × 1019 cm−3. As the Ag content x increases, the carrier concentration first maintains approximately the same value then decreases for x > 0.01, for that the Ag solubility limit is smaller than 1 at% and Na is a more efficient p-type dopant in polycrystalline SnSe. Based on the measured hall coefficient and electrical conductivity, the temperature dependent carrier mobility can be calculated, as shown in Fig. 4c. The carrier mobility of all polycrystalline samples increases with increasing temperature, indicating a positive correlation with temperature. For most of the thermoelectric materials, the type of scattering mechanism are usually ionized impurity scattering (μH ∝ T3/2), acoustic phonon scattering (μH ∝ T−3/2), and grain boundary scattering (ln(μHT1/2) ∝ T−1).45 The distinct temperature dependence of mobility between acoustic phonon scattering and the other two scattering mechanism indicates that the main scattering mechanism in our samples is likely the ionized impurity scattering or the grain boundary scattering. The weakly temperature dependent carrier concentration in this work barely shows the happening of ionized impurity scattering. In the previous work, we have proved that, the ionized impurity scattering happens below 75 K, and the grain boundary scattering is the dominant scattering mechanism near room temperature.18 We suggest that the charge carrier scattering mechanisms near room temperature should be dominated by grain boundary scattering. The charge carrier mobility limited by the grain boundary scattering can be described as:18,46,47
| |
 | (4) |
where
e is the electron charge,
l is the mean grain size,
T is the absolute temperature,
m* is the effective mass of the charge carriers, and
ϕb is the potential barrier height at the grain boundary. We fit the temperature-dependent mobility from 180 K to 300 K, and the estimated energy barriers in Na
0.02−xAg
xSn
0.98Se (
x = 0, 0.005, 0.01, 0.015, and 0.02) polycrystalline samples are 72 meV, 73 meV, 74 meV, 68 meV, and 85 meV, respectively. Given that room temperature thermal energy is only 26 meV (equivalent to
kBT), the average electrostatic potential between neighboring grains in the SnSe-based materials has a deleterious effect on its charge transport. The inset of
Fig. 4c shows the linear fitting between ln(
μHT1/2) and
T−1 for all doped samples, which is expected from the grain boundary scattering model of
eqn (4). A summary of the room temperature Hall coefficient, carrier concentration, carrier mobility, electrical conductivity, Seebeck coefficient, density, and mean grain size of polycrystalline Na
0.02−xAg
xSn
0.98Se (
x = 0, 0.005, 0.001, 0.015, and 0.02) are shown in
Table 2.
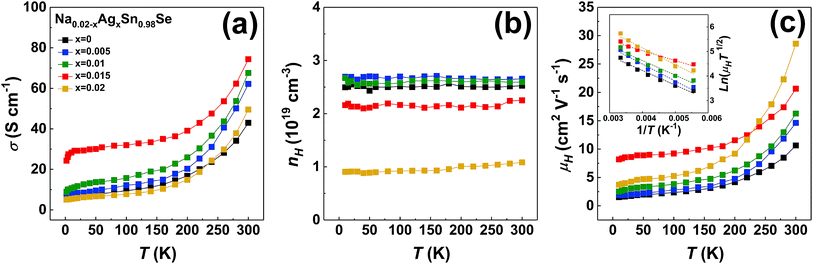 |
| | Fig. 4 Temperature-dependent (a) electrical conductivity, (b) charge carrier concentration, and (c) carrier mobility with the inset showing the linear fitting (dashed lines) between ln(μHT1/2) and T−1 from 180–300 K demonstrating that grain boundary scattering dominates for Na0.02−xAgxSn0.98Se (x = 0, 0.005, 0.001, 0.015, and 0.02). | |
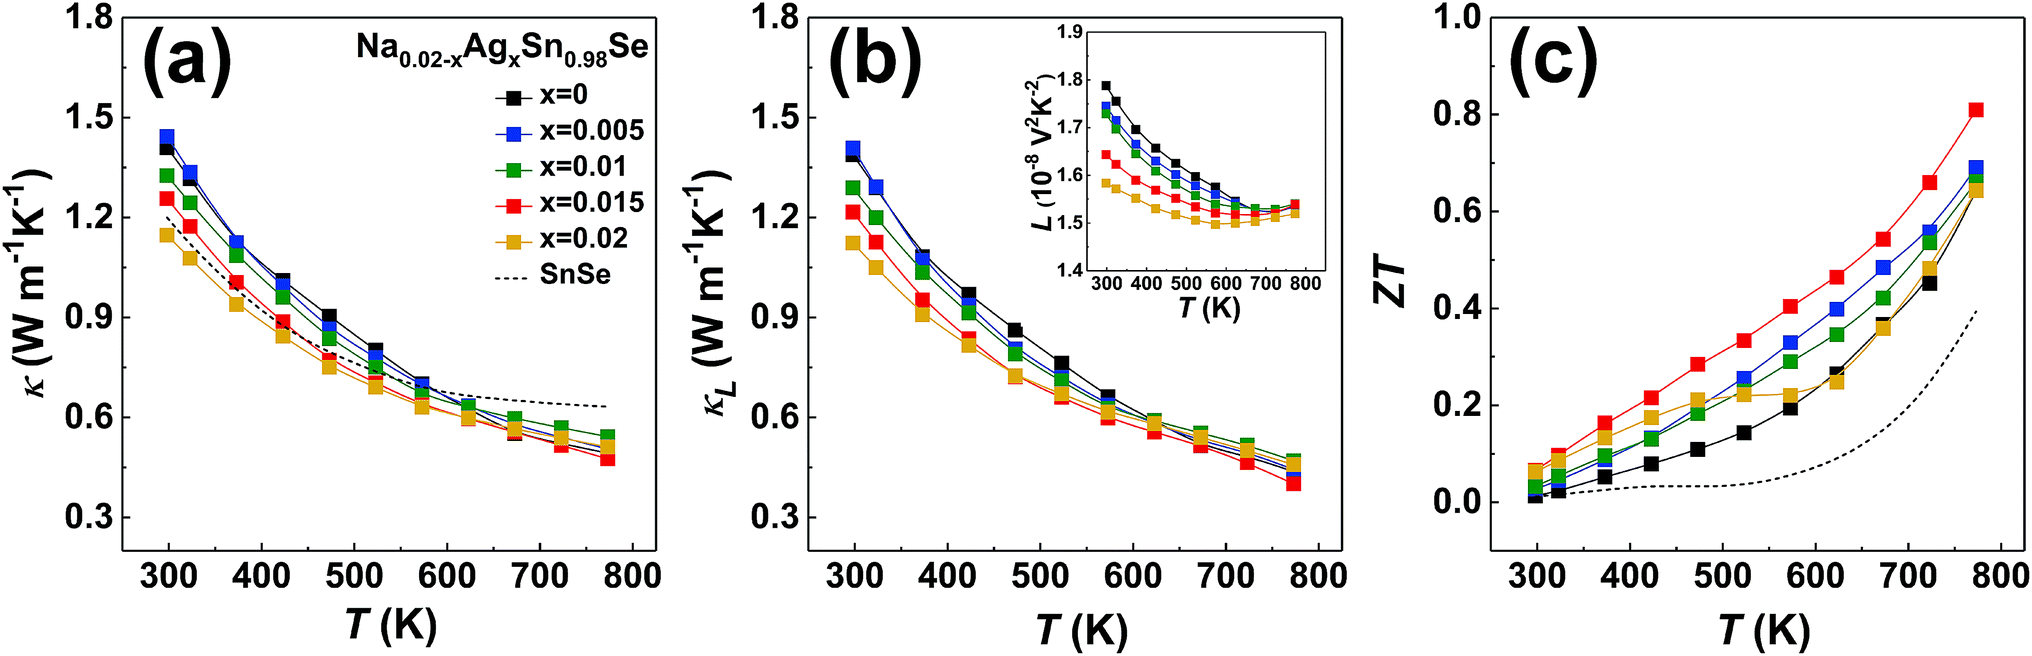
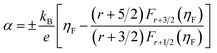
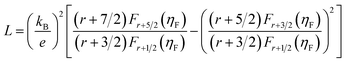
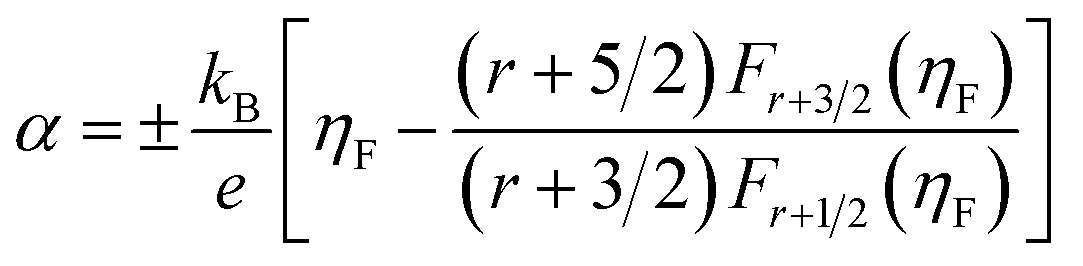
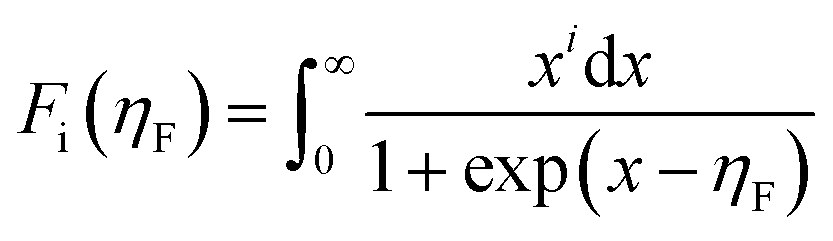
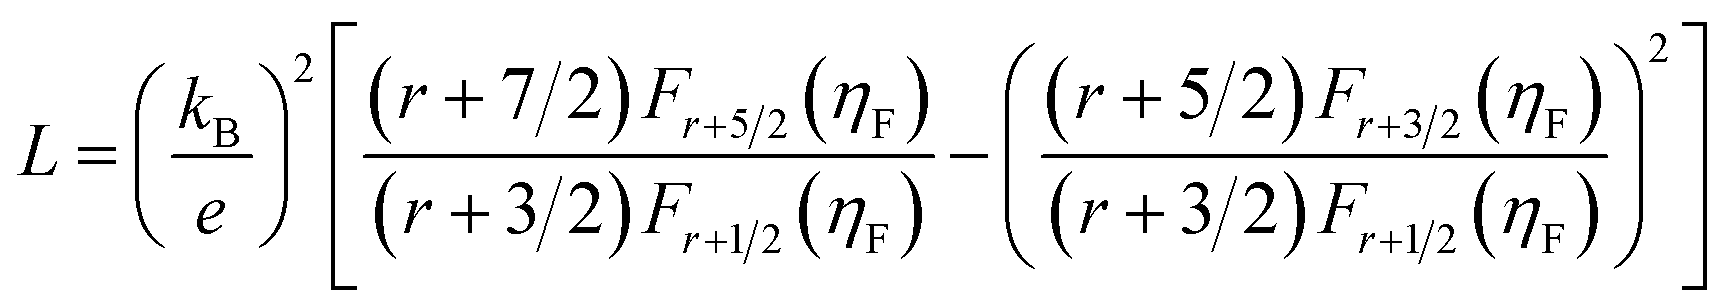
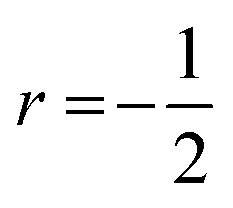
Fig. 5a displays the temperature dependence of total thermal conductivity for the (Na, Ag) co-doped samples, together with the undoped polycrystalline SnSe as a reference (dashed line).44 Due to the enhanced Umklapp scattering, the thermal conductivity decreases with increasing temperature. All doped samples display a higher thermal conductivity than that of the undoped one. The total thermal conductivity is the sum of the electronic and lattice thermal contributions. According to the Wiedemann–Franz law, the lattice thermal conductivity can be calculated by the equation κL = κ − LσT, where L is the Lorenz number derived from the Seebeck coefficient data using the following equations:48
| |
 | (5) |
| |
 | (6) |
| |
 | (8) |
where
kB,
ηF,
r and
Fi(
ηF) are the Boltzmann constant, reduced Fermi level, scattering parameter and Fermi integral, respectively. Here,

since acoustic phonons are the prevalent source of charge carrier scattering. The calculated values of the Lorenz numbers cover a range of (1.5–1.8) × 10
−8 V
2 K
−2 as displayed in the inset of
Fig. 3d.
 |
| | Fig. 5 Transport properties of polycrystalline samples of Na0.02−xAgxSn0.98Se (x = 0, 0.005, 0.001, 0.015, 0.02) measured perpendicular to the pressing direction during the SPS process, together with the undoped polycrystalline SnSe in ref. 44 (dashed line). (a) Thermal conductivity, (b) lattice thermal conductivity, with the inset showing the temperature-dependent Lorenz number calculated by eqn (3), and (c) the dimensionless thermoelectric figure of merit ZT. | |
Due to the low electrical conductivity, the electronic contribution to the thermal conductivity is less than 1% of the total thermal conductivity. As a result, lattice vibrations are the main carriers of heat in the materials, and the lattice thermal conductivity shown in Fig. 5b mimics the total thermal conductivity in Fig. 5a. As the Ag/Na ratio increases, thermal conductivity first remains the same from x = 0 to x = 0.01, then is reduced for the x = 0.015 and x = 0.02 samples, likely due to the enhanced interfacial phonon scattering related to the increasing secondary phase of AgSnSe2. The 2 at% Ag doped sample turns to have the lowest thermal conductivity among the series of samples. The combined point defect phonon scattering and interfacial phonon scattering arising from (Na, Ag) co-doping produce a low thermal conductivity of 0.48 Wm−1 K−1 at 773 K in the x = 0.015 sample.
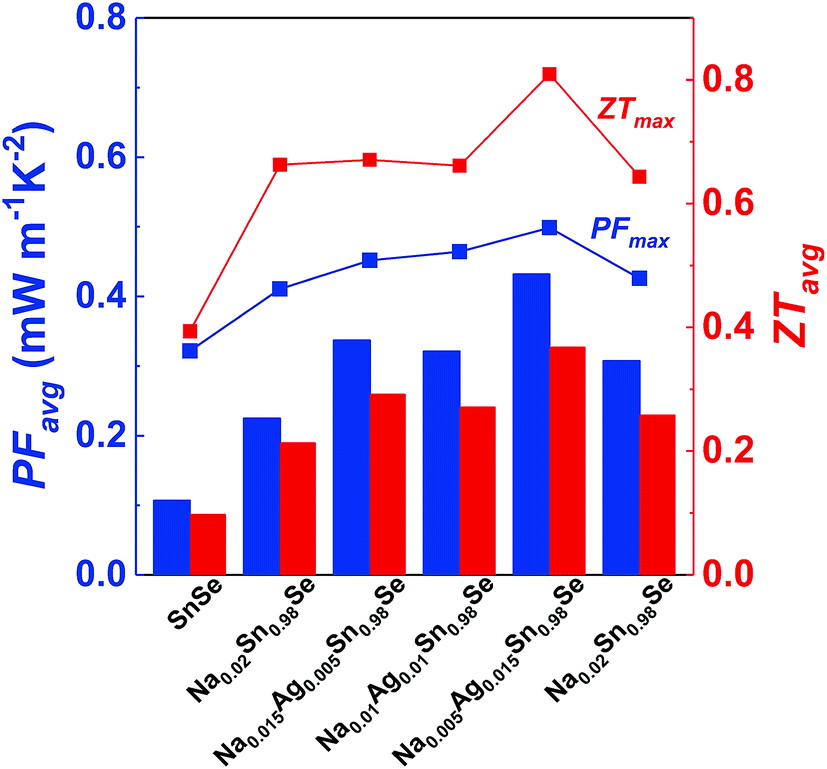
Fig. 5c shows the temperature-dependent dimensionless figure of merit ZT. Considering the influence of both the power factor and the thermal conductivity, Na0.005Ag0.015Sn0.98Se has the highest ZT over the whole temperature range. As a result, ZTmax = 0.81 at 773 K for Na0.005Ag0.015Sn0.98Se. To get a better understanding of the enhancement of average power factor and figure of merit by (Na, Ag) co-doping, the sample dependent average power factor and figure of merit of polycrystalline Na0.02−xAgxSn0.98Se (x = 0, 0.005, 0.001, 0.015, and 0.02) compounds are shown in Fig. 6, as well as the maximum power factor and figure of merit. The calculated average ZT is 0.37 of Na0.005Ag0.015Sn0.98Se from 300 K to 773 K, which is 68% higher than that of Na0.02Sn0.98Se, 43% higher than that of Ag0.02Sn0.98Se, and 277% higher than that of the undoped SnSe,25 respectively.
 |
| | Fig. 6 The sample dependent average power factor (PFavg), average figure of merit (ZTavg), maximum power factor (PFmax), and maximum figure of merit (ZTmax) for Na0.02−xAgxSn0.98Se (x = 0, 0.005, 0.001, 0.015, and 0.02); each bar represents the average value, and each line represents the maximum value. | |
4. Conclusion
In summary, p-type co-doped polycrystalline Na0.02−xAgxSn0.98Se (x = 0, 0.005, 0.001, 0.015, and 0.02) compounds were synthesized via melting, annealing, and spark plasma sintering (SPS). The (Na, Ag) co-doped samples combine the advantages of the Ag and Na single doped samples in terms of the electronic properties. Specifically, the electrical conductivity values of all co-doped samples are higher than those of the single doped samples over the whole temperature range. As a result, the corresponding PF and ZT of Na0.005Ag0.015Sn0.98Se are observed to be the highest among the series of samples, and the maximum values are 0.50 mW cm−1 K−2, and 0.81 at 773 K, respectively. In addition, its calculated PFavg and ZTavg from 300 K to 773 K are 0.43 mW cm−1 K−2 and 0.37, which is 92% and 68% higher than that of Na0.02Sn0.98Se, 40% and 43% higher than that of Ag0.02Sn0.98Se, and 304% and 277% higher than that of SnSe, respectively. The improvements in PFavg and ZTavg are the most beneficial for real world thermoelectric device applications. By estimating the energy barrier between neighboring grains, we found the polycrystalline doped samples possess electrostatic potentials between 68 meV and 85 meV at grain boundaries, which deteriorates the electronic transport properties. Thus, we suggest that by increasing the solubility limits of dopants, and reducing the energy barrier at the grain boundaries, the thermoelectric properties can be further optimized in polycrystalline SnSe.
Conflicts of interest
There are no conflicts to declare.
Acknowledgements
This work is financially supported by the National Natural Science Foundation of China (Grant No. 51632006 and 51521001). T. P. B. and C. U. wish to acknowledge the support from the U.S. Department of Energy, Office of Basic Energy Sciences under Award # DE-SC-0008574.
References
- H. J. Goldsmid, Introduction to thermoelectricity, Springer, 2016 Search PubMed.
- G. J. Snyder and E. S. Toberer, in Materials For Sustainable Energy: A Collection of Peer-Reviewed Research and Review Articles from Nature Publishing Group, World Scientific, 2011, pp. 101–110 Search PubMed.
- K. L. Peng, X. Lu, H. Zhan, S. Hui, X. D. Tang, G. W. Wang, J. Y. Dai, C. Uher, G. Y. Wang and X. Y. Zhou, Energy Environ. Sci., 2016, 9, 454–460 RSC.
- A. T. Duong, V. Q. Nguyen, G. Duvjir, V. T. Duong, S. Kwon, J. Y. Song, J. K. Lee, J. E. Lee, S. Park, T. Min, J. Lee, J. Kim and S. Cho, Nat. Commun., 2016, 7, 13713 CrossRef CAS PubMed.
- L. D. Zhao, S. H. Lo, Y. S. Zhang, H. Sun, G. J. Tan, C. Uher, C. Wolverton, V. P. Dravid and M. G. Kanatzidis, Nature, 2014, 508, 373–377 CrossRef CAS PubMed.
- L. D. Zhao, G. J. Tan, S. Q. Hao, J. Q. He, Y. L. Pei, H. Chi, H. Wang, S. K. Gong, H. B. Xu, V. P. Dravid, C. Uher, G. J. Snyder, C. Wolverton and M. G. Kanatzidis, Science, 2016, 351, 141–144 CrossRef CAS PubMed.
- C. K. Sumesh, M. Patel, K. D. Patel, G. K. Solanki, V. M. Pathak and R. Srivastav, Eur. Phys. J.: Appl. Phys., 2010, 53, 10302 CrossRef.
- M. Jin, H. Shao, H. Hu, D. Li, J. Xu, G. Liu, H. Shen, J. Xu, H. Jiang and J. Jiang, J. Cryst. Growth, 2017, 460, 112–116 CrossRef CAS.
- G. J. Tan, L. D. Zhao and M. G. Kanatzidis, Chem. Rev., 2016, 116, 12123–12149 CrossRef CAS PubMed.
- L.-D. Zhao, C. Chang, G. Tan and M. G. Kanatzidis, Energy Environ. Sci., 2016, 9, 3044–3060 RSC.
- J. P. Heremans, Nat. Phys., 2015, 11, 990 Search PubMed.
- A. Banik and K. Biswas, J. Mater. Chem. A, 2014, 2, 9620–9625 RSC.
- Q. Zhang, E. K. Chere, J. Y. Sun, F. Cao, K. Dahal, S. Chen, G. Chen and Z. F. Ren, Adv. Energy Mater., 2015, 5, 1500360 CrossRef.
- J. A. Hernandez, A. Ruiz, L. F. Fonseca, M. T. Pettes, M. Jose-Yacaman and A. Benitez, Sci. Rep., 2018, 8, 11966 CrossRef PubMed.
- Y. X. Chen, Z. H. Ge, M. Yin, D. Feng, X. Q. Huang, W. Zhao and J. He, Adv. Funct. Mater., 2016, 26, 6836–6845 CrossRef CAS.
- S. R. Popuri, M. Pollet, R. Decourt, F. D. Morrison, N. S. Bennett and J. W. G. Bos, J. Mater. Chem. C, 2016, 4, 1685–1691 RSC.
- X. Shi, K. Zheng, M. Hong, W. Liu, R. Moshwan, Y. Wang, X. Qu, Z.-G. Chen and J. Zou, Chem. Sci., 2018, 9, 7376–7389 RSC.
- S. Wang, S. Hui, K. L. Peng, T. P. Bailey, X. Y. Zhou, X. F. Tang and C. Uher, J. Mater. Chem. C, 2017, 5, 10191–10200 RSC.
- T. R. Wei, C. F. Wu, X. Z. Zhang, Q. Tan, L. Sun, Y. Pan and J. F. Li, Phys. Chem. Chem. Phys., 2015, 17, 30102–30109 RSC.
- E. K. Chere, Q. Zhang, K. Dahal, F. Cao, J. Mao and Z. Ren, J. Mater. Chem. A, 2016, 4, 1848–1854 RSC.
- H. Q. Leng, M. Zhou, J. Zhao, Y. M. Han and L. F. Li, RSC Adv., 2016, 6, 9112–9116 RSC.
- T. R. Wei, G. J. Tan, X. M. Zhang, C. F. Wu, J. F. Li, V. P. Dravid, G. J. Snyder and M. G. Kanatzidis, J. Am. Chem. Soc., 2016, 138, 8875–8882 CrossRef CAS PubMed.
- B. W. Cai, J. H. Li, H. Sun, P. Zhao, F. R. Yu, L. Zhang, D. L. Yu, Y. J. Tian and B. Xu, J. Alloys Compd., 2017, 727, 1014–1019 CrossRef CAS.
- Z. H. Ge, D. S. Song, X. Y. Chong, F. S. Zheng, L. Jin, X. Qian, L. Zheng, R. E. Dunin-Borkowski, P. Qin, J. Feng and L. D. Zhao, J. Am. Chem. Soc., 2017, 139, 9714–9720 CrossRef CAS PubMed.
- C. L. Chen, H. Wang, Y. Y. Chen, T. Day and G. J. Snyder, J. Mater. Chem. A, 2014, 2, 11171–11176 RSC.
- C. H. Chien, C. C. Chang, C. L. Chen, C. M. Tseng, Y. R. Wu, M. K. Wu, C. H. Lee and Y. Y. Chen, RSC Adv., 2017, 7, 34300–34306 RSC.
- L. J. Zhang, J. L. Wang, Q. Sun, P. Qin, Z. X. Cheng, Z. H. Ge, Z. Li and S. X. Dou, Adv. Energy Mater., 2017, 7, 1700573 CrossRef.
- X. Wang, J. T. Xu, G. Q. Liu, X. J. Tan, D. B. Li, H. Z. Shao, T. Y. Tan and J. Jiang, NPG Asia Mater., 2017, 9, e426 CrossRef CAS.
- Q. X. Wang, W. Y. Yu, X. N. Fu, C. Qiao, C. X. Xia and Y. Jia, Phys. Chem. Chem. Phys., 2016, 18, 8158–8164 RSC.
- Y. Suzuki and H. Nakamura, Phys. Chem. Chem. Phys., 2015, 17, 29647–29654 RSC.
- C. Chang, Q. Tan, Y. L. Pei, Y. Xiao, X. Zhang, Y. X. Chen, L. Zheng, S. K. Gong, J. F. Li, J. Q. He and L. D. Zhao, RSC Adv., 2016, 6, 98216–98220 RSC.
- F. Li, W. T. Wang, X. C. Qiu, Z. H. Zheng, P. Fan, J. T. Luo and B. Li, Inorg. Chem. Front., 2017, 4, 1721–1729 RSC.
- T. R. Wei, G. J. Tan, C. F. Wu, C. Chang, L. D. Zhao, J. F. Li, G. J. Snyder and M. G. Kanatzidis, Appl. Phys. Lett., 2017, 110, 053901 CrossRef.
- T. A. Wubieneh, C. L. Chen, P. C. Wei, S. Y. Chen and Y. Y. Chen, RSC Adv., 2016, 6, 114825–114829 RSC.
- Y. J. Fu, J. T. Xu, G. Q. Liu, X. J. Tan, Z. Liu, X. Wang, H. Z. Shao, H. C. Jiang, B. Liang and J. Jiang, J. Electron. Mater., 2017, 46, 3182–3186 CrossRef CAS.
- J. C. Li, D. Li, X. Y. Qin and J. Zhang, Scr. Mater., 2017, 126, 6–10 CrossRef CAS.
- G. Han, S. R. Popuri, H. F. Greer, L. F. Llin, J. W. G. Bos, W. Z. Zhou, D. J. Paul, H. Menard, A. R. Knox, A. Montecucco, J. Siviter, E. A. Man, W. G. Li, M. C. Paul, M. Gao, T. Sweet, R. Freer, F. Azough, H. Baig, T. K. Mallick and D. H. Gregory, Adv. Energy Mater., 2017, 7, 1602328 CrossRef.
- H. Ju, M. Kim, D. Park and J. Kim, Chem. Mater., 2017, 29, 3228–3236 CrossRef CAS.
- Asfandiyar, T. R. Wei, Z. L. Li, F. H. Sun, Y. Pan, C. F. Wu, M. U. Farooq, H. C. Tang, F. Li, B. Li and J. F. Li, Sci. Rep., 2017, 7, 43262 CrossRef CAS PubMed.
- H. F. Guo, H. X. Xin, X. Y. Qin, J. Zhang, D. Li, Y. Y. Li, C. J. Song and C. Li, J. Alloys Compd., 2016, 689, 87–93 CrossRef CAS.
- S. D. Yang, R. K. Nutor, Z. J. Chen, H. Zheng, H. F. Wu and J. X. Si, J. Electron. Mater., 2017, 46, 6662–6668 CrossRef CAS.
- T. Roisnel and J. Rodriguez-Carvajal, European Powder Diffraction, 2001, vol. 378-3, pp. 118–123 Search PubMed.
- F. Lotgering, J. Inorg. Nucl. Chem., 1959, 9, 113–123 CrossRef CAS.
- S. Sassi, C. Candolfi, J. B. Vaney, V. Ohorodniichuk, P. Masschelein, A. Dauscher and B. Lenoir, Appl. Phys. Lett., 2014, 104, 212105 CrossRef.
- G. S. Nolas, J. Sharp and H. J. Goldsmid, Thermoelectrics: basic principles and new materials developments, Springer, Berlin, New York, 2001 Search PubMed.
- J. Orton and M. Powell, Rep. Prog. Phys., 1980, 43, 1263 CrossRef.
- K. Lipskis, A. Sakalas and J. Viscakas, Phys. Status Solidi A, 1971, 4, K217–K220 CrossRef CAS.
- I. I. Ravich, Semiconducting lead chalcogenides, Springer Science & Business Media, 1970 Search PubMed.
|
| This journal is © The Royal Society of Chemistry 2019 |
Click here to see how this site uses Cookies. View our privacy policy here. 
 Open Access Article
 This Open Access Article is licensed under a Creative Commons Attribution-Non Commercial 3.0 Unported Licence
 a,
Xianli Su
a,
Xianli Su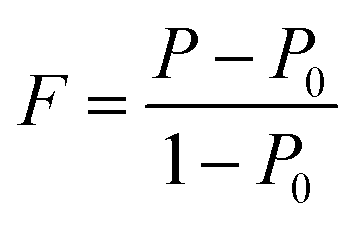


 since acoustic phonons are the prevalent source of charge carrier scattering. The calculated values of the Lorenz numbers cover a range of (1.5–1.8) × 10−8 V2 K−2 as displayed in the inset of Fig. 3d.