
 Open Access Article
 This Open Access Article is licensed under a Creative Commons Attribution-Non Commercial 3.0 Unported Licence
Effects of pH on the biodegradation characteristics of thermophilic micro-aerobic digestion for sludge stabilization
Shugen Liu *a,
Xi Yanga and
Xiaofei Yaob
*a,
Xi Yanga and
Xiaofei Yaob
aFaculty of Environmental Science and Engineering, Kunming University of Science and Technology, Kunming 650500, China. E-mail: bridgelsg@sina.com; Tel: +86 871 6592 0507
bPanzhihua University, Panzhihua 617000, China
First published on 14th March 2019
Abstract
For a thermophilic micro-aerobic digestion (TMAD) system, the pH is closely related to the production of short-chain fatty acids and ammonia release. Batch experiments at different pH values were carried out to elucidate the effects of pH on the biodegradation characteristics of TMAD processes. A digester at pH 9.0 maintained better performance of sludge stabilization than acidic and neutral digestion systems, and the reduction of volatile solids reached ≤41.3% on day-10. We proposed a pathway of proton transfer in the TMAD system. An acidic digestion environment, in general, resulted in K+ deficiency, low enzyme activity, and oxidative stress. An alkaline digestion environment facilitated substrate oxidation, accelerated humification, and prevented the inhibition caused by the accumulated acids or ammonia nitrogen. The pH and digestion time affected the microbial population and species richness significantly. An alkaline digestion system presented lower bacterial diversity and maintained a higher richness of functional microbes such as Paenalcaligenes and Pseudogracilibacillus. Hence, an alkaline digestion system maintained a relatively high oxidase activity, and mitigated the potential oxidative stress for thermophiles.
1. Introduction
The productivity of municipal sewage sludge is very high and its composition is highly complex. Hence, treatment and disposal of such sludge have become urgent problems to be solved for wastewater treatment plants (WWTPs). Reduction and stabilization of sludge as well as anaerobic and aerobic digestion processes are used commonly in most WWTPs. Also, thermophilic micro-aerobic digestion (TMAD) is regarded as a suitable technology for small- and medium-sized WWTPs due to its advantages of simple operation and low-cost investment.1–3 Continuous aeration is supplied for a TMAD system with 4–7% of total solid (TS). The temperature rises gradually to 45–65 °C owing to the heat generated by substrate oxidation and the “jacket” that surrounds the bioreactor to prevent heat loss4,5 which, in turn, enhances the release of organic matter due to rapid cell lysis at thermophilic temperatures. As a result, the TMAD system, in general, maintains the micro-aerobic environment. Also, short-chain fatty acids (SCFAs) accumulate in large quantities, causing the pH to decrease rapidly, which can result in potential adverse effects upon sludge treatment because an appropriate pH is necessary for the growth and metabolism of microbes.6 The hydrolysis of waste sludge is improved significantly at alkaline pH than at other pH,7 and thermophilic anaerobic fermentation can be inhibited severely at strong alkaline or strong acid conditions.8 Some scholars have found that the dominant bacteria in a TMAD system are Gram-positive,9 and that superfluous SCFAs can limit microbial activity and weaken the performance of the TMAD. Jin et al.10 suggested that ferric nitrate can be utilized to overcome SCFA inhibition by chemical precipitation. They found that removal of volatile solids (VS) in the TMAD system was ≤40.28% on day-14, which was more than at day-7 in the control digester with no addition.In a TMAD system, abundant nitrogen may be released into the digestion supernatant due to protein degradation in the extracellular polymeric substance and decay of less temperature-tolerant cells.11 Ammonia is the inevitable product of the released nitrogen because nitrification and denitrification are inhibited under thermophilic-digestion conditions,2,12 and the ammonia produced can solubilize in the bulk sludge water. Thus, the increasing concentration of ammonia in the supernatant may be accompanied by an increase in the pH of the digestion system. Free ammonia (FA) is the major component of total nitrogen under alkaline conditions, so the hydrophobic ammonia molecules can diffuse passively into cells and, eventually, lead to negative effects on sludge stabilization.13 According to recent research, ammonia nitrogen adversely affects thermophilic digestion process through three main ways.14 First, ammonia molecules diffuse passively into cells, leading to proton imbalance and/or K+ deficiency. Second, the ammonium ion (NH4+) induces the efflux of cytoplasmic magnesium ions (Mg2+) through the NH4+/Mg2+ exchange reaction, and lowers enzymatic activity. Lastly, reactive oxygen species (ROS) accumulation causes oxidative stress for thermophilic microbes. In addition, NH4+ can combine with Mg2+ and phosphate ion (PO43−) at an alkaline pH of 8.6–9.5 to form the precipitate magnesium ammonium phosphate (MAP). Xu et al.15 showed that the concentration of ammonia nitrogen declined sharply if a certain amount of MgCl2 and NaH2PO4 were added to thermophilic-digestion system, and that the reduction in VS increased to 38.3% at the digestion time of 12 days. However, ammonia nitrogen cannot be removed in the form of struvites during the early thermophilic-digestion period because the supernatant pH is usually acidic due to organic matter being released rapidly from the sludge.
As mentioned above, too many SCFAs or too much ammonia affects the reduction of VS adversely, and that the pH in a TMAD system is dependent upon SCFA production and ammonia release. However, how the pH affects the TMAD process (including the transformation of organic matter, enzyme activity and microbial community) has not been investigated systematically. We wished to elucidate the effect of pH on the biodegradation characteristics of a TMAD system. We carried out a series of batch experiments at different pH values, and determined the physicochemical properties (e.g., VS reduction, SCFA concentration) and the transformation of organic compounds. Moreover, the oxidase activity and structure of the microbial community of the digested sludge were analyzed to gain deeper insight into the correlation between the pH and sludge stabilization.
2. Materials and methods
2.1. Startup of batch experiments
Excess sludge was collected from the aeration tank of a municipal wastewater treatment plant in Chenggong District, Kunming, China. It was used to prepare the concentrated sludge of ∼5.0% TS after pre-treatment.2Studies using this system have shown that the nitrogen species are closely related to the pH, and that the properties (e.g., VS reduction) and release of organic matter may show significant variations at a condition of high ammonia nitrogen.14 In the present study, comparison tests were carried out in three TMAD digesters. The same amount of NH4HCO3 was added to 2.5 L of sludge and mixed completely, and the pH of the mixing sludge was, respectively, regulated to 5.0, 7.0 and 9.0 with 5 mol L−1 of H2SO4 or NaOH. Then, 2.0 L of the sludge ta different pH values was, respectively, transferred to 3.0 L digesters and, correspondingly, the three digesters were named as “R1”, “R2” and “R3”. The characteristics of the sludge sampled from the three digesters are shown in Table 1.
| Samples | pH | ORP (mV) | TS (g L−1) | VS (g L−1) | SCOD (mg L−1) | TN (mg L−1) | TAN (mg L−1) | TP (mg L−1) | SCFAs (mg L−1 COD) |
|---|---|---|---|---|---|---|---|---|---|
| a ORP, oxidation–reduction potential; SCOD, soluble chemical oxygen demand; TN, total nitrogen; TAN, total ammonia nitrogen; TP, total phosphate. | |||||||||
| Concentrated sludge | 6.8 | −423 | 49.3 | 35.8 | 137 | 150 | 36.0 | 13 | 0 |
| Sludge in R1 | 5.0 | −423 | 49.3 | 35.8 | 489 | 1873 | 446.2 | 66 | 32.1 |
| Sludge in R2 | 7.0 | −426 | 49.2 | 35.8 | 406 | 1821 | 446.6 | 67 | 34.8 |
| Sludge in R3 | 9.0 | −422 | 49.6 | 35.9 | 807 | 1803 | 448.8 | 67 | 38.2 |
Each digester was placed in a water-bath shaker at a constant stirring rate of 50 rpm, and the temperature was increased from 27.5 °C to 45 °C at a rate of 2.5 °C per 6 h, and then maintained at 45 °C for 18 days. Continuous aeration was supplied by an air pump at a flow rate of 26–40 mL min−1.14 During the entire digestion process, sludge was sampled every 2 days to determine its physicochemical properties as well as enzyme activities, and some specific samples were used for molecular-biological analyses.
2.2. Physicochemical analyses
The pH and oxidation–reduction potential (ORP) of sludge samples were measured using a pH meter and ORP meter, respectively.First, 100 mL aliquots of sludge were sampled from the digestion system. Some of them were used for measurements of TS and VS. The other samples were centrifuged immediately at 12![[thin space (1/6-em)]](https://www.rsc.org/images/entities/char_2009.gif) 000 × g for 10 min, and then filtered through 0.45 μm mixed cellulose ester membrane, and the collected filtrate used for further analyses. Measurements of TS, VS, soluble chemical oxygen demand (SCOD), total nitrogen (TN), total ammonia nitrogen (TAN) and total phosphate (TP) were conducted in accordance with standard methods,16 and all of these parameters were determined in triplicate. According to the ammonia ionization equilibrium13 and the determined pH and TAN, the concentration of free ammonia was then calculated.
000 × g for 10 min, and then filtered through 0.45 μm mixed cellulose ester membrane, and the collected filtrate used for further analyses. Measurements of TS, VS, soluble chemical oxygen demand (SCOD), total nitrogen (TN), total ammonia nitrogen (TAN) and total phosphate (TP) were conducted in accordance with standard methods,16 and all of these parameters were determined in triplicate. According to the ammonia ionization equilibrium13 and the determined pH and TAN, the concentration of free ammonia was then calculated.
SCFAs and their constituents (acetic, propionic, iso-butyric, n-butyric, iso-valeric and n-valeric acids) were analyzed using a gas chromatograph (GC 9790 Plus; Fuli Instruments, China) equipped with a flame ionization detector (FID) and DB-FFAP column (30 m × 0.25 mm × 0.25 mm). Nitrogen was the carrier gas with a flux of 30 mL min−1. The injection port and detector were maintained at 250 °C and 280 °C, respectively. The oven of the gas chromatograph was programmed to begin at 50 °C for 5 min, then increase at 10 °C min−1 to 230 °C, and then hold at 230 °C for an additional 5 min. The measured constituents of SCFAs were expressed in mg L−1 COD (e.g., 1 mg L−1 of acetic acid is 1.07 mg L−1 COD, and 1 mg L−1 of butyric acid is 1.82 mg L−1 COD).
The sludge was dried at 60 °C for 24 h and then crushed into a powder. After digestion with nitric acid,16 the collected filtrate was subjected to inductively coupled plasma-atomic emission spectrometry (ICP-AES) using an Iris-Advantage 1000 spectrometer (Thermo Jarrell Ash, USA) to determine the content of metal ions, such as potassium (K+), calcium (Ca2+) and Mg2+.
2.3. Determination of activities of superoxide dismutase (SOD) and catalases (CATases)
After the sample of sludge mixture had been centrifuged, the collected sediment was used to analyze the O2−˙ content using a modified hydroxylamine oxidation method17 Using a Total Superoxide Dismutase Assay Kit (catalog number A001-1; Nanjing Jiancheng Bioengineering Institute, China) and the Chinese National Standard GB/T 23195-2008 (Method for the Determination of Catalase in Bee Pollen – Ultraviolet Spectrophotometry), the activities of SOD and CATase were determined, respectively.142.4. Three-dimensional excitation and emission matrix fluorescence (3D-EEMF) spectroscopy
3D-EEMF spectroscopy was undertaken using a fluorescence spectrophotometer (F-7000; Hitachi, Japan) on a 3D scan mode. EEMF data were obtained with excitation (Ex) and emission (Em) wavelengths ranging from 200 nm to 500 nm at 4 nm intervals. EEMF data were recorded at a scan speed of 12000 nm min−1 with 5.0 nm slits for Ex and Em. Furthermore, the contour interval in the spectra was 10.
2.5. Molecular-biological analyses
Extraction of genomic DNA from the sludge sample was conducted using a FastDNA™ SPIN kit for Soil (MP Biomedicals, USA). The universal primers 515F (5′-GTG CCA GCM GCC GCG GTA A-3′) and 806R (5′-GGA CTA CHV GGG TAT CTA AT-3′) with a barcode were used for amplification of the V4 region of the bacterial 16S rRNA gene. Polymerase chain reaction (PCR) products were purified using a QIAquick™ PCR Purification kit (Qiagen, USA) and then sequenced using an Illumina HiSeq™ PE 2500 platform (Novogene, China). Bioinformatics analyses of the sequence data were undertaken according to the work of Liu and colleagues,18 then alpha diversity and beta diversity were calculated using the QIIME software package, with multiple indices (e.g., observed species, Shannon index and Chao1). The sequences generated by our study have been deposited in the National Center for Biotechnology Information database under accession number PRJNA12398.3. Results and discussion
3.1. Removal efficiency of VS
As the most important indicator of sludge stabilization, VS reduction at different pH values was investigated first (Fig. 1). All the VS content in the digested sludge samples decreased gradually, and the digesters R1, R2 and R3 showed different removal efficiency of VS. As the TMAD system proceeded, the temperature of each digestion system was increased to 45 °C at 42 h, and then the three digesters began to maintain thermophilic digestion thereafter. The VS reduction of R1, R2 and R3 on day-2 was 2.4%, 13.6%, and 15.4%, respectively. For R3, it always maintained higher VS reduction than the R1 and R2, and its removal efficiency of VS reached ≤41.3% on day-10, thereby meeting the guideline stipulated by GB18918-2002 that the degradation of organic matter must be >40% if aerobic digestion is applied to stabilize the sludge produced from WWTPs. As the digestion time was extended to 16 days, the increments of VS reduction in the three digesters were no longer obvious because more non-biodegradable or recalcitrant materials accumulated in the sludge. At the end of the digestion period (20 days), the VS reduction in the digesters R1, R2 and R3 was 25.4%, 38.4%, and 49.7%, respectively. It was obvious that the digester at pH 9.0 would be suitable for sludge stabilization. Our results also revealed that an alkaline condition could facilitate the reduction of organic matter during thermophilic digestion. | ||
| Fig. 1 VS reduction at different pH values. | ||
3.2. Transformation of carbonaceous components
As shown in Fig. 2a, the SCOD in the TMAD system first experienced a significant increase during the initial digestion (≤6 days), then a steady decline from 8 days to 14 days, followed by moderate fluctuations after 16 days. The SCOD concentration in R3 increased from 807 mg L−1 at the beginning of digestion to 13480 mg L−1 on day-8, and then declined moderately thereafter. In general, R3 presented a relatively higher SCOD than that of the other two digesters. The obtained result was also in line with the difference in the VS reduction in the three digesters.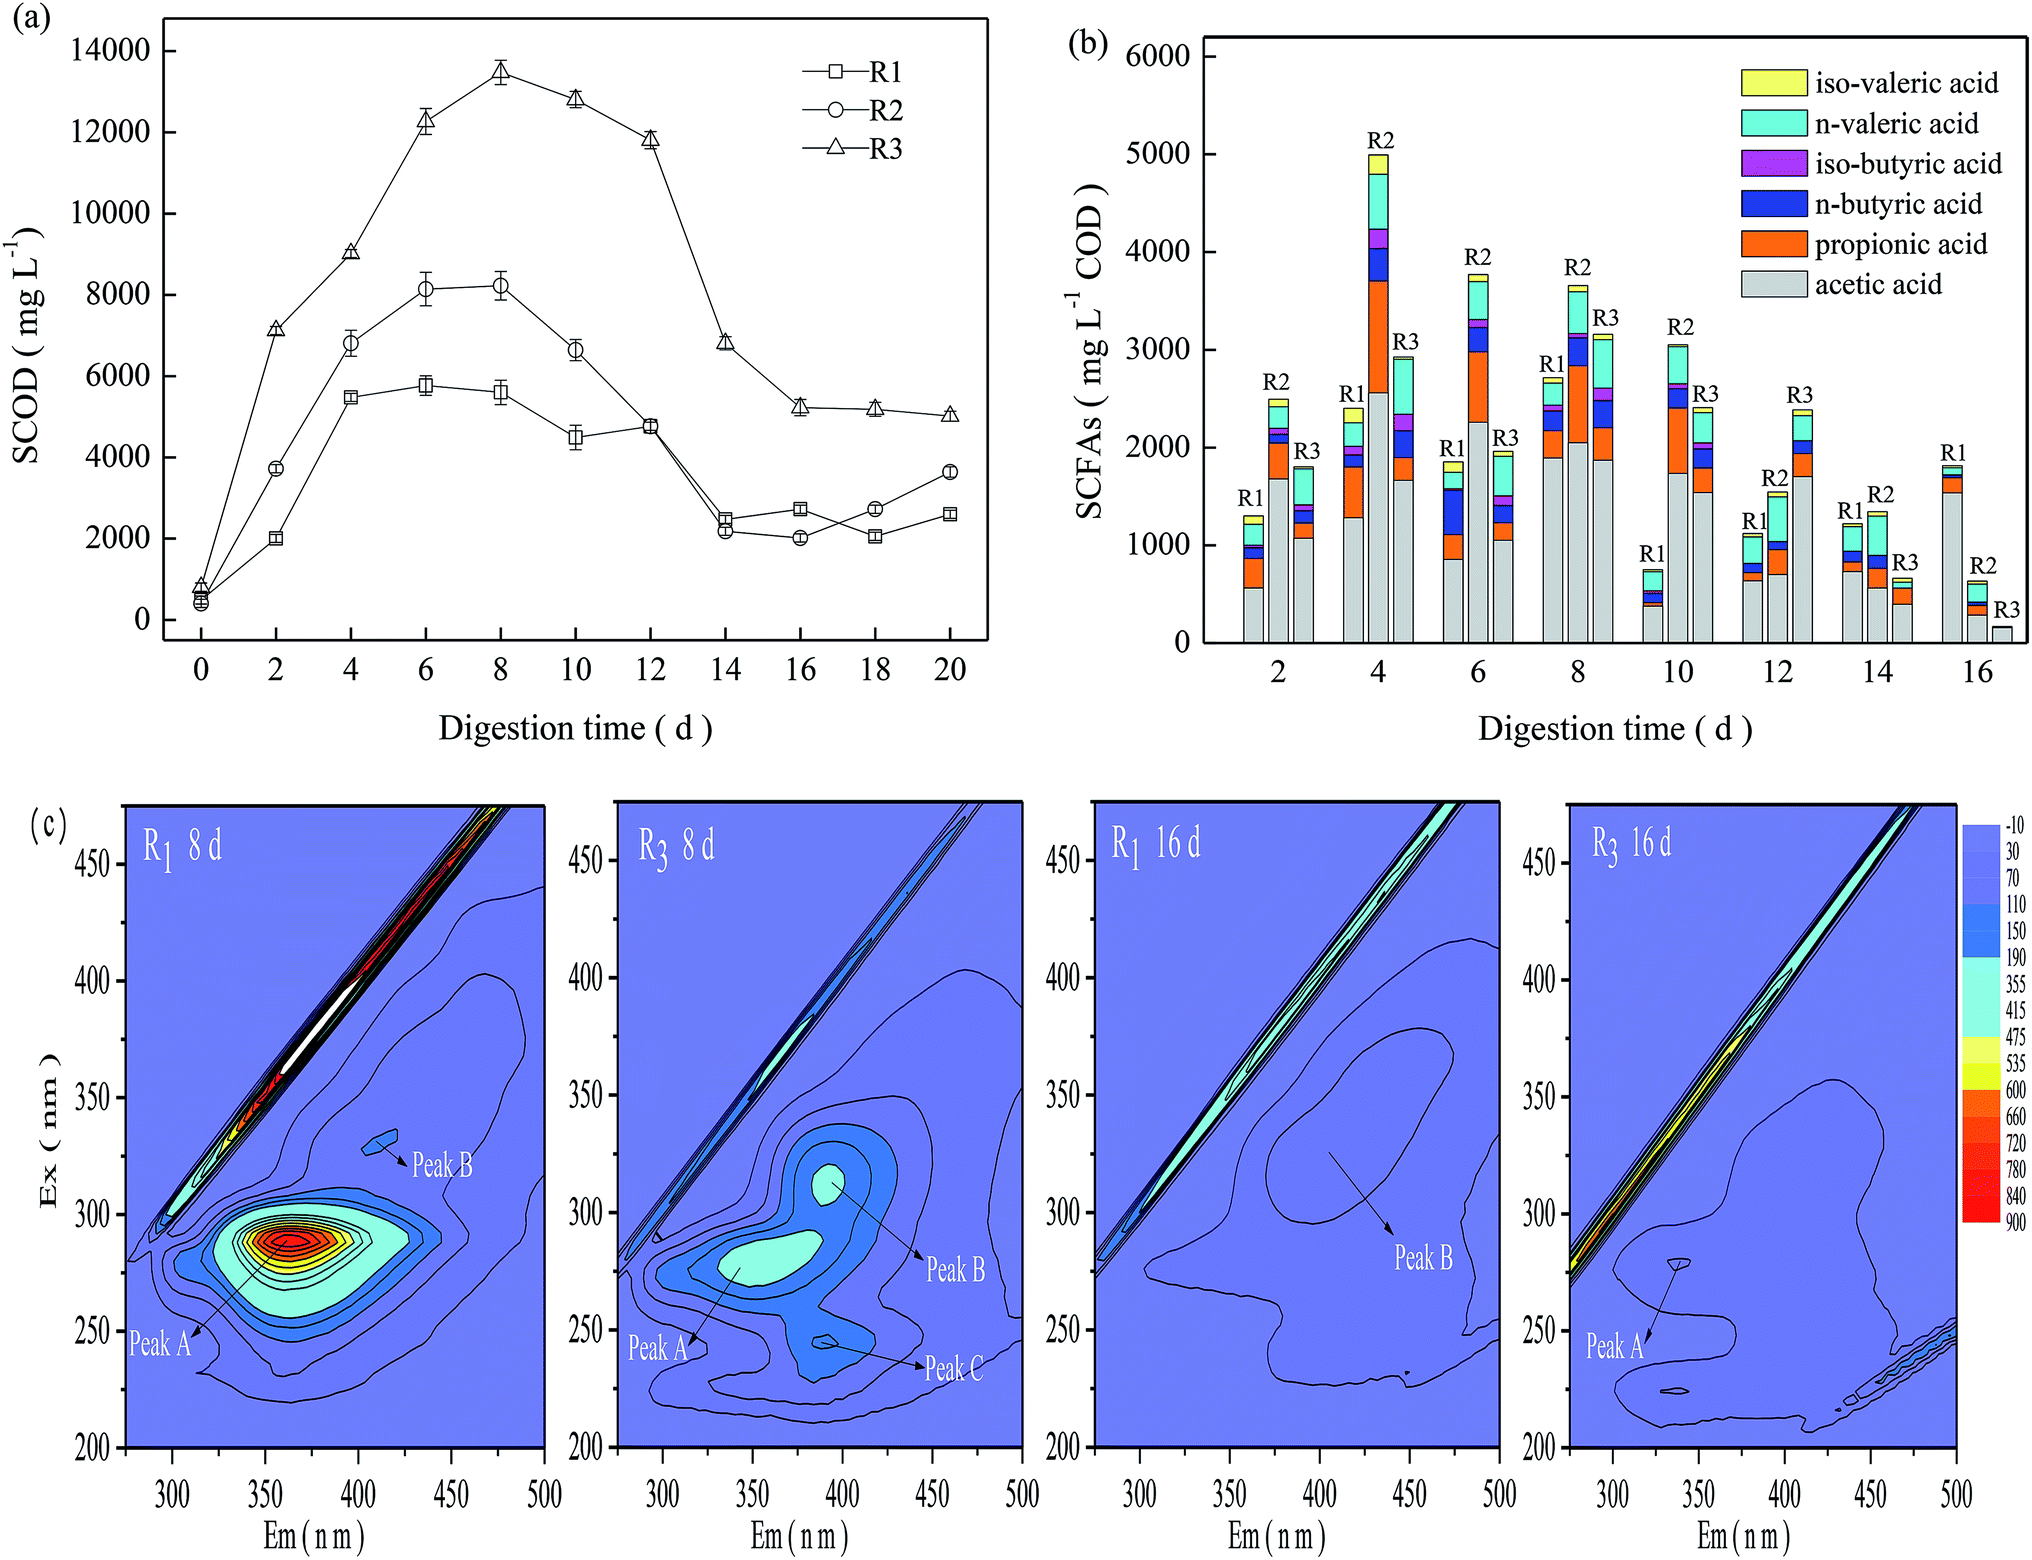 | ||
| Fig. 2 Variations of carbonaceous components: SCOD (a), SCFAs (b), and metabolic intermediates (c). | ||
As a sludge experiences thermophilic digestion, those less temperature-tolerant microorganisms die and abundant organic matter may be released rapidly into the digestion supernatant due to cell lysis,2,11 resulting in VS reduction and SCFA production. Total SCFAs and their constituents in the three digesters varied in different ways (Fig. 2b). In general, the three digesters maintained relatively higher total SCFAs during a digestion time of 2–8 days, and acetic acid was the major component of SCFAs. Compared with R2 and R3, R1 maintained lower total SCFAs before a digestion time of 12 days, but the total SCFAs on day-20 were ≤1815 mg L−1 COD, obviously higher than that in R2 and R3. R3 obtained higher VS reduction than R2, but it exhibited relatively lower total SCFAs, revealing that SCFA accumulation in the TMAD system was related to their production but also dependent upon their degradation or utilization. Based on the VS reductions and variations of SCOD and SCFAs, we concluded that a mild alkaline pH could enhance substrate oxidation in a micro-aerobic digestion environment.
Considering the significant difference between acidic and alkaline conditions, samples on days 8 and 16 were collected from R1 and R3 to track transformations of florescent organic compounds. As shown in Fig. 2c, three main peaks could be identified readily in the EEMF spectra. Peak A of R1-8d and R3-8d samples were observed at Ex/Em wavelength pairs of 291/358–368 nm and 279/339–371 nm, respectively, which were assigned to PN-like substances.19 Peak B of the R3-8d and R1-16d samples were identified at Ex/Em wavelength pairs of 311/383–401 nm and 324/392–415 nm, respectively, which were related to humic acid-like substances.20 Peak C appeared only in the R3-8d sample, and was observed at Ex/Em wavelength pairs of 241/384–401 nm, and assigned to fulvic acid-like substances. The fluorescence intensity of peak A for the R1-8d-digested sludge was up to 782, but it could not be detected at a digestion time of 16 days. The fluorescence intensity of peak B for the R1 digestion system was low, and its intensity on days 8 and 16 was <110. In contrast, three characteristic peaks, A, B and C, appeared in the R3-8d-digested sludge and their corresponding intensity was 229, 200, and 154; however, these peaks decreased rapidly at the late digestion period, and peaks B and C could not be detected in the R3-16d sample. From the time the TMAD system was started, abundant carbonaceous and nitrogenous components in R3 were released into the digestion supernatant (Fig. 2b), causing potential adverse effects on sludge digestion.7,9 However, the alkaline environment accelerated humification, and the R3-8d-digested sludge continued to have higher levels of humic substances, which could mitigate the inhibition caused by accumulated acids or ammonia nitrogen. As digestion continued, the released organic matter could be degraded in a timely manner due to low VS reduction. Then, the humic substances could be disaggregated into simple intermediates and, finally, converted to carbon dioxide (CO2), ammonia and other gaseous products under the synergism of an abiotic reaction and microorganism degradation.21 These findings suggested that transformation of humic substances at an alkaline condition helped a TMAD system to cope with the adverse effects of the external environment, and facilitated sludge stabilization.
3.3. Variations in nitrogen species
In the present study, NH4HCO3 was added to sludge before startup of the digestion system. The initial concentration of TN and TAN in the three TMAD digesters was 1803–1873 and 446.2–448.8 mg L−1, respectively. During the entire digestion period, the TN concentration in the three digesters fluctuated significantly, but in a similar manner (Fig. 3a). The TAN concentration increased rapidly during the early digestion period, and then decreased moderately from day-2 to the end of the digestion period. Furthermore R3 had a relatively lower TAN concentration than that of the other two digesters (Fig. 3b). | ||
| Fig. 3 Variations of TN (a), TAN (b), pH (c), and FA (d) at different pH values. | ||
In the batch experiments, the pH changed as a result of hydrolysis, fermentation, ammonia release or other processes, and it did not show a significant variation (blue symbol in Fig. 3c). To maintain a stable digestion environment, 5 mol L−1 of H2SO4 or NaOH was added to the digestion system to maintain a constant pH, and the pH of R1, R2 and R3 were regulated to a designed value of 5.0, 7.0, and 9.0, respectively, every 24 h. Based on the TAN concentration and pH, the calculated FA is shown in Fig. 3d. The FA concentration in R1 was always <0.5 mg L−1 due to the low pH, and the FA concentration in R2 fluctuated from 31 mg L−1 to 40 mg L−1 after a digestion time of 2 days. In contrast, R3 presented a significantly higher FA concentration due to its alkaline pH, and the FA concentration was ≤1355 mg L−1 on day-2. Though FA can pass through cell membranes and result in potential inhibition for a digestion system,13,22 R3 achieved a higher VS reduction than the other two digesters with a low FA concentration. This finding revealed that FA is not a direct indicator of ammonia inhibition, and that inhibition of ammonia nitrogen may be closely related to nitrogen species and their concentrations as well as other specific digestion environments. This hypothesis is supported by recent research suggesting that the TAN concentration is a more suitable indicator to characterize ammonia inhibition.14
As thermophilic digestion proceeded, abundant nitrogen was released into the supernatant due to the degradation of protein in extracellular polymeric substances and the decay of less temperature-tolerant cells,3 causing the TN concentration to increase in the early digestion period (Fig. 3a). For a TMAD system, ammonia is an inevitable product of deamination of peptide and amino-acid products following protein hydrolysis.11,23 Free ammonia can be “stripped” from a digester due to continuous aeration, causing the TN concentration to decrease. R1 and R2 obtained moderate VS reductions from 4 days to 6 days, and their respective increments reached 3.2% and 1.4% (Fig. 1). However, the TN concentration in R1 and R2 decreased significantly from 4 days to 6 days (Fig. 3a), and the FA concentration was <38 mg L−1 in both digesters, so the decrease in the TN concentration was not related to ammonia stripping. Based on these results, we inferred that viable thermophilic microbes could utilize soluble nitrogen through anabolism during TMAD, contributing to a decrease in the TN concentration: this finding was not been reported before. Overall, the TN concentration was dependent on VS reduction and ammonia stripping, as well as the metabolic activity of thermophilic microbes.
3.4. Activity of SOD and CATases
We wished to investigate the effects of ROS on sludge stabilization, so R1 and R3 were selected to determine the activity of SOD and CATases. O2−˙ could not be detected in the first 2 days but, thereafter, it increased obviously (Fig. 4a). The O2−˙ content in R1 and R3 showed no significant difference, and presented a gradual decrease after 12 days in R1 and R3. Compared with R1, the activities of oxidases such as SOD and CATase in R3 were relatively higher during the entire digestion process (Fig. 4b and c), but the oxidase activity exhibited obvious fluctuations due to the complex digestion condition. | ||
| Fig. 4 Activities of superoxide anion radicals (a), SOD (b) and CATase (c) during digestion. | ||
Excessive ROS can destroy intracellular components, leading to adverse effects on microbial activities.24 The digestion time was 8–12 days, and R1 had a higher O2−˙ content, but low activities of SOD and CATases were noted (Fig. 4b and c). Hence, the excessive O2−˙ content may have caused oxidative stress for thermophilic microbes,25 and the increment in VS reduction was only 1.0% in R1 (Fig. 1). For R3, the O2−˙ content was approximately the same as that in R1, but it exhibited a relatively higher oxidase activity. Therefore, ROS could decompose in a timely manner to mitigate oxidative stress for the thermophiles. Consequently, the VS reduction in R3 reached ≤49.3% at the end of digestion (20 days).
3.5. Effects of acidic and alkaline environments on sludge stabilization
Considering the distinct differences among TMAD systems at different pH values, R1 and R3 were used to investigate the effects of acidic and alkaline environments on sludge stabilization. As thermophilic digestion proceeded, R1 and R3 presented obvious differences within a range of 6–12 days. Then, the typical digestion solution and sludge solids on day-8 were sampled to determine the metal elements. ICP-AES data are shown in Table 2. Compared with R3, the supernatant in R1 maintained a higher concentration of K+, Ca2+, and Mg2+, which was 291, 663 and 259 mg L−1, respectively, whereas the sludge contained a lower concentration of K+, Mg2+ and Ca2+.| Elements | K, mg L−1 | Ca, mg L−1 | Mg, mg L−1 | Elements | K, mg g−1 | Ca, mg g−1 | Mg, mg g−1 |
|---|---|---|---|---|---|---|---|
| Supernatant (R1) | 291 | 663 | 259 | Sludge solids (R1) | 1.9 | 13.9 | 5.2 |
| Supernatant (R3) | 262 | 16.2 | 3.16 | Sludge solids (R3) | 11.5 | 43.6 | 18.4 |
Based on the rules of ammonia inhibition14 and the results obtained in the present study, a potential pathway of proton transfer (Fig. 5) in the TMAD system was proposed to clarify the effects of pH on sludge stabilization. As mentioned above, the sludge treatment in R3 was carried out in an alkaline environment (pH 9.0) and the digestion system accumulated abundant SCOD and SCFAs (Fig. 2a and b) during a digestion period of 2–12 days, and the FA concentration was ≥990 mg L−1. Consequently, abundant FA in R3 could diffuse into the cells of thermophiles (pathway I). However, K+ deficiency may not occur because an alkaline condition can prevent hydrogen ions (H+) being transported into cells by a proton pump mechanism. Thus, the sludge in R3 had higher K+ content: 11.5 mg g−1 of dried sludge (Table 2). As a result, cells can maintain normal physiological functions as before treatment. As the TMAD system maintained alkaline digestion, the extracellular concentration of NH4+ was low, and efflux of cytoplasmic Mg2+ through the exchange of NH4+/Mg2+ (pathway II) was no longer obvious, so the enzyme activity was not affected adversely. However, the soluble Mg2+ in the supernatant could combine with NH4+ and PO43− under alkaline conditions to precipitate in the form of struvites,15 so the sludge solids in R3 obtained a high content of Mg2+ (Table 2). In the TMAD system, molecular oxygen (O2) can couple with the reduced forms of nicotinamide adenine dinucleotide (NADH-H+) or nicotinamide adenine dinucleotide phosphate (NADPH-H+) to generate the ROS O2−˙.14,26 The latter can decompose to hydrogen peroxide (H2O2) and be converted subsequently to water and O2.2 Then, ROS are scavenged by induced oxidative enzymes, such as SOD and CATases, and oxidative stress for the thermophiles may be alleviated (pathway III). Conversely, a highly active H (proton) produced from pathway III may be preserved in the solution,26 and can combine with ammonia to form the NH4+. As shown in Fig. 5, NADH-H+ or NADPH-H+ can be consumed continuously with O2−˙ production. Then, these metabolic intermediates (denoted as MH2) can enter cells through group translocation6 and pass the proton to NAD+ or NADP+ to meet the demand for NADH-H+ or NADPH-H+.
 | ||
| Fig. 5 The proposed pathway of proton transfer in the TMAD system. | ||
The digestion system was in an acidic condition, so there was almost no FA in R1 at pH 5.0 (Fig. 3d); hence, ammonia did not appear in the thermophiles (pathway I). After H+ entered cells through a proton pump mechanism, the intracellular pH decreased correspondingly, and the K+ content in sludge solids decreased to 1.9 mg g−1 of dried sludge (Table 2), thereby deteriorating the digestion microenvironment. In addition, Mg2+ in enzymes could be substituted by ionized ammonia (pathway II), resulting in a low enzyme activity. Compared with the alkaline digestion system, R1 maintained a slightly higher O2−˙ content after 8 days, but the oxidase activities were relatively lower (Fig. 4b and c). Hence, we concluded that the thermophiles in R1 were most likely to be affected by oxidative stress. Under the influence of the factors mentioned above (K+ deficiency, low enzyme activity, and oxidative stress), the sludge stabilization in R1 was inhibited obviously, and the VS reduction was only 25.4% on day-20 (Fig. 1), much lower than that in R3. The aforementioned findings revealed that transfer of a proton and ammonia exhibited obvious differences under acidic and alkaline environments, and that pH was closely related to sludge stabilization.
4. Microbial community
4.1. Richness and diversity of bacterial phylotypes
The raw sludge and the other six samples, collected from R1, R2, and R3 at a digestion time of 10 and 20 days, were used to investigate bacterial diversity, adopting the primers 515F and 806R to amplify the hypervariable V4 region of the 16S rRNA gene. Sequencing information, the diversity index, and estimators of richness are summarized in Table 3. After removing low-quality sequences and chimeras, all of the sequence coverage for seven samples were ≥98.7%, and the effective sequences for each sample were >80000. The Shannon index (H) was 5.06–7.90 (lower H values denote lower α-diversity), and the Chao1 index was 751–1629. As sludge digestion proceeded, the number of operational taxonomic units (OTU) as well as Chao1 and Shannon indices decreased moderately on day-20. Compared with the digestion system under an acidic condition, R3 at pH 9.0 showed lower bacterial diversity and species richness, and the OTU at the end of digestion time decreased to the lowest value of 722.
| Sample | Number of sequences | OTU number | Observed species | Coverage, % | Shannon index | Chao1 index |
|---|---|---|---|---|---|---|
| a Samples Y pH5-M, Y pH7-M, and Y pH9-M were, respectively, collected from the digesters R1, R2, and R3 on day-10, and, correspondingly, samples Y pH5-E, Y pH7-E, and Y pH9-E were collected from the three digesters at the end of digestion (20 days). | ||||||
| Raw sludge | 80177 |
1344 | 1217 | 98.9 | 7.69 | 1475 |
| Y pH5-M | 80269 |
1509 | 1230 | 98.7 | 7.90 | 1629 |
| Y pH7-M | 80172 |
1332 | 1012 | 98.9 | 6.89 | 1244 |
| Y pH9-M | 80072 |
1147 | 853 | 99.0 | 6.09 | 1124 |
| Y pH5-E | 80151 |
1208 | 916 | 98.8 | 5.96 | 1248 |
| Y pH7-E | 80226 |
1132 | 838 | 99.1 | 6.50 | 1078 |
| Y pH9-E | 80226 |
722 | 510 | 99.3 | 5.06 | 751 |
The major phyla for the three digestion systems are shown in Table 4. When thermophilic digestion was carried out under neutral and alkaline conditions, the most abundant phylum of the microorganisms was Firmicutes, with an abundance of ≥29.0%, and the maximum percentage for the sample Y pH9-E was ≤84.0%. These results are in accordance with the work of Cheng and colleagues.4 The found that bacterial-community structures changed dynamically in relation to the temperature and species in the phylum of Firmicutes, and that microorganisms from Firmicutes were typical thermophilic microorganisms.4 For R1 at pH 5.0, the dominant phylum on day-10 was Proteobacteria (with 67.1% of sequences) and the richness of Firmicutes was only 10.7%; nevertheless, the species in the phylum Firmicutes increased rapidly to 29.8% at the end of the digestion period. Besides Proteobacteria and Firmicutes, other important phyla, such as Bacteroidetes and Acidobacteria, appeared in the digested sludge, and their richness was <2.5%. These data suggest that pH and digestion time can affect the microbial population and species richness significantly.
| Phylum/class | Genus | Y pH5-M | Y pH7-M | Y pH9-M | Y pH5-E | Y pH7-E | Y pH9-E |
|---|---|---|---|---|---|---|---|
| a The highest richness of the genera is presented in bold type. | |||||||
| α-Proteobacteria | Defluviicoccus | 1.64 | 0.34 | 1.08 | 0.19 | 0.13 | 0.01 |
| Reyranella | 1.45 | 0.95 | 0.55 | 0.80 | 0.83 | 0.03 | |
| Roseomonas | 1.11 | 0.67 | 0.35 | 0.50 | 0.56 | 0.02 | |
| β-Proteobacteria | Diaphorobacter | 2.65 | 0.60 | 0.07 | 1.91 | 0.34 | 0.01 |
| Candidatus Accumulibacter | 1.50 | 0.22 | 0.05 | 0.68 | 0.12 | 0.01 | |
| Dechlorosoma | 1.26 | 0 | 0 | 0.21 | 0 | 0 | |
| Paenalcaligenes | 0.10 | 0.18 | 2.29 | 0.02 | 2.02 | 4.67 | |
| γ-Proteobacteria | Pseudomonas | 0.29 | 1.87 | 0.03 | 0.49 | 11.87 | 0.08 |
| Gammaproteobacteria | 2.32 | 0.46 | 0.15 | 0.93 | 0.26 | 0.00 | |
| Acinetobacter | 5.22 | 3.28 | 0.01 | 0.80 | 0.07 | 0.01 | |
| Hydrogenophilalia | Dechlorobacter | 2.95 | 1.12 | 0.03 | 1.70 | 0.73 | 0.01 |
| Firmicutes | Clostridiales | 2.50 | 0.74 | 2.54 | 0.31 | 0.05 | 0.23 |
| Alkaliphilus | 0.04 | 0.01 | 1.05 | 0.00 | 0.00 | 0.01 | |
| Tissierella | 0.44 | 14.26 | 12.77 | 0.04 | 3.09 | 1.99 | |
| Proteiniborus | 0.11 | 13.60 | 0.05 | 0.01 | 2.86 | 0.07 | |
| Caldicoprobacter | 0.02 | 1.55 | 0.47 | 0.01 | 0.48 | 0.89 | |
| Acetoanaerobium | 0.12 | 1.28 | 0.02 | 0.00 | 0.03 | 0.00 | |
| Proteiniclasticum | 0.64 | 1.16 | 0.84 | 0.02 | 0.25 | 0.02 | |
| Erysipelothrix | 0.06 | 0.16 | 22.81 | 0.03 | 0.06 | 1.45 | |
| Tepidimicrobium | 0.02 | 0.02 | 5.59 | 0.02 | 0.02 | 5.47 | |
| Amphibacillus | 0.01 | 0.00 | 3.64 | 0.01 | 0.01 | 0.27 | |
| Pseudogracilibacillus | 0.03 | 0.04 | 1.29 | 0.03 | 0.08 | 25.34 | |
| Sporosarcina | 0.12 | 0.45 | 0.22 | 2.69 | 0.91 | 2.23 | |
| Hydrotalea | 0 | 0 | 0 | 2.68 | 1.04 | 0.01 | |
| Cohnella | 0 | 0 | 0 | 1.46 | 0.4 | 0 | |
| Aneurinibacillus | 0.02 | 0 | 0 | 1.43 | 0 | 0.01 | |
| Bacillus | 0.11 | 0.69 | 0.01 | 3.79 | 0.12 | 0.06 | |
| Brevibacillus | 0.00 | 0.00 | 0.00 | 3.47 | 0.12 | 0.00 | |
| Actinobacteria | Acidimicrobiia | 0.23 | 0.31 | 0.19 | 0.30 | 0.51 | 0.02 |
| unidentified_Actinobacteria | 0.65 | 0.43 | 0.15 | 0.20 | 0.15 | 0.09 | |
| Bacteroidetes | Macellibacteroides | 0.54 | 0.26 | 0.00 | 0.06 | 0.00 | 0.00 |
| Hydrotalea | 0 | 0 | 0 | 2.41 | 0 | 0 | |
| Others | Others | 73.85 | 55.35 | 43.75 | 72.8 | 72.89 | 56.99 |
4.2. Analyses of bacterial genera
As shown in Table 4, the bacterial flora presented distinct differences at the genus level, and no dominant species were present in six samples simultaneously. For the acidic digestion system, the major genera at a digestion time of 10 days were Diaphorobacter, Acinetobacter, Dechlorobacter and Defluviicoccus, all of which belonged to the phylum of Proteobacteria. However, the genera in the phylum Firmicutes, including Sporosarcina, Hydrotalea and Bacillus, developed into the dominant microorganisms, with a maximum abundance of 3.8% on day-20. R2 maintained a neutral digestion environment, and the concentration of SCFAs on day-10 was obviously higher than that in R1 and R3 (Fig. 2b). Hence, acidogenic bacteria, such as Proteiniborus, Tissierella, and Pseudomonas, became the major genera, with a respective richness of 13.6%, 14.3%, and 1.9%. The optimal pH for Pseudomonas species was 7.0.27 Hence, the bacteria Pseudomonas became the primary genus and presented 11.9% of the total sequences at the end of the digestion period.Under alkaline conditions, alkalophiles such as Erysipelothrix, Tissierella, and Tepidimicrobium were the major genera on day-10, and their respective richness reached 22.8%, 12.8%, and 5.6%. However, Pseudogracilibacillus was the most abundant genera on day-20, with a richness of 25.3%, and Paenalcaligenes and Tepidimicrobium were the other important bacteria, with a corresponding abundance of 4.7% and 5.5%. Pseudogracilibacillus and Paenalcaligenes were oxidase- and catalase-positive,28,29 and their appearance was consistent with the results showing that R3 maintained high oxidase activity (Fig. 4b and c) and achieved rapid VS reduction (Fig. 1). Though the alkaline digestion system presented lower bacterial diversity compared with that of R1 and R2, it maintained a relatively higher richness of functional microbes, which may be helpful for sludge stabilization.
5. Conclusions
For the TMAD process, the pH is closely related to sludge stabilization. VS reduction in the alkaline digestion system reached 41.3% on day-10, obviously higher than that in the acidic and neutral environments. The most abundant phylum in the alkaline digestion system was Firmicutes, and the typical functional microbes were Pseudogracilibacillus, Paenalcaligenes, and Tepidimicrobium, with the maximum richness of 25.3%. Physicochemical properties, such as the concentration of SCFAs and the transformation of organic compounds, exhibited distinct differences at different pH values.An alkaline environment accelerated humification in the TMAD system, and a mildly alkaline pH could facilitate substrate oxidation and the VS reduction. The transfer of protons and ammonia showed obvious differences under acidic and alkaline environments. Our proposed pathway of proton transfer may enable deeper insights into the correlation between the pH and sludge stabilization.
Conflicts of interest
There are no conflicts to declare.Acknowledgements
This work was supported financially by the National Natural Science Foundation of China (51868029) and the Yunnan Applied Basic Research Projects (2016FB093).References
- I. Bartkowska, Process Saf. Environ. Prot., 2015, 98, 170–175 CrossRef CAS.
- S. G. Liu, N. W. Zhu and L. Loretta, Bioresour. Technol., 2012, 104(2–3), 266–273 CAS.
- USEPA, Environmental Protection Agency, Washington, 1990, Report EPA/625/10-90/007.
- H. J. Cheng, Y. Asakura, K. Kanda, R. Fukui, Y. Kawana and Y. Okugawa, J. Biosci. Bioeng., 2018, 126(2), 196–204 CrossRef CAS PubMed.
- M. N. Layden, D. C. Mavinic, H. G. Kelly and R. Moles, Environ. Eng. Sci., 2007, 6, 665–678 CrossRef.
- Q. Y. Zhou and S. F. Wang, Microbiology of Environmental Engineering, Higher Education Press, Beijing, 4th edn, 2008, pp. 130–134, 176–178 Search PubMed.
- P. Zhang, Y. G. Chen and Q. Zhou, Water Res., 2009, 43, 3735–3742 CrossRef CAS PubMed.
- X. S. Meng, D. W. Yu, Y. S. Wei, Y. X. Zhang, Q. F. Zhang and Z. Y. Wang, Process Biochem., 2018, 69, 144–152 CrossRef CAS.
- D. Hayes, L. Izzard and R. Seviour, Syst. Appl. Microbiol., 2011, 34, 127–138 CrossRef CAS PubMed.
- N. B. Jin, Y. Shao, H. P. Yuan, Z. Y. Lou and N. W. Zhu, Chem. Eng. J., 2015, 265, 9–15 CrossRef CAS.
- X. S. Li, H. Z. Ma, Q. H. Wang, S. Matsumoto and T. Maeda, Bioresour. Technol., 2009, 100, 2475–2481 CrossRef CAS PubMed.
- O. Yenigün and B. Demirel, Process Biochem., 2013, 48(5–6), 901–911 CrossRef.
- M. Kayhanian, Environ. Technol., 1998, 20, 355–365 CrossRef.
- S. G. Liu, X. Yang and X. F. Yao, Chemosphere, 2018b, 213, 268–275 Search PubMed.
- C. W. Xu, H. P. Yuan, Z. Y. Lou, G. Zhang, J. Gong and N. W. Zhu, Bioresour. Technol., 2013, 149(12), 225–231 CrossRef CAS PubMed.
- State Environmental Protection Administration of China (SEPAC), Analytical and Monitoring Methods of Water and Wastewater, China Environmental Science Press, Beijing, 4th edn, 2002 Search PubMed.
- S. G. Liu, R. Xiao, X. Yang and P. Ning, CN 201710952579.5, 2016.
- S. G. Liu, Q. C. Wang, X. R. Li, Q. Q. Guan and X. Yang, J. Environ. Eng., 2018a, 144(6), 04018036 Search PubMed.
- D. Wei, L. Shi, T. Yan, G. Zhang, Y. F. Wang and B. Du, Bioresour. Technol., 2014, 171, 211–216 CrossRef CAS PubMed.
- Z. C. Wang, M. C. Gao, Z. Wang, Z. L. She, Q. B. Chang, C. Q. Sun, J. Zhang, Y. Ren and N. Yang, Chemosphere, 2013, 93, 2789–2795 CrossRef CAS PubMed.
- S. X. Cheng, Introduction of Humic Substances, Chemical Industrial Press, Beijing, 2007, pp. 41–43, 53–54 Search PubMed.
- Y. Chen and J. Cheng, Bioresour. Technol., 2008, 99(10), 4044–4064 CrossRef CAS PubMed.
- H. C. Willer, P. J. L. Derikx and T. K. Vijn, Bioresour. Technol., 1998, 64, 47–54 CrossRef.
- S. Miwa, J. St-Pierre, L. Partridge and M. D. Brand, Free Radical Biol. Med., 2003, 35(8), 938–948 CrossRef CAS PubMed.
- L. X. Ni, X. T. Jie, P. F. Wang, S. Y. Li, G. X. Wang, Y. P. Li, Y. Li and K. Acharya, Chemosphere, 2015, 121, 110–116 CrossRef CAS PubMed.
- J. Zheng and J. H. Chen, General Biology, Higher Education Press, Beijing, 3rd edn, 2003, pp. 516–519 Search PubMed.
- Q. L. Dong, Y. Yao, Y. Zhao and H. Chen, Trans. Chin. Soc. Agric. Mach., 2014, 45(1), 197–202 CAS.
- R. Mukhopadhyay, J. Joaquin, R. Hogue, A. Kilaru, G. Jospin and K. Mars, Genome Announc., 2017, 5(17), 00252-17 Search PubMed.
- J. Park, M. K. Kim, B. R. Yun, J. H. Han and S. B. Kim, Int. J. Syst. Evol. Microbiol., 2017, 68(1), 165–169 CrossRef PubMed.
| This journal is © The Royal Society of Chemistry 2019 |