DOI:
10.1039/C9RA00490D
(Paper)
RSC Adv., 2019,
9, 9053-9066
Influence of low temperature conditions on lithium-ion batteries and the application of an insulation material
Received
20th January 2019
, Accepted 5th March 2019
First published on 19th March 2019
Abstract
In the current work, a series of experiments were carried out under low and normal temperature conditions (0 and 20 °C) to research the influence of low temperature on the performance of lithium-ion batteries (LIBs). Besides this, a commercial insulation material (IM) was employed to research its effect on preventing damage in a battery exposed to low temperature. Based on the experimental results, it was found that the battery exhibited a higher temperature increase at low ambient temperature due to the larger internal resistance of the battery at low temperature, which resulted in greater heat generation. It was also observed that the low temperature caused the uniformity of the battery to deteriorate as a result of temperature and voltage differences, and the uniformity became poorer with increasing cycle rate. Moreover, the capacity decay rate of the battery was demonstrated to be greatly accelerated by the low temperature. According to the morphological changes of the battery components, the structure of the electrode materials and separator was damaged under low temperature conditions. Finally, the results show that the IM had a significant effect on warming the battery up; therefore, a much better discharge performance and slower decay rate of the battery were achieved. Furthermore, the performance of the IM was found to be related to its thickness.
1. Introduction
Although advantages such as high energy density, less pollution, stable performance and long cycling life 1,2 have made lithium-ion batteries (LIBs) the dominant power source for applications ranging from portable electronics to electric vehicles (EVs), challenges also remain. Generally, the working environments of LIBs are complex, where extreme conditions, such as external forces, high temperature, low temperature, overcharge and over-discharge, etc., are usually involved.3–5 Amongst these, low temperature conditions cause significant loss of battery power and accelerate the decay rate, which dramatically limits the driving range and hinders the expansion of EVs. Therefore, it is crucial to gain more insight into the performance of LIBs under low temperature conditions.
Until now, much work has been done to probe the influence of low temperature on LIBs.6–12 Ling et al.6 cycled batteries under ambient temperatures of −10 and 5 °C, respectively; their results showed that the low temperature environment harmed the battery performance, reducing the discharging voltage and accelerating the capacity decay. Waldmann et al.7 evaluated the capacity fade of commercial 18![[thin space (1/6-em)]](https://www.rsc.org/images/entities/char_2009.gif) 650 batteries under a series of ambient temperatures. They revealed that the capacity fading rate increased with decreasing temperature in the range of 0–25 °C. In order to explore how low temperature induced serious fading of a battery, Petzl et al.8 focused on the nondestructive characterization of the fading behavior of the battery during long-term cycling. They elucidated the degradation effects of lithium plating on the graphite anode as the most severe fading process in the LIB at low temperature. The loss of cyclable lithium and active materials led to the final capacity decay.
650 batteries under a series of ambient temperatures. They revealed that the capacity fading rate increased with decreasing temperature in the range of 0–25 °C. In order to explore how low temperature induced serious fading of a battery, Petzl et al.8 focused on the nondestructive characterization of the fading behavior of the battery during long-term cycling. They elucidated the degradation effects of lithium plating on the graphite anode as the most severe fading process in the LIB at low temperature. The loss of cyclable lithium and active materials led to the final capacity decay.
In view of this, researchers have attempted to overcome the challenges of using LIBs at low temperature, which can be summarized as active and positive approaches. For the former, reformulating the electrolyte for low-temperature application is a common approach.13–16 Zhang et al.13 reported a new approach to improve the low-temperature performance of LIBs by replacing LiPF6 with LiBF4. They found that at −30 °C, a battery with 1 m (mol kg−1 solvent) LiBF4 dissolved in 1![[thin space (1/6-em)]](https://www.rsc.org/images/entities/char_2009.gif) :
:![[thin space (1/6-em)]](https://www.rsc.org/images/entities/char_2009.gif) 1
1![[thin space (1/6-em)]](https://www.rsc.org/images/entities/char_2009.gif) :
:![[thin space (1/6-em)]](https://www.rsc.org/images/entities/char_2009.gif) 3 (wt) propylene carbonate (PC)/ethylene carbonate (EC)/ethylmethyl carbonate (EMC) mixed solvent delivered as high as 86% capacity compared to LiPF6, which delivered 72% (in comparison to that obtained at 20 °C). Furthermore, the battery with LiBF4-based electrolyte showed lower polarization. On the other hand, preheating the battery is another feasible approach to improve the low-temperature performance of LIBs; this includes internal core heating, internal resistive heating, convective heating, mutual pulse heating, as well as external heating strategies such as those using air, liquid or phase change materials.17–22 Zhang et al.17 developed a method to internally preheat LIBs at low temperature using a sinusoidal alternating current. They found that the battery subjected to an alternating current with an amplitude of 7 A and a frequency of 1 Hz could be heated from −20 °C to 5 °C within 15 min, and the temperature distribution remained essentially uniform. Song et al.18 investigated an air-heating strategy for cold start-up applications using a simulation system, and their experimental results showed that in a low-temperature environment, a battery retained greater capacity if the air around it was heated to room temperature before use.
3 (wt) propylene carbonate (PC)/ethylene carbonate (EC)/ethylmethyl carbonate (EMC) mixed solvent delivered as high as 86% capacity compared to LiPF6, which delivered 72% (in comparison to that obtained at 20 °C). Furthermore, the battery with LiBF4-based electrolyte showed lower polarization. On the other hand, preheating the battery is another feasible approach to improve the low-temperature performance of LIBs; this includes internal core heating, internal resistive heating, convective heating, mutual pulse heating, as well as external heating strategies such as those using air, liquid or phase change materials.17–22 Zhang et al.17 developed a method to internally preheat LIBs at low temperature using a sinusoidal alternating current. They found that the battery subjected to an alternating current with an amplitude of 7 A and a frequency of 1 Hz could be heated from −20 °C to 5 °C within 15 min, and the temperature distribution remained essentially uniform. Song et al.18 investigated an air-heating strategy for cold start-up applications using a simulation system, and their experimental results showed that in a low-temperature environment, a battery retained greater capacity if the air around it was heated to room temperature before use.
In summary, there has been a lot of research regarding the effect of low temperature on LIBs. Nevertheless, the battery's uniformity, as one of the key parameters of LIBs, is significant during thermal management—not only from the perspective of battery performance, but also its safety.23–25 To maintain battery performance at a high level and decrease thermal hazards, good uniformity is necessary for both the single battery and the battery pack. However, few studies have been done to investigate the uniformity of LIBs under low temperature conditions. Moreover, it is common to see insulation materials (IMs) being used around us to preserve heat, but their application to protect LIBs from low temperature is scarcely seen.
This paper focuses on an experimental study under low temperature conditions to explore its influence on a LIB in combination with different cycle rates. Besides this, a commercial IM was used in the current work to research its effect on preventing low-temperature damage. Specific parameters, such as voltage, capacity and battery surface temperature were measured; the uniformity of the battery, including temperature and voltage, was discussed; and micro-characterization of the anode materials and separators stripped from both fresh batteries and spent batteries was also conducted, aiming to provide fundamental knowledge on this issue.
2. Experiment
2.1 Materials and sample preparation
The battery samples used in this work were cylindrical Samsung 18![[thin space (1/6-em)]](https://www.rsc.org/images/entities/char_2009.gif) 650 batteries with a capacity of 1300 mA h. The charge cut-off voltage was 4.2 V, and that for discharge was 2.75 V. The cathode and anode consisted of NMC532 and graphite, respectively. Before testing, the energy originally stored in the batteries was released by discharging with a constant current (CC) of 2600 mA until the capacity decreased to 0% state of charge (SOC). Subsequently, the batteries were stored for 24 hours to ensure they remained stable before the tests.
650 batteries with a capacity of 1300 mA h. The charge cut-off voltage was 4.2 V, and that for discharge was 2.75 V. The cathode and anode consisted of NMC532 and graphite, respectively. Before testing, the energy originally stored in the batteries was released by discharging with a constant current (CC) of 2600 mA until the capacity decreased to 0% state of charge (SOC). Subsequently, the batteries were stored for 24 hours to ensure they remained stable before the tests.
In addition, a commercial insulating material (IM) made of rubber, plastic, and cotton was applied in this paper (purchased from Jiaxing Collins Electrical Appliance Technology Co., Ltd.). Its thermophysical properties are shown in Table 1. Due to its low thermal conductivity, low thermal diffusivity, and porous/fibrous structure, the heat generated during the charging/discharging process of the battery would either be effectively retained or very slowly released to the surrounding environment, such that the battery would be kept at a relatively high temperature and its performance would be maintained at a relatively high level.
Table 1 Thermophysical properties of IM
| Constituent |
Thermal conductivity (W m−1 K−1) |
Thermal diffusivity (mm2 s−1) |
Specific heat (MJ m−3 K−1) |
| Rubber–plastic–cotton |
0.0313 |
0.5291 |
0.0592 |
2.2 Apparatus and experimental design
As shown in Fig. 1(a), experiments were carried out using an environment chamber with an internal dimension of 0.5 m × 0.5 m × 0.5 m. The controllable temperature range of the chamber is from 0 to 70 °C. Two groups of experiments were carried out to explore the influence of low temperature on the LIBs, including their voltage, capacity, surface temperature, etc. The experimental configurations are further listed in Table 2. For the first group, batteries were placed on a supporting mesh made of iron wire for the tests. Five K-type thermocouples with a diameter of 1 mm were attached to the surface of each battery to measure its surface temperatures, and the temperatures were recorded by the data acquisition equipment (NI cDAQ-9174) connected to a computer. The detailed arrangement and numbering of the thermocouples are presented in Fig. 1(b), and the temperatures of each thermocouple collected were marked T1, T2, T3, T4 and T5, respectively. Charging/discharging of the battery was achieved using a cycle tester (Neware CT-3008) with the parameters of 5 V and 6 A. Experiments were conducted at low temperature (0 °C) and normal temperature (20 °C), respectively. As for the second group, the batteries were wrapped with IM, as depicted in Fig. 1(c), with IM thicknesses of 5, 10, and 15 mm, respectively. Similarly, five K-type thermocouples were attached to each battery to measure the surface temperatures. The experiments were carried out at low temperature, i.e., 0 °C.
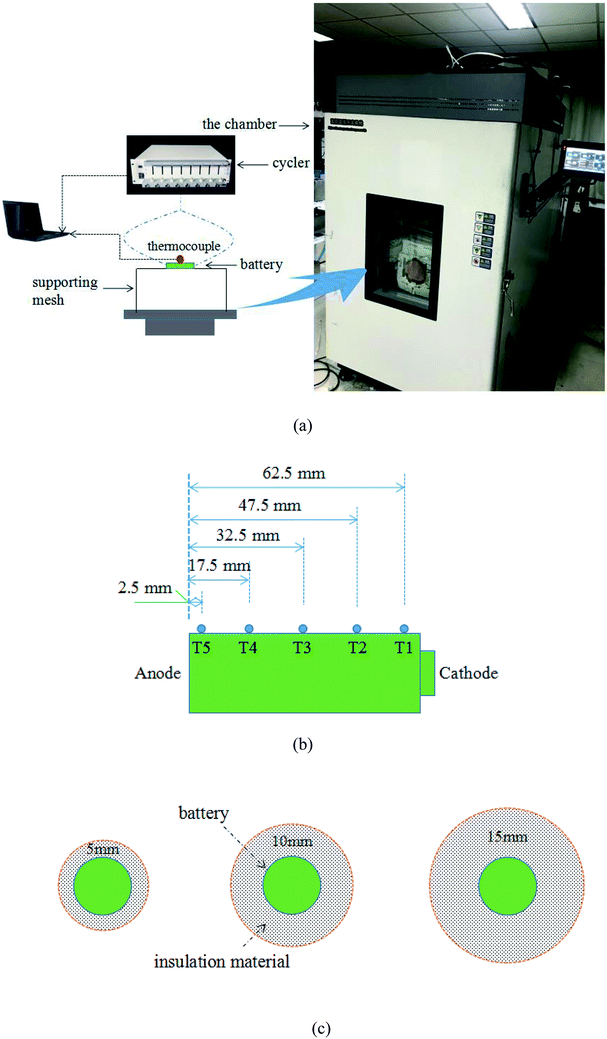 |
| | Fig. 1 Experimental schematics: (a) experiment setup; (b) thermocouple arrangements in a single battery; (c) the batteries wrapped with insulation material, top view. | |
Table 2 The experimental configurations
| Group no. |
Test no. |
Ambient temperature (°C) |
Thickness of IM (mm) |
Cycle rate (C) |
| 1 |
1 |
Room temperature |
n/a |
1, 2, 3 |
| 2 |
0 |
| 2 |
1 |
0 |
0 |
2 |
| 2 |
5 |
| 3 |
10 |
| 4 |
15 |
2.3 Thermal model
Heat generation within the battery is mainly composed of chemical reaction heat and Joule heat, expressed by eqn (1):26| |
 | (1) |
where ΔH is the reaction heat, M is the mass of reactants, n is the reaction order, A is the pre-exponential factor, Ea is the activation energy, R is the gas constant, Tb is the battery temperature, I is the current, UOC is the open circuit voltage and Ut is the terminal voltage.
Generally, heat release by the battery is via heat convection by air, which can be expressed as follows:
| |
 | (2) |
where
h is the convective heat transfer coefficient,
A is the battery surface area, and
Tair is the ambient temperature.
For a battery with IM, heat conduction between the battery surface and ambient air mainly follows the pattern of heat release, which can be expressed by:
| |
 | (3) |
where
K is the thermal conductivity of the IM.
Assuming the temperature distribution within the battery is uniform, then the temperature variation of the battery with/without IM can be written as eqn (4) and (5), respectively:
| |
 | (4) |
| |
 | (5) |
where
ρ is the density of the battery,
C is the specific heat, and
t is the time.
3. Results and discussion
3.1 Typical electrothermal behavior of the LIB at low temperature
Due to the similar electrothermal behavior of LIBs at different cycle rates, here, we took the 2C conditions as an example. The battery's surface temperature curve, measured from T3, and the voltage and current curves are depicted in Fig. 2, which shows a single cycle consisting of a CC–CV (constant current–constant voltage) charge process followed by a CC discharge process. Before the test, the battery was at 0% SOC and 0 °C (low temperature). As can be seen, the cycling process of the battery can be divided into four stages, namely, CC charge, CV charge, discharge I, and discharge II.
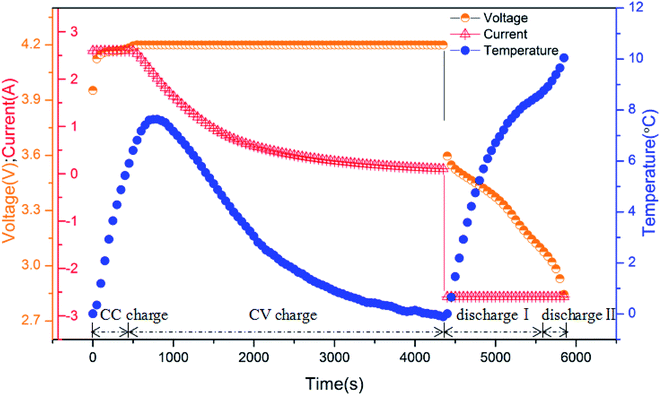 |
| | Fig. 2 The curves of surface temperature, voltage and current of the battery cycled at a rate of 2C. | |
At the CC charge stage, the battery heated up quickly until it reached the charge cut-off voltage. As the battery approached the cut-off voltage, it entered the CV charge stage, in which the charging current decreased gradually to retain voltage stability and reduce the polarization; meanwhile, the surface temperature kept increasing due to the inertia of heat generation, then reached the peak temperature, 7.64 °C. Hereafter, the surface temperature declined since the charge current was reduced, which led to decreased heat generation; the temperature difference between the battery and ambient air was large, bringing about obvious heat dissipation. When the charge current diminished to 100 mA, the CV charge stage ended; meanwhile, the surface temperature was approximately 0 °C. Similar to the charge process, the discharge process also comprises two stages. At discharge I, the surface temperature increased sharply, then the rate of temperature rise reduced gradually during the discharge process. This was the result of decreasing internal resistance.27 Once the battery entered discharge II, the temperature rise accelerated again and continued to increase until the end of discharge. Finally, the peak temperature during the whole process was obtained, i.e., 10.23 °C.
The curves of maximum/minimum temperature and temperature difference within the battery cycled at a rate of 2C are displayed in Fig. 3 for the analysis of the battery surface temperature uniformity at low temperature (0 °C). Tmax(t), Tmin(t) and ΔTmax(t) denote the maximum temperature, minimum temperature and temperature difference within the battery at time t, respectively, i.e.:
| | |
ΔTmax(t) = Tmax(t) − Tmin(t)
| (8) |
where
i (=1, 2, 3, 4 and 5) is the numbering of the thermocouple as shown in
Fig. 1(b).
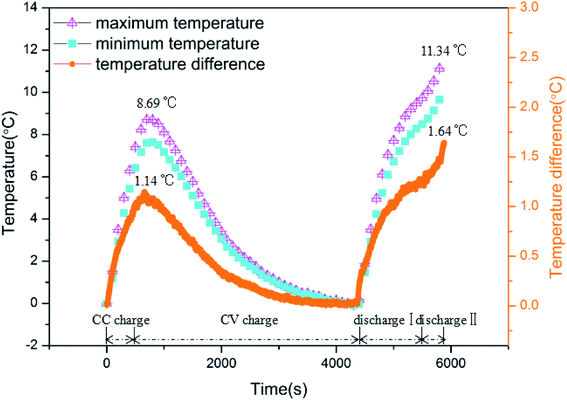 |
| | Fig. 3 The curves of maximum/minimum temperature and temperature difference within a battery cycled at a rate of 2C. | |
Consistent with the variation in the battery surface temperature, the curves of the maximum and minimum temperatures comprise four stages. They increased during the CC charge stage and reached the peak values at the CV charge stage. Hereafter, they decreased as the CV charge progressed. For the discharge process, both curves rose stably, including a rapid rise at discharge I and another rapid rise at discharge II.
The temperature difference within the battery increased sharply once the charge treatment began. It climbed to a peak value of 1.14 °C, and subsequently, the temperature difference reduced during the CV charge process. After the battery entered the discharge stage, the temperature difference increased once more, finally reaching a peak value of 1.64 °C. Obviously, the battery presented not only a larger surface temperature rise but also a larger temperature difference in the discharge stage. Namely, compared to the charge process, heat generation by the battery during discharge was greater, and the non-uniformity of the surface temperature was also more severe.
3.2 Influence of low temperature on the performance of LIBs
To further explore how low temperature influences the surface temperature of the batteries, the increases in the surface temperatures of the batteries were measured during cycling at cycle rates of 1C, 2C and 3C, respectively. Fig. 4 shows the results for a single cycle, with solid lines representing the low temperature conditions (0 °C) and dotted lines the normal conditions (20 °C). It can be found that the low temperature conditions evidently influenced the cycle time of the LIBs. Compared to the normal conditions, the cycling processes of the LIBs were much slower under low temperature conditions. This can be explained by the fact that the electrochemical reactions inside the batteries were restrained by the low temperature, and meanwhile, the internal resistance increased. Furthermore, for a fixed cycle rate, a higher temperature rise was observed at low temperature. This might be attributed to the differences in battery resistance at different ambient temperatures, so that the internal resistance of the battery is larger at low temperature.28 Detailed information on the temperature rise is further displayed in Table 3. Meanwhile, it is noted that the slopes of the temperature-rise curves are significantly different from each other at different cycle rates. With increased cycle rate, the temperature rise was more severe, leading to higher peak values, which were reached sooner. Similarly, this trend is the result of greater heat generation by the batteries at higher cycle rates.
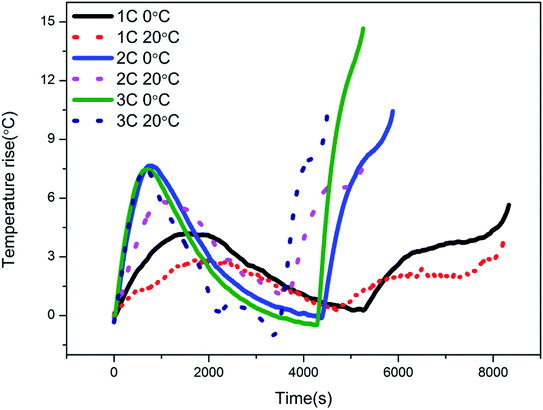 |
| | Fig. 4 Temperature rise curves of the batteries at low and normal temperature and at different cycle rates. | |
Table 3 Detailed information on the temperature rise of batteries
| Ambient temperature (°C) |
Cycle rate (C) |
Peak of temperature difference during charge (°C) |
Peak of temperature difference during discharge (°C) |
| 0 |
1 |
4.20 |
5.66 |
| 2 |
7.64 |
10.44 |
| 3 |
7.61 |
14.66 |
| 20 |
1 |
2.81 |
3.72 |
| 2 |
5.70 |
7.57 |
| 3 |
7.29 |
10.25 |
Meanwhile, the influence of low temperature on the temperature uniformity within a single battery was also investigated. Fig. 5 depicts the surface temperature differences of batteries during cycling at cycle rates of 1C, 2C, and 3C, and ambient temperatures of 0 °C and 20 °C, respectively. For a fixed cycle rate, the temperature difference within a single battery was exacerbated at low temperature, as shown by the peak values of 1.01, 2.14 and 3.16 °C, corresponding to 1C, 2C and 3C at 0 °C, respectively, compared to those at 20 °C of 0.86, 1.60 and 2.35 °C, respectively. The results indicate that the uniformity of battery surface temperature is deteriorated by low temperature, which led to uneven temperature distribution within the battery. Moreover, the temperature difference within the battery increased with increasing cycle rate at both low and normal temperatures; that is, the temperature uniformity within the single battery also deteriorated at a high cycle rate. Table 4 displays further detailed information.
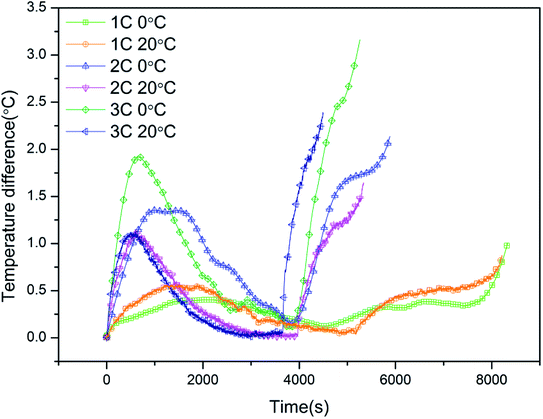 |
| | Fig. 5 The curves of the temperature differences within a single battery at low and normal temperature and at different cycle rates. | |
Table 4 Detailed information on temperature differences within a single battery
| Ambient temperature (°C) |
Cycle rate (C) |
Peak of temperature difference during charge (°C) |
Peak of temperature difference during discharge (°C) |
| 0 |
1 |
0.40 |
1.01 |
| 2 |
1.35 |
2.13 |
| 3 |
1.93 |
3.16 |
| 20 |
1 |
0.54 |
0.83 |
| 2 |
1.10 |
1.62 |
| 3 |
1.12 |
1.64 |
Generally, large numbers of LIBs are connected in series or parallel in electronics and EVs to supply power; hence, it is crucial to maintain good uniformity among the LIBs. However, some differences among batteries are inevitable due to deviations in manufacturing. In the current work, to explore the effect of low temperature on the uniformity among batteries, the temperature and voltage differences of batteries are discussed. On the basis of eqn (9)–(11), Fig. 6 demonstrates the curves of temperature difference among batteries at low and normal temperature and at different cycle rates, where four batteries were cycled at the same rate synchronously. Before the tests, each battery had 0% SOC. Batteries were firstly charged to 100% SOC, and then discharged to 0% SOC again. Tmax(t), Tmin(t) and ΔTmax(t) denote the maximum temperature, minimum temperature and temperature differences among the four batteries at time t, respectively, i.e.:
| | |
Tmin(t) = min{Ti(t)}
| (10) |
| | |
ΔTmax(t) = Tmax(t) − Tmin(t)
| (11) |
where
i (=1, 2, 3 and 4) is the numbering of the batteries.
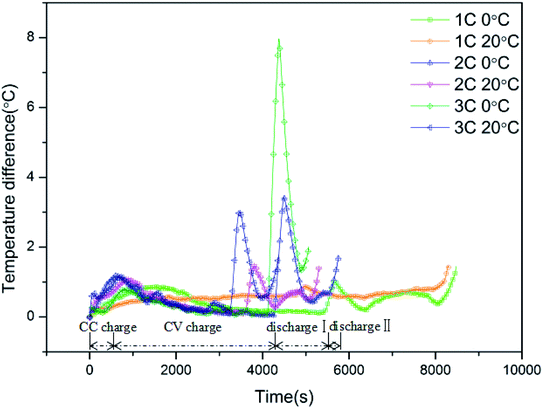 |
| | Fig. 6 The curves of temperature difference among batteries at low and normal temperature and at different cycle rates. | |
Taking the curve for 2C, 0 °C, as an example, the curve of the temperature difference among the batteries also comprises four stages: CC charge, CV charge, discharge I, and discharge II. Once charging began, the temperature difference among the batteries increased sharply and climbed to a peak value of 0.94 °C. Subsequently, the temperature difference reduced along with a decrease in the surface temperature during the charge stage. After the batteries entered the discharge stage, the temperature difference increased once more, and the rate of increase was even greater than that in the charge stage. Hereafter, it reached a peak value of 1.13 °C, which was the largest temperature difference during the whole process. As the discharge continued, the temperature difference reduced gradually. Once the battery approached discharge II, i.e., the deep discharge stage, the battery resistance increased, exacerbating the differences among the batteries, which was manifested in the form of a rebound in the temperature difference towards the end. Upon comparison, it is obvious that the curves of temperature difference for the low temperature conditions exhibited larger peak values and stronger fluctuations, which demonstrates that the non-uniformity among batteries is exacerbated by low temperature. In addition, the uniformity among the batteries was poorer with increasing cycle rate, which is consistent with the results above. The detailed results for the temperature difference among the batteries can be found in Table 5.
Table 5 Detailed information on the temperature difference among batteries
| Ambient temperature (°C) |
Cycle rate (C) |
Peak of temperature difference during charge (°C) |
Peak of temperature difference during discharge (°C) |
The final temperature difference (°C) |
| 0 |
1 |
0.85 |
0.99 |
1.45 |
| 2 |
1.18 |
3.42 |
1.72 |
| 3 |
0.81 |
7.97 |
2.00 |
| 20 |
1 |
1.60 |
0.88 |
1.44 |
| 2 |
1.06 |
1.45 |
1.38 |
| 3 |
1.14 |
3.01 |
1.84 |
On the other hand, the batteries' voltage difference during discharge is displayed in Fig. 7 and can be described with the following eqn (12)–(14), where Umax(t), Umin(t) and ΔUmax(t) denote the maximum voltage, minimum voltage and voltage difference among the four batteries at time t, respectively, i.e.:
| | |
Umax(t) = max{Ui(t)}
| (12) |
| | |
Umin(t) = min{Ui(t)}
| (13) |
| | |
ΔU(t) = Umax(t) − Umin(t)
| (14) |
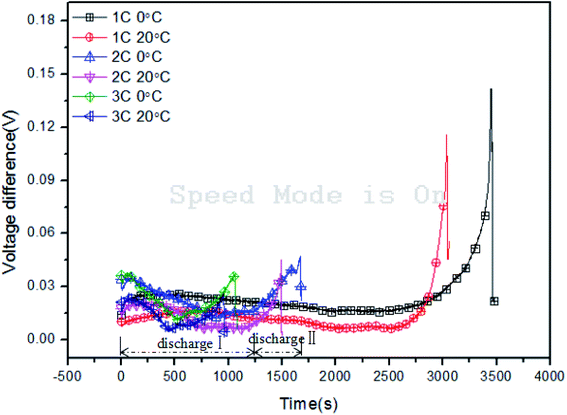 |
| | Fig. 7 The curves of the voltage differences among batteries at low and normal temperature and at different cycle rates. | |
Similarly, taking the curve of 2C, 0 °C, as an example, two evident stages can be observed: discharge I and discharge II. At the initial stage of discharge, the voltage difference exhibited an obvious rise under the effect of activation polarization, which is consistent with a sharp decline in the battery voltage. Hereafter, it decreased gradually with the discharge process. Once the battery achieved deep discharge (discharge II), the curve underwent another rapid increase, which was much more steep than that in discharge I. This was the result of concentration polarization as discharging approached the end. Then, the difference dropped upon completion of discharge. The results of voltage differences among the batteries can be seen in Table 6. At low temperature, the batteries exhibit obvious larger voltage differences, in both the real-time and peak values. Besides this, it is interesting to note that a decreased cycle rate resulted in a larger voltage difference peak value. This might be attributed to the fact that the deep discharge stage lasted longer under the low cycle rate, which aggravated the non-uniformity among the batteries, therefore causing a larger voltage difference peak.
Table 6 Detailed information on the voltage differences among batteries
| Ambient temperature (°C) |
Cycle rate (C) |
Peak of voltage difference during discharge I (°C) |
Peak of voltage difference during discharge II (°C) |
| 0 |
1 |
0.026 |
0.142 |
| 2 |
0.035 |
0.047 |
| 3 |
0.038 |
0.039 |
| 20 |
1 |
0.016 |
0.116 |
| 2 |
0.021 |
0.045 |
| 3 |
0.024 |
0.026 |
As calculated from the discharge results, the capacity decay curves of batteries at low and normal temperature and at different cycle rates are shown in Fig. 8. At normal temperature, it took several cycles to activate the battery, which is exhibited as the initial rise in capacity, which then fluctuated around a critical value. Typically, the lower the cycle rate, the greater the capacity. Namely, discharge is more exhaustive at a low cycle rate. Under the low temperature conditions, it can be observed that as the cycle number increased, the battery capacity decayed gradually at rates of 0.046, 0.053 and 0.074% per cycle, respectively. This reveals that low temperature aggravated the aging of the battery, the severity of which increased with increasing cycle rate. This result is related to the damage of the electrode and separator structure; further discussion on the morphological changes of the battery components follows.
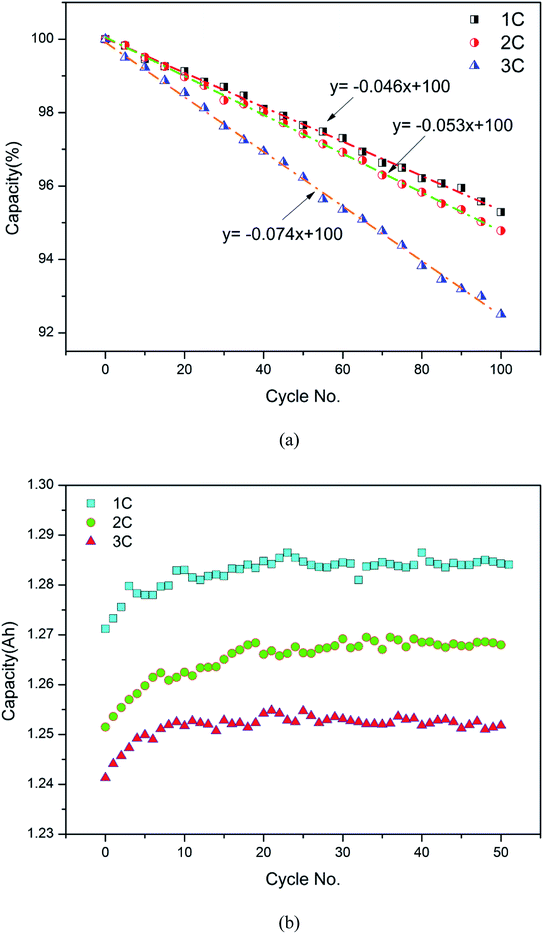 |
| | Fig. 8 The capacity decay curves of batteries as a function of cycle number: (a) low temperature, 0 °C; (b) normal temperature, 20 °C. | |
To investigate the morphological changes of battery components at low temperature, the anode materials and separators, stripped from both fresh and abused batteries, were examined using scanning electron microscopy (SEM). For the latter, as depicted in Fig. 8(a), the battery underwent 100 cycles at an ambient temperature of 0 °C and rate of 2C. Fig. 9 displays the SEM results of the anode materials and separators at 0.3k× and 5k× magnification, respectively. For the anode material of the battery cycled at low temperature, a layer of passive film with a detectable thickness could be observed at the surface, i.e., the solid electrolyte interphase (SEI), which would further lead to a rise in battery impedance and the loss of cyclable lithium ions and available contact area.29,30 Besides this, it can be observed that the separator surface of the fresh battery is smooth, with favorable permeability, whereas the permeability exhibited by the other battery is much poorer, with many holes covered. This is as a result of the overgrowth of the SEI, which is harmful to the transfer in active materials. The phenomenon of an overgrown SEI can be verified by the elemental distribution, the details of which are listed in Table 7, in which the anode and separator materials of the spent and fresh batteries were tested by X-ray photoelectron spectroscopy (XPS). As observed, compared to the fresh battery, the C content of both the anode and separator of the spent battery showed an obvious increase; in contrast, the Li content decreased. The results indicate the overgrowth of the SEI and the loss of cyclable lithium ions in the spent battery. Consequently, accelerated aging of the battery at low temperature was observed, with the structural destruction of battery components.
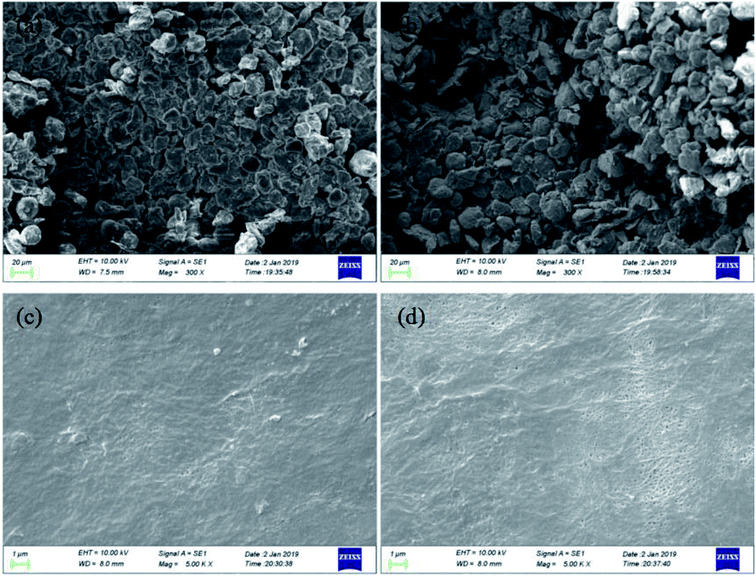 |
| | Fig. 9 The physical characterization of battery components: (a) spent anode materials; (b) fresh anode materials; (c) spent separator; (d) fresh separator. | |
Table 7 Element distribution in the anode and separator materials
| Battery |
Component |
C |
Li |
| Spent battery |
Anode |
86.94% |
13.06% |
| Separator |
92.91% |
7.09% |
| Fresh battery |
Anode |
81.03% |
18.97% |
| Separator |
74.86% |
25.14% |
3.3 Application of the IM under low temperature conditions
To explore the effect of the IM in protecting LIBs from low temperature conditions, Fig. 10 displays the typical temperature curves of batteries with/without IMs at an ambient temperature of 0 °C. As illustrated in Fig. 1(c), the thickness of the IM wrapped around the batteries was varied at 0, 5, 10 and 15 mm, respectively, and the cycle rate was 2C. It can be obviously seen that the IM had a significant effect on warming the batteries up. Under the effect of the IM, the rate of surface temperature increase of the battery was greater than that in the absence of the IM, and therefore, a higher surface temperature was observed. The peak values of temperature during charge were 7.64, 11.50, 12.18 and 13.95 °C, corresponding to the conditions of no IM, 5 mm, 10 mm and 15 mm IM, respectively. Correspondingly, the peak values for discharge were 10.44, 14.04, 17.26 and 18.46 °C. Besides this, it can also be found that the IM influenced the cycling times of the batteries, where the batteries wrapped with IM completed a single cycle sooner; that is, the IM enhanced the cycling efficiency of the batteries at low temperature. This was as a result of the batteries, affected by the IM, having higher temperatures, which accelerated the electrochemical reactions and reduced the internal resistance.
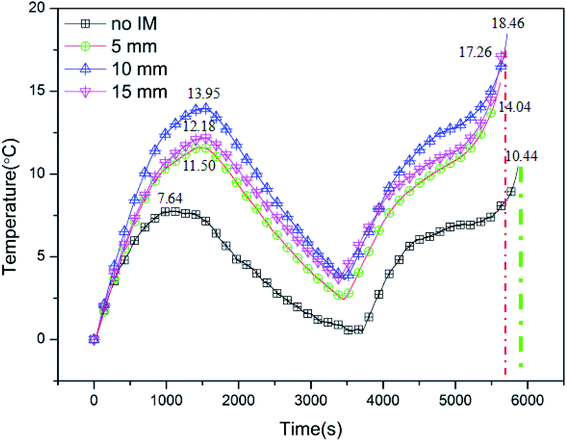 |
| | Fig. 10 The typical temperature curves of batteries with/without IM at an ambient temperature of 0 °C. | |
On the other hand, it can be found that the effect of the IM was related to its thickness. Among the tested thicknesses, 10 mm presented the best performance, followed by 15 mm and 5 mm, indicating that the excessive IM thickness might be not helpful in improving battery performance. The effect of IM first increased along with an increase in its thickness, then reached the best performance, and subsequently declined. This trend is attributed to the function of thermal resistance; an appropriate thickness brought about a large thermal resistance and, therefore, good insulation performance.31 Besides this, it was shown that the IM thickness also affected the cycling time, where the cycling time at 10 mm was the longest, followed by 15 and 5 mm. This can be explained by the fact that a higher temperature improves the charge/discharge performance of the batteries, therefore extending the cycling time. This can be confirmed by the discharge results, as displayed in Fig. 11. Compared to the battery without IM, the batteries wrapped with IM presented higher discharge capacities. The batteries with 5, 10 and 15 mm IM exhibited discharge capacities of 1162, 1179 and 1172 mA h, respectively, whereas that of the battery without IM was 1097 mA h.
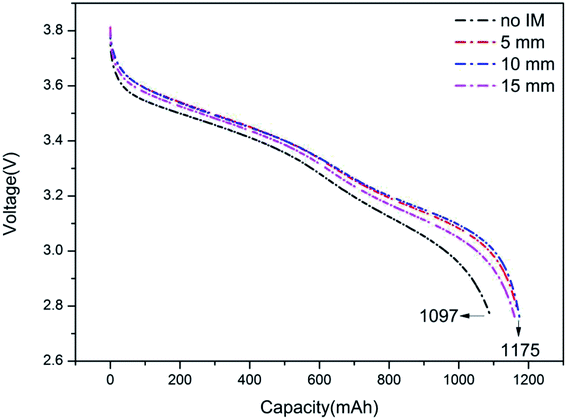 |
| | Fig. 11 The typical voltage curves of batteries with/without IM at an ambient temperature of 0 °C. | |
Besides this, to further research the effect of the IM on the cycling performance of the batteries at low temperature, the capacity decay curves of the batteries as a function of cycle number with different IM thicknesses are depicted in Fig. 12, at a cycling rate of 2C and ambient temperature of 0 °C. It is shown that for the batteries affected by the IM, the capacity decay rates were much slower, even at low temperature. In the presence of the IM, the battery temperature was much higher and its variation was also much more stable, which was beneficial to the working of the battery components, therefore preventing damage at low temperature. Moreover, the decay rate of the battery is also related to the IM thickness, with 10 mm having the slowest value, i.e., 0.006% per cycle. Based upon these results, the IM was helpful in protecting the batteries under low temperature conditions by warming them up, which further resulted in an improvement in the cycling efficiency, discharge performance and capacity decay. In winter or in high latitude/altitude areas, it may be an option to apply an IM onto LIBs to enhance battery performance under low temperature conditions.
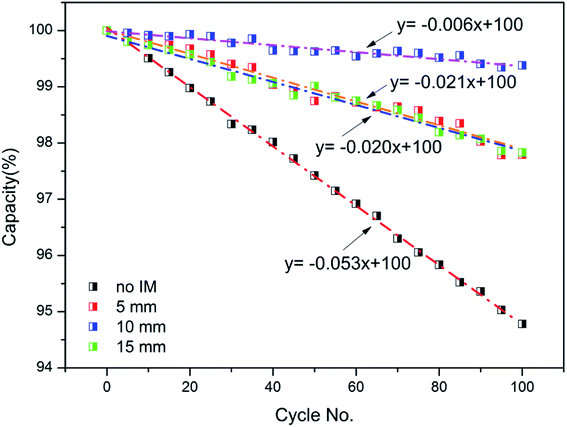 |
| | Fig. 12 The capacity decay curves of batteries as a function of cycle number with different thicknesses of IM. | |
4. Conclusions
In this work, an experimental study was conducted to investigate the influence of low temperature on LIBs; meanwhile, the application of a commercial IM under such conditions was also researched. According to the experimental results, some conclusions were drawn as follows.
Low temperature had a significant influence on the cycling time of LIBs, where the cycling process was much longer for the LIBs operated at low temperature. Besides this, a higher temperature rise was observed under low temperature conditions, which might be attributed to the fact that the internal resistance of the batteries was larger, resulting in greater heat generation. Meanwhile, the temperature difference within a single battery was also exacerbated by low temperature; namely, the uniformity of the battery surface temperature deteriorated under low temperature conditions. Moreover, the non-uniformity of temperature within a single battery was found to be aggravated by a high cycling rate. Similarly, low temperature also exacerbated the temperature and voltage uniformity among batteries, and the effects increased with increasing cycling rate. At low temperature, battery aging was accelerated, and the severity increased with an increase in the cycling rate, which was mainly caused by the damage of battery components.
After employing an IM under low temperature conditions, it was found that the IM had significant effects on warming up the battery, which therefore resulted in a much better discharge performance and slower battery decay rate. Besides this, the effect of the IM was related to its thickness, where a thickness of 10 mm presented the best performance.
Conflicts of interest
There are no conflicts to declare.
Acknowledgements
This work was supported by the National Key R&D Program of China (No. 2018YFC0809500 and No. 2018YFC0808600).
References
- Y. Azizi and S. M. Sadrameli, Thermal management of a LiFePO4 battery pack at high temperature environment using a composite of phase change materials and aluminum wire mesh plates, Energy Convers. Manage., 2016, 128, 294–302 CrossRef CAS.
- W. Wu, X. Yang and G. Zhang, et al., Experimental investigation on the thermal performance of heat pipe-assisted phase change material based battery thermal management system, Energy Convers. Manage., 2017, 138, 486–492 CrossRef.
- H. Maleki and J. N. Howard, Effects of overdischarge on performance and thermal stability of a Li-ion cell, J. Power Sources, 2006, 160(2), 1395–1402 CrossRef CAS.
- D. H. Doughty and E. P. Roth, A general discussion of Li ion battery safety, Electrochem. Soc. Interface, 2012, 21(2), 37–44 CrossRef CAS.
- D. Belov and M. H. Yang, Failure mechanism of Li-ion battery at overcharge conditions, J. Solid State Electrochem., 2008, 12(7–8), 885–894 CrossRef CAS.
- Z. Ling, X. Wen and Z. Zhang, et al., Warming-Up Effects of Phase Change Materials on Lithium-Ion Batteries Operated at Low Temperatures, Energy Technology, 2016, 4(9), 1071–1076 CrossRef CAS.
- T. Waldmann, M. Kasper and M. Wohlfahrt-Mehrens, Optimization of charging strategy by prevention of lithium deposition on anodes in high-energy lithium-ion batteries–electrochemical experiments, Electrochim. Acta, 2015, 178, 525–532 CrossRef CAS.
- M. Petzl, M. Kasper and M. A. Danzer, Lithium plating in a commercial lithium-ion battery–A low-temperature aging study, J. Power Sources, 2015, 275, 799–807 CrossRef CAS.
- A. Friesen, X. Mönnighoff and M. Börner, et al., Influence of temperature on the aging behavior of 18650-type lithium ion cells: a comprehensive approach combining electrochemical characterization and post-mortem analysis, J. Power Sources, 2017, 342, 88–97 CrossRef CAS.
- Z. Ling, X. Wen and Z. Zhang, et al., Thermal management performance of phase change materials with different thermal conductivities for Li-ion battery packs operated at low temperatures, Energy, 2018, 144, 977–983 CrossRef CAS.
- M. Fleischhammer, T. Waldmann and G. Bisle, et al., Interaction of cyclic ageing at high-rate and low temperatures and safety in lithium-ion batteries, J. Power Sources, 2015, 274, 432–439 CrossRef CAS.
- L. Ghadbeigi, B. Day and K. Lundgren, et al., Cold temperature performance of phase change material based battery thermal management systems, Energy Reports, 2018, 4, 303–307 CrossRef.
- S. Zhang, K. Xu and T. R. Jow, A new approach toward improved low temperature performance of Li-ion battery, Electrochem. Commun., 2002, 4(11), 928–932 CrossRef CAS.
- J. H. Won, H. S. Lee and L. Hamenu, et al., Improvement of low-temperature performance by adopting polydimethylsiloxane-g-polyacrylate and lithium-modified silica nanosalt as electrolyte additives in lithium-ion batteries, J. Ind. Eng. Chem., 2016, 37, 325–329 CrossRef CAS.
- Y. Lai, B. Peng and Z. Zhang, et al., A Wide Operating Temperature Range Electrolyte Containing Lithium Salts Mixture and a Co-Solvent for the LiFePO4 Cathode, J. Electrochem. Soc., 2014, 161(6), A875–A879 CrossRef CAS.
- Q. Li, S. Jiao and L. Luo, et al., Wide-Temperature Electrolytes for Lithium-Ion Batteries, ACS Appl. Mater. Interfaces, 2017, 9(22), 18826–18835 CrossRef CAS PubMed.
- J. Zhang, H. Ge and Z. Li, et al., Internal heating of lithium-ion batteries using alternating current based on the heat generation model in frequency domain, J. Power Sources, 2015, 273, 1030–1037 CrossRef CAS.
- H. S. Song, J. B. Jeong, B. H. Lee, et al., Experimental study on the effects of pre-heating a battery in a low-temperature environment, 2012 IEEE Vehicle Power and Propulsion Conference (VPPC), IEEE, 2012, pp. 1198–1201 Search PubMed.
- J. Jaguemont, L. Boulon and Y. Dubé, A comprehensive review of lithium-ion batteries used in hybrid and electric vehicles at cold temperatures, Appl. Energy, 2016, 164, 99–114 CrossRef CAS.
- Y. Ji and C. Y. Wang, Heating strategies for Li-ion batteries operated from subzero temperatures, Electrochim. Acta, 2013, 107, 664–674 CrossRef CAS.
- C. Y. Wang, G. Zhang and S. Ge, et al., Lithium-ion battery structure that self-heats at low temperatures, Nature, 2016, 529(7587), 515 CrossRef CAS PubMed.
- H. Ruan, J. Jiang and B. Sun, et al., A rapid low-temperature internal heating strategy with optimal frequency based on constant polarization voltage for lithium-ion batteries, Applied Energy, 2016, 177, 771–782 CrossRef.
- N. Damay, C. Forgez and G. Friedrich, et al., Heterogeneous behavior modeling of a LiFePO4-graphite cell using an equivalent electrical circuit, Journal of Energy Storage, 2017, 12, 167–177 CrossRef.
- Z. Lei, Y. Zhang and X. Lei, Temperature uniformity of a heated lithium-ion battery cell in cold climate, Appl. Therm. Eng., 2018, 129, 148–154 CrossRef.
- Z. Lei, Y. Zhang and X. Lei, Improving temperature uniformity of a lithium-ion battery by intermittent heating method in cold climate, Int. J. Heat Mass Transfer, 2018, 121, 275–281 CrossRef CAS.
- J. Liu, Z. Wang and J. Gong, et al., Experimental study of thermal runaway process of 18650 lithium-ion battery, Materials, 2017, 10(3), 230 CrossRef PubMed.
- L. Lu, X. Han and J. Li, et al., A review on the key issues for lithium-ion battery management in electric vehicles, J. Power Sources, 2013, 226, 272–288 CrossRef CAS.
- Y. Xie, S. Shi and J. Tang, et al., Experimental and analytical study on heat generation characteristics of a lithium-ion power battery, Int. J. Heat Mass Transfer, 2018, 122, 884–894 CrossRef.
- G. Zhang, S. Ge and T. Xu, et al., Rapid self-heating and internal temperature sensing of lithium-ion batteries at low temperatures, Electrochim. Acta, 2016, 218, 149–155 CrossRef CAS.
- J. Li, E. Murphy and J. Winnick, et al., Studies on the cycle life of commercial lithium ion batteries during rapid charge–discharge cycling, J. Power Sources, 2001, 102(1–2), 294–301 CrossRef CAS.
- T. M. I. Mahlia, B. N. Taufiq and H. Masjuki, Correlation between thermal conductivity and the thickness of selected insulation materials for building wall, Energy and Buildings, 2007, 39(2), 182–187 CrossRef.
|
| This journal is © The Royal Society of Chemistry 2019 |
Click here to see how this site uses Cookies. View our privacy policy here.  Open Access Article
 d and
Jian Wang
 *a
*a
![[thin space (1/6-em)]](https://www.rsc.org/images/entities/char_2009.gif) 650 batteries under a series of ambient temperatures. They revealed that the capacity fading rate increased with decreasing temperature in the range of 0–25 °C. In order to explore how low temperature induced serious fading of a battery, Petzl et al.8 focused on the nondestructive characterization of the fading behavior of the battery during long-term cycling. They elucidated the degradation effects of lithium plating on the graphite anode as the most severe fading process in the LIB at low temperature. The loss of cyclable lithium and active materials led to the final capacity decay.
650 batteries under a series of ambient temperatures. They revealed that the capacity fading rate increased with decreasing temperature in the range of 0–25 °C. In order to explore how low temperature induced serious fading of a battery, Petzl et al.8 focused on the nondestructive characterization of the fading behavior of the battery during long-term cycling. They elucidated the degradation effects of lithium plating on the graphite anode as the most severe fading process in the LIB at low temperature. The loss of cyclable lithium and active materials led to the final capacity decay.![[thin space (1/6-em)]](https://www.rsc.org/images/entities/char_2009.gif) :
:![[thin space (1/6-em)]](https://www.rsc.org/images/entities/char_2009.gif) 1
1![[thin space (1/6-em)]](https://www.rsc.org/images/entities/char_2009.gif) :
:![[thin space (1/6-em)]](https://www.rsc.org/images/entities/char_2009.gif) 3 (wt) propylene carbonate (PC)/ethylene carbonate (EC)/ethylmethyl carbonate (EMC) mixed solvent delivered as high as 86% capacity compared to LiPF6, which delivered 72% (in comparison to that obtained at 20 °C). Furthermore, the battery with LiBF4-based electrolyte showed lower polarization. On the other hand, preheating the battery is another feasible approach to improve the low-temperature performance of LIBs; this includes internal core heating, internal resistive heating, convective heating, mutual pulse heating, as well as external heating strategies such as those using air, liquid or phase change materials.17–22 Zhang et al.17 developed a method to internally preheat LIBs at low temperature using a sinusoidal alternating current. They found that the battery subjected to an alternating current with an amplitude of 7 A and a frequency of 1 Hz could be heated from −20 °C to 5 °C within 15 min, and the temperature distribution remained essentially uniform. Song et al.18 investigated an air-heating strategy for cold start-up applications using a simulation system, and their experimental results showed that in a low-temperature environment, a battery retained greater capacity if the air around it was heated to room temperature before use.
3 (wt) propylene carbonate (PC)/ethylene carbonate (EC)/ethylmethyl carbonate (EMC) mixed solvent delivered as high as 86% capacity compared to LiPF6, which delivered 72% (in comparison to that obtained at 20 °C). Furthermore, the battery with LiBF4-based electrolyte showed lower polarization. On the other hand, preheating the battery is another feasible approach to improve the low-temperature performance of LIBs; this includes internal core heating, internal resistive heating, convective heating, mutual pulse heating, as well as external heating strategies such as those using air, liquid or phase change materials.17–22 Zhang et al.17 developed a method to internally preheat LIBs at low temperature using a sinusoidal alternating current. They found that the battery subjected to an alternating current with an amplitude of 7 A and a frequency of 1 Hz could be heated from −20 °C to 5 °C within 15 min, and the temperature distribution remained essentially uniform. Song et al.18 investigated an air-heating strategy for cold start-up applications using a simulation system, and their experimental results showed that in a low-temperature environment, a battery retained greater capacity if the air around it was heated to room temperature before use.![[thin space (1/6-em)]](https://www.rsc.org/images/entities/char_2009.gif) 650 batteries with a capacity of 1300 mA h. The charge cut-off voltage was 4.2 V, and that for discharge was 2.75 V. The cathode and anode consisted of NMC532 and graphite, respectively. Before testing, the energy originally stored in the batteries was released by discharging with a constant current (CC) of 2600 mA until the capacity decreased to 0% state of charge (SOC). Subsequently, the batteries were stored for 24 hours to ensure they remained stable before the tests.
650 batteries with a capacity of 1300 mA h. The charge cut-off voltage was 4.2 V, and that for discharge was 2.75 V. The cathode and anode consisted of NMC532 and graphite, respectively. Before testing, the energy originally stored in the batteries was released by discharging with a constant current (CC) of 2600 mA until the capacity decreased to 0% state of charge (SOC). Subsequently, the batteries were stored for 24 hours to ensure they remained stable before the tests.


