 Open Access Article
NiO decorated CeO2 nanostructures as room temperature isopropanol gas sensors†
Nagabandi Jayababu *a,
Madhukar Poloju
 ab,
Julakanti Shruthi
 a and
M. V. Ramana Reddya
aThin Films and Nano Materials Research Laboratory, Department of Physics, Osmania University, Hyderabad-500007, Telangana State, India. E-mail: nagabandi.jay@gmail.com; jaynagabandi@osmania.ac.in; Tel: +91-8978405154
bDepartment of Physics, SVS Groups of Institutions, Warangal-506015, TS, India
First published on 3rd May 2019
Abstract
Heterostructures developed using CeO2 show promising peculiarities in the field of metal oxide gas sensors due to the great variations in the resistance during the adsorption and desorption processes. NiO decorated CeO2 nanostructures (NiO/CeO2) were synthesized via a facile two-step process. High resolution transmission electron microscopy (HRTEM) results revealed the perfect decoration of NiO on the CeO2 surface. The porous nature of the NiO/CeO2 sensor surface was confirmed from scanning electron microscopy (SEM) analysis. Gas sensing studies of pristine CeO2 and NiO/CeO2 sensors were performed under room conditions and enhanced gas sensing properties for the NiO/CeO2 sensor towards isopropanol were observed. Decoration of NiO on the CeO2 surface develops a built-in potential at the interface of NiO and CeO2 which played a vital role in the superior sensing performance of the NiO/CeO2 sensor. Sharp response and recovery times (15 s/19 s) were observed for the NiO/CeO2 sensor towards 100 ppm isopropanol at room temperature. Long-term stability of the NiO/CeO2 sensor was also studied and discussed. From all the results it is concluded that the decoration of NiO on the CeO2 surface could significantly enhance the sensing performance and it has great advantages in designing best performing isopropanol gas sensors.
Introduction
Cerium oxide (CeO2) is a most abundant rare earth metal oxide in the earth's crust (about 0.0046 wt%) which usually presents in a cubic fluorite structure.1 The unique properties of CeO2 like high oxygen storage capacity, existing in two oxidation states (Ce4+ and Ce3+), large number of oxygen vacancies, and redox chemistry between Ce4+ and Ce3+ make it a ubiquitous constituent in various applications.2,3 The important applications of CeO2 include solid oxide fuel cells, solar cells, gas sensors, polishing agents, solid electrolytes, catalysts, electrochromic thin films, and energy storage.4–6 During the past decade, CeO2 has gradually become a promising metal oxide for gas sensing applications and has gained an upsurge in interest in the field of gas sensors owing to its properties like large number of oxygen vacancies and high oxygen storage capacity.7 CeO2 has already proved its ability in detecting various toxic gases like acetone, formaldehyde, ethanol, carbon monoxide, and ammonia.8–10Isopropanol (or isopropyl alcohol) is a colorless and flammable compound with strong odor from the family of volatile organic compounds (VOCs).11 Isopropanol is being widely used in various applications such as lubricants, solvents, cosmetics, electronic industries for cleaning of printed circuit boards, pharmaceutical industries, household chemicals, and also in automotive field as a petroleum additive.12–14 However, exposure to isopropanol is very harmful to human health. Dizziness, severe vomiting, irritation of eyes, nose, throat, and mouth are the common symptoms that are being observed while exposing to low concentrated isopropanol (below 400 ppm).15 Further, exposure to higher concentrations of isopropanol leads to internal bleeding, swelling, excessive sweating, hypertension, breakdown of central nerves system, depression, and coma.15,16 Therefore, the need of the device which can effectively monitor isopropanol is increasing for environmental control. Some recent studies were succeeded in developing gas sensors using different structured metal oxides to monitor isopropanol efficiently. Xiaoyan cai et al. were obtained coral like ZnO–CdO composite with 3D hierarchical porous structure via facile self-sustained decomposition of metal–organic compound and tested it for isopropanol sensing performance. The study revealed that the ZnO–CdO composite sensor has shown the highest response and selectivity towards isopropanol at the operating temperature of 248 °C.17 Bowen Jhang et al. developed a sensor using CuO decorated SnO2 nanorods and showed its best response towards 100 ppm isopropanol at an operating temperature of 280 °C.18 A recent study of our research group also focused on developing the isopropanol sensor using SnO2/ZnO core–shell nanostructures and achieved good response at 300 °C operating temperature.19 Some other researchers also tried to fabricate isopropanol sensor and achieved good response at high operating temperatures.20–22 High operating temperature is the most undesirable quality of any gas sensor which leads to high power consumption, low life time and chance of ignition while dealing with combustible gases.23
To get better sensing response at lower operating temperatures, many efforts have been adopted such as, elemental doping, surface modifications, heterostructures, and adding noble metals on the sensor surfaces.24–28 From past decade heterostructure based hybrid materials are gaining tremendous interest in various fields due to the fact that they can deliver impeccable properties compared to single materials.29–36 One of the effective methods for the development of sensor which shows high response even at low operating temperature is the formation of heterojunction between CeO2 and other semiconductor metal oxide. Jie Hu et al. synthesized CeO2 loaded In2O3 hollow spheres and obtained enhanced sensing performance towards hydrogen at 160 °C working temperature.37 Meishan Li et al. fabricated a sensor using CeO2/CdS composites, which shown a significant improvement in the sensing performance towards ethanol at an operating temperature of 161 °C.38 In particular, the heterostructure formed between CeO2 and p-type metal oxides is expected to show better sensing performances owing to their great variation at built-in potential near the p–n interfaces. A few recent studies have proved that the coupling of p-NiO with n-type metal oxides could possibly enhances the heterojunction related properties and results in the improved sensing performance.39,40 However, to the best of our knowledge there are no or less gas sensors which detect isopropanol gas at room temperature.
In this study, NiO decorated CeO2 nanostructures were prepared and used for gas sensor fabrication. Fabricated NiO/CeO2 nanocomposite (NC) sensor was investigated for its gas sensing properties towards various toxic gases by measuring the response. The NiO/CeO2 sensor exhibited better response, sharp response and recovery times, good reproducibility, and long-term stability towards isopropanol at room temperature.
Experimental
Materials
All the chemicals used in this experiment are analytical grade and used as received without further purification. Ammonium ceric nitrate ((NH4)2Ce(NO3)6) with purity of 99% was procured from Himedia and nickel(II) acetate tetrahydrate (Ni(CH3CO2)2·4H2O) with a purity of 99.9% was obtained from Sigma-Aldrich. 99.9% pure ethanol (C2H5OH) was purchased from Himedia to use as solvent. Hydrochloric acid (HCl) with a purity of 35% and monoethanolamine with 99.9% purity were used as stabilizers during the experiment.Preparation of CeO2 nanoparticles and NiO decorated CeO2 nanostructures
Fabrication of gas sensors and their gas sensing measurements
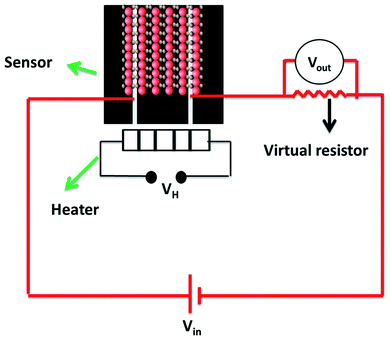
The detailed procedure to fabricate the gas sensors and their gas sensing tests are described elsewhere.19 In brief, thick slurries of both pure CeO2 NP and NiO/CeO2 NC powders were prepared separately and coated on alumina plates which are having pre-coated silver electrodes. These coated thick films were dried at a temperature of 80 °C for 3 h on hot plate (Fig. S1†). Custom made gas sensing unit consisting an air sealed glass chamber equipped with a heater, probes, and a thermocouple was utilized to investigate the gas sensing response of the prepared gas sensors (Fig. S2†). Required concentration of the test gas was measured from static liquid distribution method, which was calculated by following equation.
 | (1) |
| S = Ra/Rg | (2) |
Characterization of materials
The phase and crystallinity of the pure CeO2 NPs and NiO/CeO2 NCs were examined by powder X-ray diffraction (XRD) patterns recorded on Philips diffractometer (40 kV, 30 mA, Cu Kα radiation with λ = 1.54178 Å) at room temperature over a 2θ range between 20° to 80°. The surface morphological and chemical compositional studies of the pure CeO2 NPs and NiO/CeO2 NCs were carried out by using field emission scanning electron microscopy (FESEM, Zeiss/Ultra 55) equipped with energy dispersive X-ray spectroscope (EDS). After fabricating the gas sensors, the morphology and composition characteristics were analyzed using scanning electron microscope (SEM, Zeiss Evo18) equipped with EDS. X-ray photo electron spectra (XPS) on a PHI5000VersaProbeII system using Al Kα (1486.6 eV) radiation operating at an accelerating power of 15 kW were used to investigate the surface chemical states of the elements in NiO/CeO2 NCs. The shape, size, and structure related information of NiO/CeO2 NCs was obtained from high resolution transmission electron microscopy (HRTEM) imaging via a JEOL-JEM 2100 system operating at 200 kV.Results and discussion
Structure and morphology analysis
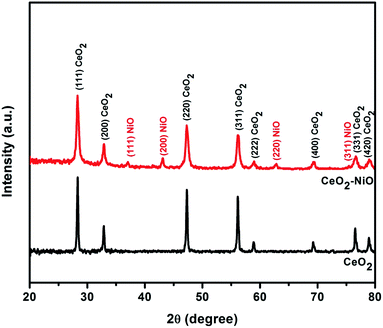
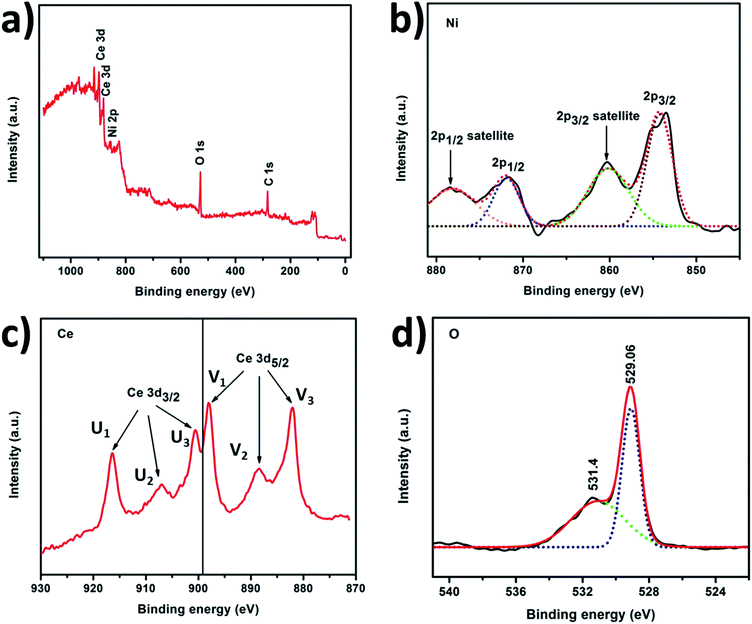
XRD patterns shown in Fig. 2 were used to investigate the crystalline phases of both pure CeO2 NPs and NiO/CeO2 NCs. As observed in the figure, pure CeO2 is crystallized in face-centered cubic structure with characteristic peaks at 2θ = 28.32°, 32.87°, 47.30°, 56.16°, 58.90°, 69.21°, 76.54°, and 78.92° which are corresponding to (111), (200), (220), (311), (222), (400), (331), and (420) planes respectively. All the observed planes are good in accordance with the standard JCPDS file no. 340394. Other diffraction peaks corresponding to any other impurities were not observed which indicates the purity and good crystallinity of the prepared CeO2 samples. From the XRD patterns of NiO/CeO2 NCs it is observed that, it has all the peaks corresponding to face centered cubic structure of CeO2 and in addition, it has diffraction peaks at 2θ = 37.09°, 43.11°, 62.87°, and 75.43° which are corresponding to (111), (200), (220), and (311) planes respectively. All these additional peaks are due to the presence of face-centered cubic structure of NiO and are well in accordance with the standard JCPDS card no. 89-7130. It was clearly observed that there were no other peaks related to CeO2–NiO alloy and no shift in the peaks indicating the perfect formation of NiO/CeO2 NCs without impurities.The information related to the valence states of the elements Ce, Ni and O on the surface of the NiO/CeO2 NCs obtained from XPS and shown in Fig. 3. The XPS survey spectrum presented in Fig. 3(a) shows the signals corresponding to Ce, Ni, O and C which confirms their existence in the sample. Ni 2p XPS spectrum of NiO/CeO2 NCs is given in Fig. 3(b), which revealed the doublet splitting of 2p into 2p3/2 and 2p1/2 states located at 854.33 eV and 872.08 eV respectively along with their respective satellite peaks located at 860.2 eV and 878.45 eV. All these peaks observed are characteristic peaks of Ni2+.41 XPS spectrum of Ce 3d is a bit complex one due to the presence of several peaks, but the careful evaluation of the peaks will leads to exact estimation of the valence state of Ce. From the Fig. 3(c) there were six peaks presented in the Ce 3d spectrum due to Ce 3d3/2 and Ce 3d5/2 at 916.43 eV, 907.06 eV, 900.56 eV, 898.06 eV, 888.43 eV and 882.06 eV which were denoted as U1, U2, U3, V1, V2, and V3 respectively. The peak located at 916.43 eV is the main characteristic peak of Ce4+ and the peak at 882.06 eV is the fingerprint peak of CeO2.42,43 All the observed peaks are characteristic peaks of Ce4+ and well in agreement with the reported results.44 O 1s XPS profile of NiO/CeO2 NCs is shown in Fig. 3(d). The peak at 529.06 eV indicates the lattice oxygen in the NiO/CeO2 NCs ample and the peak at 531.4 eV is due to the physically adsorbed oxygen.45
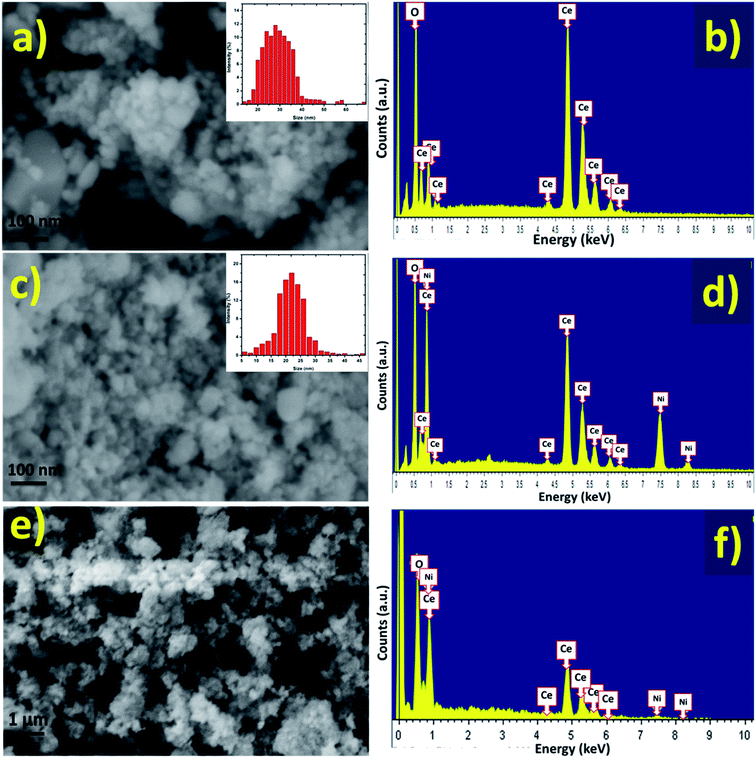
Surface morphological and compositional characteristics of pure CeO2 NPs and NiO/CeO2 NCs were investigated by FESEM and EDS respectively (Fig. 4(a–d)). As can be seen from the Fig. 4(a) the pure CeO2 NPs are in spherical shape with uniform sizes of about 20–35 nm and there are no other morphologies present in the sample indicating the formation of well-defined nanostructures. FESEM image of NiO/CeO2 NCs shown in Fig. 4(c) demonstrates the regularly shaped grains with sizes around 18–25 nm. The clear identification of NiO decoration on CeO2 surface is made from HRTEM analysis. From the EDS spectra of pure CeO2 NPs and NiO/CeO2 NCs it is obvious that the perfect stoichiometric materials are formed (Fig. 4(a and d)). Surface morphology and elemental analysis of the fabricated gas sensor using NiO/CeO2 NCs were studied by SEM and EDS respectively and presented in Fig. 4(e and f). As can be observed from the figure the surface of the prepared sensor was highly porous and has good stoichiometry even after the sensor fabrication. Highly surface porous nature of the fabricated sensor will plays a vital role in enhancing the gas sensing properties by facilitating the more surface active sites to adsorb more oxygen species onto the surface.
The morphological characteristics like shape, size, and crystallinity of the NiO/CeO2 NCs were investigated by HRTEM and shown in Fig. 5(a–d). The decoration of NiO NPs on the surface of CeO2 was clearly evidenced from the Fig. 5(a and b). As seen from the Fig. 5(a), spherical shaped NiO with an average diameter of about 6 nm was perfectly decorated on ∼14 nm sized CeO2 surface. Further confirmation about decoration was done by calculating d-spacing between the planes of NiO/CeO2 NCs (Fig. 5(c)), as observed from the figure the d-spacing of 0.321 nm has been assigned to the (111) plane of CeO2. The d-spacing of 0.199 nm and 0.244 nm was ascribed to (200) and (111) planes of NiO respectively. The selected area electron diffraction (SAED) patterns obtained for NiO/CeO2 NCs were presented in Fig. 5(d) which shows several diffraction rings. For instance, (200), and (111) are the characteristic planes of CeO2 in face centered cubic structure and (200), and (111) planes are responsible for decorated NiO which is crystallized in face centered cubic structure. These diffraction results are well in accordance with the XRD results discussed above.
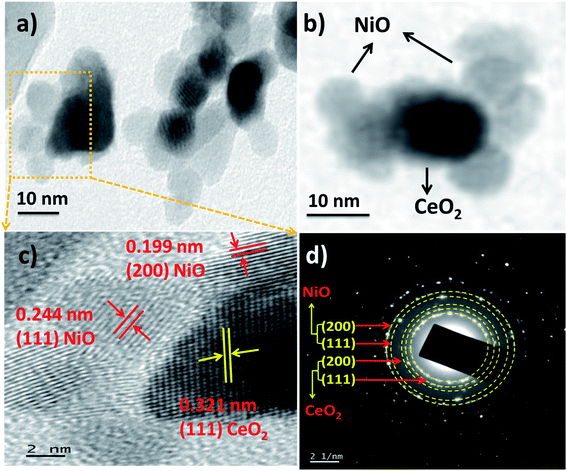 | ||
| Fig. 5 (a and b) HRTEM images of NiO/CeO2 nanocomposites with different magnifications. (c) d-spacing and (d) SAED pattern of NiO/CeO2 nanocomposites. | ||
Gas sensing properties
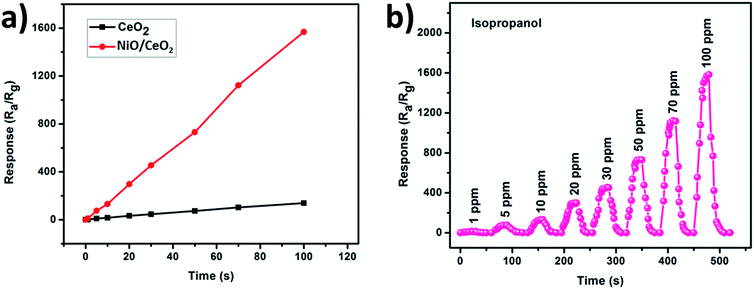
In view of negative effects of isopropanol and its irresistible usage in many applications, the need of an efficient gas sensor which can monitor isopropanol at or near room temperature is increasing in the field of gas sensors. The most promising gas sensors for the monitoring of various gases are mainly developed from the various metal oxides. Furthermore, some modifications to the metal oxide based gas sensors like, small grain size and heterojunction formation with porous outer surfaces are helping in significant enhancement in the detection of various gases at or near room temperature. Prepared nanopowders of CeO2 NPs and NiO/CeO2 NCs were used to fabricate gas sensors and tested their gas sensing performance at room temperature.Response and recovery analysis has been adopted for the evaluation of the gas sensing performance of CeO2 NPs and NiO/CeO2 NCs based gas sensors towards 100 ppm isopropanol at room temperature and the results are shown in Fig. 6(a and b). From the figure it is noted that the response of the NiO/CeO2 NCs based gas sensor is much higher than the pure CeO2 NPs based gas sensor. A highest response of ∼1570 was observed for NiO/CeO2 NCs based gas sensor which is nearly 11 times higher than the pure CeO2 based gas sensor (∼139) towards 100 ppm isopropanol at room temperature. The time taken by the sensor to change 90% of its resistance during the adsorption/desorption process is called as response/recovery time46 and it is very important parameter in the evaluation of any gas sensor performance. The response and recovery times of CeO2 NP and NiO/CeO2 NC based gas sensors also shown in the Fig. 6(a and b). It is noticed that NiO/CeO2 gas sensor has short response time (15 s) and quick recovery time (19 s) whereas CeO2 gas sensor has longer response and recovery times (93 s and 117 s respectively) compared to NiO/CeO2 gas sensor. Heterojunctions formed between n-CeO2 and p-NiO throughout sensor material are more sensitive to the surrounding atmosphere and pore channels on the outer surface of the sensor could also contributed for the enhanced response of NiO/CeO2 NCs based gas sensor.
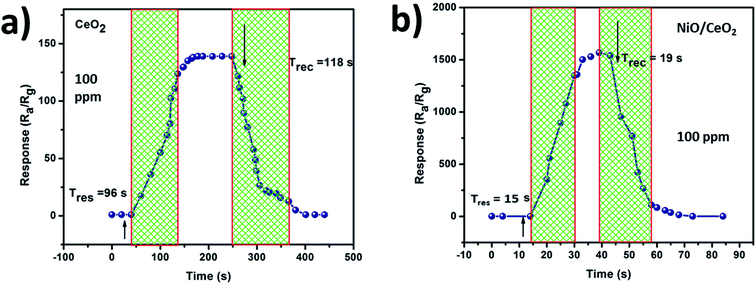 | ||
| Fig. 6 Response and recovery of (a) CeO2, and (b) NiO/CeO2 gas sensors towards 100 ppm isopropanol gas at room temperature. | ||
Further, the performance of both the sensors was compared by observing the response of the sensors with respective to the concentration of isopropanol gas (1, 5, 10, 20, 30, 50, 70 and 100 ppm) at room temperature. As shown in Fig. 7(a) the sensor fabricated from NiO/CeO2 NCs has shown highest response at every concentration of isopropanol compared to pure CeO2 based gas sensor indicating the better performance of it. A gas sensor which is aimed to use in practical applications must have good response along with better reproducibility. To test its reproducibility, the dynamic response transients of NiO/CeO2 NCs based gas sensor were recorded at room temperature towards various concentrations of isopropanol gas and shown in Fig. 7(b). As can be seen from the figure the responses of the sensor are 10.83, 75, 131.63, 297.66, 454.41, 731.49, 1122.66, and 1568.16 towards 1, 5, 10, 20, 30, 50, 70 and 100 ppm of isopropanol gas respectively. These results are clearly demonstrating that the response of the sensor towards the isopropanol gas detection is significantly increasing with the concentration of the gas which is due to the increasing of gas analytes participating in the adsorption and desorption reactions. A good repeatability during the introduction of test gas as well as fresh air into the chamber also observed from the figure. The NiO/CeO2 NCs based gas sensor has shown a response of 10.83 towards 1 ppm isopropanol suggesting the good detection ability of sensor even at lower concentrations. Highly porous nature of surface and heterojunctions formed at the two materials interface are responsible for these best gas sensing properties.
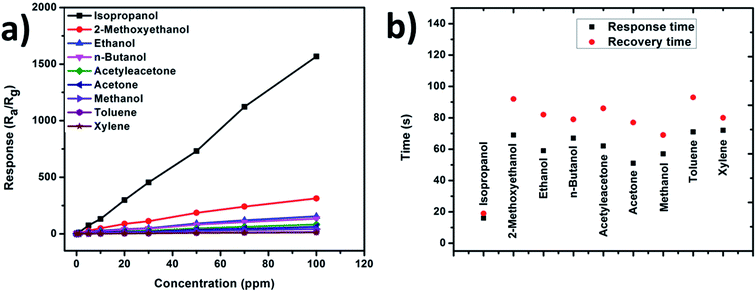
Gas sensing response towards various gases like ethanol, 2-methoxyethanol, acetylacetone, n-butanol, isopropanol, acetone, xylene, toluene, and methanol was tested for NiO/CeO2 NCs based gas sensor with varying the concentration of the gases (1, 5, 10, 20, 30, 50, 70 and 100 ppm) at room temperature. As displayed in Fig. 8(a) the sensor response is increasing with the concentration of the gases and shown extremely good response towards isopropanol gas. Further, the response and recovery times towards all the above test gases with 100 ppm concentration were measured at room temperature for both pure CeO2 and NiO/CeO2 gas sensors and shown in Fig. 8(b). From the figure it is obviously observed that the NiO/CeO2 NC gas sensor has shown sharp response and recovery times (15/19 s) towards isopropanol which are very shorter than that of n-butanol (67/79 s), ethanol (59/82 s), 2-methoxyethanol (69/92 s), acetylacetone (62/86 s), acetone (51/77 s), xylene (72/80 s), toluene (71/93 s), and methanol (57/69 s).
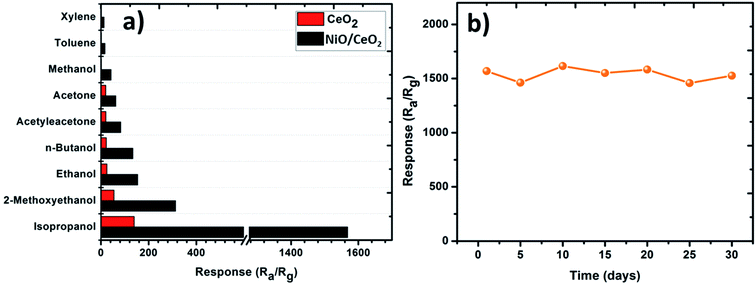
It is also known that the selectivity of the sensor is a key parameter in estimating the gas sensing performance. Any gas sensor developed to use in practical applications should possess good selectivity towards a particular gas. In general, the ability of the gas sensors in detecting a specific gas among the mixture of several gases is called as selectivity.47 Selectivities of pure CeO2 NP and NiO/CeO2 NC based gas sensors were tested towards nine gases of 100 ppm (2-methoxyethanol, ethanol, acetylacetone, n-butanol, isopropanol, acetone, xylene, toluene, and methanol) at room temperature and shown in Fig. 9(a). As displayed in figure, the NiO/CeO2 NC gas sensor has shown tremendous response towards isopropanol gas among all the test gases which showing that the sensor has good selectivity towards isopropanol. Different volatilities and different chemical properties of the gases which prompt the sensor to exhibit different adsorption and catalytic performances towards them might be the reason for the different responses.45
Long-term stability is another most important characteristic of a practical gas sensor. The stability of NiO/CeO2 NCs based gas sensor towards 100 ppm of isopropanol was tested at room temperature for 30 days. The obtained stability results are shown in Fig. 9(b) and it is clearly observed that the sensor shows nearly constant response throughout the tested period which indicates its excellent stability. The performance degradation after the first 5 days of fabrication of the sensor is just about 4.75%. Table 1 is the comparison of gas sensing performance of different types of isopropanol gas sensors from the literature.
| Material | Isopropanol concentration (ppm) | Operating temperature (°C) | Response (Ra/Rg) | Response/recovery time (s/s) | Ref. |
|---|---|---|---|---|---|
| SnO2 nanorods | 2000 | 325 | ∼125 | 6/18 | 22 |
| ZnO–CdO | 1000 | 248 | 174.8 | 16/25 | 17 |
| SnO2 nanorings | 100 | 250 | 7.27 | 6.8/38.6 | 21 |
| CuO/SnO2 | 100 | 280 | 50.4 | 4/9 | 18 |
| SnO2/ZnO | 500 | 300 | 103.3 | 14/17 | 19 |
| NiO/CeO2 | 100 | RT | 1568 | 15/19 | This work |
Isopropanol gas sensing mechanism
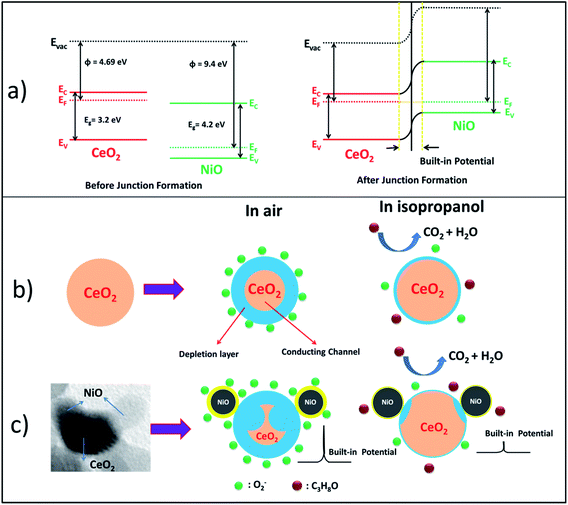
CeO2 gas sensing mechanism can be explained by basic well-known n-type metal oxide sensing mechanism which involves the change of electrical resistance in virtue of adsorption and desorption of oxygen and target gas on the surface of the sensor.19,48 Fig. 10(b) demonstrates the gas sensing mechanism of CeO2 sensor. In the presence of air atmosphere, oxygen molecules get adsorbed on the surface of the sensor by extracting the conducting electrons from the sensing material (CeO2) and form the negatively charged oxygen species (O(ads)2−, O2(ads)−, O(ads)−, and O2(ads)2−) which results in the development of electron depletion layer at the air and sensor interface. Extraction of conducting electrons from the sensing material leads to an increase in the resistance of the material. Introduction of any reducing gas (isopropanol in present case) into the sensing chamber results in the release of extracted electrons back to the sensor by getting oxidized into CO2 and H2O during which the sensor resistance decreases. This variation of electrical resistance in the presence of air and target gas is the response of the sensor. As the oxygen storage capacity of the CeO2 is high, it extracts more number of electrons while adsorbing the oxygen and releases maximum electrons while reducing in the presence of reducing gas.Band diagram of the NiO/CeO2 NCs before and after junction formation is presented in Fig. 10(a). After decorating NiO NPs on CeO2 surface, the diffusion of electrons and holes one side to other side takes place until their Fermi levels become equal. Electrons from CeO2 side diffuse into NiO side and holes from NiO side diffuse into CeO2 side due to the concentration gradient of the charge carriers. After getting the balanced state of the carriers, Fermi level of the system gets equalized. This whole phenomenon develops an internal potential called built-in potential at the interface of the two materials which further hinders the diffusion of both the charge carriers (electrons and holes). This built-in potential plays a vital role in sensing performance of NiO/CeO2 NCs. In the presence of oxidative and reductive environments the width of the built-in potential varies according to the availability of the charge carriers.
The mechanism involved in the enhanced sensing performance of NiO/CeO2 NC sensor towards isopropanol at room temperature has been shown in Fig. 10(c). The superior sensing performance of NiO/CeO2 NCs is presided over by the parameters like, highly porous surface of the sensors, small grain sizes of the sensing material, built-in potential at p-NiO and n-CeO2 interface, highly catalytic nature and chemical sensitization of decorated NiO, and the behavior of the targeted gas. From the SEM images of the sensors fabricated from NiO/CeO2 NCs it is clear that the surface of the sensor is highly porous and improves the diffusion rate of air and targeted gas into the sensor. Small grain sizes (<25 nm) as evidenced from the HRTEM studies provide the large active surface area which further helps in enhanced sensing performance.
There are three types of junctions (NiO–NiO, CeO2–CeO2, and NiO–CeO2) formed in the NiO/CeO2 NC sensor which can be modulated in the presence of targeted gas and fresh air. Among them, the junction formed at the interface of p-NiO and n-CeO2 is the greatest contributor to the enhanced sensing performance of NiO/CeO2 NC sensor than pure CeO2 sensor. As discussed above, decoration of p-NiO on n-CeO2 initiates the diffusion of majority charge carriers (holes in NiO side and electrons in CeO2 side) to opposite sides until the equalization of their Fermi levels, which results in the development of an internal potential (built-in potential) at the junction. This built-in potential further reduces the conducting region of CeO2 and helps in the enhanced sensing performance by the variation of its width during the adsorption and desorption of air and targeted gas. NiO/CeO2 NC sensor possess electrons as majority carriers, which made it predominantly an n-type metal oxide sensor. In air atmosphere free electrons from NiO/CeO2 NC sensor will be trapped by adsorbed oxygen molecules and form negatively charged ion species (O(ads)2−, O2(ads)−, O(ads)−, and O2(ads)2−). This trapping of electrons from the sensor material increases the width of the built-in potential as well as decreases the conducting region of CeO2, which further increases the resistance of the sensor. In the presence of target isopropanol gas, trapped electrons will be released back to the sensor due to the reaction of isopropanol with adsorbed oxygen ions and decreases the width of the built-in potential and increases the volume of conducting region of CeO2, which presumably causes to the drastical decrease in the sensor resistance. These huge resistance changes of the sensor in the presence of air and targeted isopropanol lead to the tremendous response of NiO/CeO2 NC sensor than pure CeO2 sensor. In addition to this built-in potential mechanism, surface adsorbed oxygen theory which is discussed for pure CeO2 sensor is also applicable here. The whole process is schematically shown in Fig. 10(c)
Chemical sensitization with great catalytic activity of decorated p-NiO plays an important role in enhancing the sensor response.49 The adsorption and desorption rates of the molecular oxygen and test gas will be greatly enhanced by the chemical sensitization of p-NiO on the surface of the sensor. The catalytic activity of the NiO increases the reaction rate by decomposing of the test gas molecules to facilitate its oxidation on the surface of the sensor. Every individual gas which was tested in this experiment has its own physico-chemical properties like, bond dissociation energy, volatility, partial pressure etc. which affect the gas sensing performance greatly. The molecular interaction of targeted gas with adsorbed oxygen species, and its dissimilar molecular interactions on NiO/CeO2 sensor surface significantly affect the sensing performance. The reactions occurred during the gas sensing test are discussed below. All the gases tested in the experiment were reducing in nature.
The exposure of NiO decorated CeO2 sensor to isopropanol gas at room temperature reacts with the adsorbed oxygen and leads to the formation of CO2 and H2O along with the release of plenty of free electrons which reduces the sensor resistance. Isopropanol gas interacts with the adsorbed oxygen (O2(ads)−) as per the following reaction.
| (CH3)2CHOH + 4O2(ads)− → 3CO2 + 3H2O + H2 + 4e− | (3) |
Finally, the highly porous nature, built-in potential developed at the interface of NiO and CeO2, unique catalytic properties and chemical sensitization of NiO and respective physico-chemical properties of individual gas influenced the gas sensing performance of NiO and CeO2 gas sensor and helped in the enhanced sensing behavior than pure CeO2 sensors.
Conclusion
CeO2 nanostructures were synthesized by using co-precipitation technique and NiO was decorated on the surface of CeO2 by sol–gel process. Structural, morphological and compositional studies were carried out systematically. Perfect decoration of NiO on CeO2 surface was confirmed from HRTEM analysis. SEM studies revealed the porous nature of the NiO/CeO2 sensor surface. Pristine CeO2 and NiO/CeO2 sensors were subjected to their gas sensing studies under room conditions and observed enhanced gas sensing properties for NiO/CeO2 sensor towards isopropanol. A highest response of ∼1570 was observed for NiO/CeO2 NCs based gas sensor which is nearly 11 times higher than the pure CeO2 based gas sensor (∼139) towards 100 ppm isopropanol at room temperature. Sharp response and recovery times (15 s/19 s) were obtained for NiO/CeO2 sensor towards 100 ppm isopropanol at room temperature, and long-term stability also found from the studies.Conflicts of interest
There are no conflicts to declare.Acknowledgements
The authors thank the Head, Department of Physics, Osmania University, Hyderabad for providing necessary experimental facilities to carry out this work. The authors (NJB & JS) thankful to DST, New Delhi, India for providing financial assistance in the form of INSPIRE FELLOWSHIP during the research work. One of the authors (MVRR) thanks DST-SERB (File No.: EMR/2017/002651) for providing necessary financial support to carryout this work. A part of the reported work (characterization) was carried out at the NCPRE, IITB under PUMP which is sponsored by MNRE, Government of India. A part of the reported work (characterization) was carried out at the IITB under INUP which is sponsored by DeitY, MCIT, Government of India.References
- T. Montini, M. Melchionna, M. Monai and P. Fornasiero, Chem. Rev., 2016, 116, 5987–6041 CrossRef CAS PubMed.
- T. N. Ravishankar, T. Ramakrishnappa, G. Nagaraju and H. Rajanaika, ChemistryOpen, 2015, 4, 146–154 CrossRef CAS PubMed.
- S. Rajeshkumar and P. Naik, Biotechnol. Rep., 2018, 17, 1–5 CrossRef CAS PubMed.
- S. Das, J. M. Dowding, K. E. Klump, J. F. McGinnis, W. Self and S. Seal, Nanomedicine, 2013, 8, 1483–1508 CrossRef CAS PubMed.
- P. Tamizhdurai, S. Sakthinathan, S.-M. Chen, K. Shanthi, S. Sivasanker and P. Sangeetha, Sci. Rep., 2017, 7, 46372 CrossRef CAS PubMed.
- M. Sivakumar, M. Sakthivel and S.-M. Chen, RSC Adv., 2016, 6, 104227–104234 RSC.
- S. Yan, X. Liang, H. Song, S. Ma and Y. Lu, Ceram. Int., 2018, 44, 358–363 CrossRef CAS.
- X. Yang, X. Hao, T. Liu, F. Liu, B. Wang, C. Ma, X. Liang, C. Yang, H. Zhu, J. Zheng, T. He and G. Lu, Sens. Actuators, B, 2018, 269, 118–126 CrossRef CAS.
- J. Wang, Z. Li, S. Zhang, S. Yan, B. Cao, Z. Wang and Y. Fu, Sens. Actuators, B, 2018, 255, 862–870 CrossRef CAS.
- S. M. A. Durrani, M. F. Al-Kuhaili, I. A. Bakhtiari and M. B. Haider, Sensors, 2012, 12, 2598–2609 CrossRef CAS PubMed.
- A. Wahid, A. M. Asiri and M. M. Rahman, Environ. Nanotechnol. Monit. Manage., 2018, 10, 314–321 Search PubMed.
- Z. Zhao, X. Liu, X. Xing, Y. Lu, Y. Sun, X. Ou, X. Su, J. Jiang, Y. Yang, J. Chen, B. Shen and Y. He, PLoS One, 2016, 11, e0162762 CrossRef PubMed.
- H. M. Burlage and D. B. Hawkins, J. Am. Pharm. Assoc., 1946, 35, 379–384 CrossRef CAS.
- O. Desy, D. Carignan, M. Caruso and P. O. de Campos-Lima, J. Immunol., 2008, 181, 2348–2355 CrossRef CAS.
- D. Hu, B. Han, S. Deng, Z. Feng, Y. Wang, J. Popovic, M. Nuskol, Y. Wang and I. Djerdj, J. Phys. Chem. C, 2014, 118, 9832–9840 CrossRef CAS.
- Y.-L. Wu, Q. Luan, S.-J. Chang, Z. Jiao, W. Y. Weng, Y.-H. Lin and C. L. Hsu, IEEE Sens. J., 2014, 14, 401–405 CAS.
- X. Cai, D. Hu, S. Deng, B. Han, Y. Wang, J. Wu and Y. Wang, Sens. Actuators, B, 2014, 198, 402–410 CrossRef CAS.
- B. Zhang, W. Fu, X. Meng, R. A, P. Su and H. Yang, Appl. Surf. Sci., 2018, 456, 586–593 CrossRef CAS.
- M. Poloju, N. Jayababu, E. Manikandan and M. V. Ramana Reddy, J. Mater. Chem. C, 2017, 5, 2662–2668 RSC.
- C. Fan, G. Liu, Y. Zhang and M. Wang, Mater. Lett., 2017, 209, 8–10 CrossRef CAS.
- S.-H. Li, Z. Chu, F.-F. Meng, T. Luo, X.-Y. Hu, S.-Z. Huang and Z. Jin, J. Alloys Compd., 2016, 688, 712–717 CrossRef CAS.
- D. Hu, B. Han, R. Han, S. Deng, Y. Wang, Q. Li and Y. Wang, New J. Chem., 2014, 38, 2443 RSC.
- J. Zhang, X. Liu, G. Neri and N. Pinna, Adv. Mater., 2016, 28, 795–831 CrossRef CAS PubMed.
- S. Park, G.-J. Sun, C. Jin, H. W. Kim, S. Lee and C. Lee, ACS Appl. Mater. Interfaces, 2016, 8, 2805–2811 CrossRef CAS PubMed.
- X. Deng, L. Zhang, J. Guo, Q. Chen and J. Ma, Mater. Res. Bull., 2017, 90, 170–174 CrossRef CAS.
- K. Fan, J. Guo, L. Cha, Q. Chen and J. Ma, J. Alloys Compd., 2017, 698, 336–340 CrossRef CAS.
- J. Ma, L. Mei, Y. Chen, Q. Li, T. Wang, Z. Xu, X. Duan and W. Zheng, Nanoscale, 2013, 5, 895–898 RSC.
- M. Bao, Y. Chen, F. Li, J. Ma, T. Lv, Y. Tang, L. Chen, Z. Xu and T. Wang, Nanoscale, 2014, 6, 4063 RSC.
- J. Pang, R. G. Mendes, A. Bachmatiuk, L. Zhao, H. Q. Ta, T. Gemming, H. Liu, Z. Liu and M. H. Rummeli, Chem. Soc. Rev., 2019, 48, 72–133 RSC.
- J. Pang, A. Bachmatiuk, Y. Yin, B. Trzebicka, L. Zhao, L. Fu, R. G. Mendes, T. Gemming, Z. Liu and M. H. Rummeli, Adv. Energy Mater., 2018, 8, 1702093 CrossRef.
- J. Pang, R. G. Mendes, P. S. Wrobel, M. D. Wlodarski, H. Q. Ta, L. Zhao, L. Giebeler, B. Trzebicka, T. Gemming, L. Fu, Z. Liu, J. Eckert, A. Bachmatiuk and M. H. Rümmeli, ACS Nano, 2017, 11, 1946–1956 CrossRef CAS PubMed.
- F. Shu, M. Wang, J. Pang and P. Yu, Front. Chem. Sci. Eng., 2018 DOI:10.1007/s11705-018-1754-3.
- K. Olszowska, J. Pang, P. S. Wrobel, L. Zhao, H. Q. Ta, Z. Liu, B. Trzebicka, A. Bachmatiuk and M. H. Rummeli, Synth. Met., 2017, 234, 53–85 CrossRef CAS.
- K. Wang, J. Pang, L. Li, S. Zhou, Y. Li and T. Zhang, Front. Chem. Sci. Eng., 2018, 12, 376–382 CrossRef CAS.
- R. G. Mendes, J. Pang, A. Bachmatiuk, H. Q. Ta, L. Zhao, T. Gemming, L. Fu, Z. Liu and M. H. Rümmeli, ACS Nano, 2019, 13, 978–995 CAS.
- G. S. Martynková, F. Becerik, D. Plachá, J. Pang, H. Akbulut, A. Bachmatiuk and M. H. Rummeli, J. Nanosci. Nanotechnol., 2019, 19, 2770–2774 CrossRef PubMed.
- J. Hu, Y. Sun, Y. Xue, M. Zhang, P. Li, K. Lian, S. Zhuiykov, W. Zhang and Y. Chen, Sens. Actuators, B, 2018, 257, 124–135 CrossRef CAS.
- M. Li, W. Ren, R. Wu and M. Zhang, Sensors, 2017, 17, 1577 CrossRef.
- J.-H. Kim, J.-H. Lee, A. Mirzaei, H. W. Kim and S. S. Kim, Sens. Actuators, B, 2018, 258, 204–214 CrossRef CAS.
- M. ul Haq, Z. Wen, Z. Zhang, S. Khan, Z. Lou, Z. Ye and L. Zhu, Sci. Rep., 2018, 8, 1705 CrossRef.
- H. Gao, L. Zhao, L. Wang, P. Sun, H. Lu, F. Liu, X. Chuai and G. Lu, Sens. Actuators, B, 2018, 255, 3505–3515 CrossRef CAS.
- J. P. Holgado, R. Alvarez and G. Munuera, Appl. Surf. Sci., 2000, 161, 301–315 CrossRef CAS.
- A. Trinchi, Sens. Actuators, B, 2003, 95, 145–150 CrossRef CAS.
- L. Liao, H. X. Mai, Q. Yuan, H. B. Lu, J. C. Li, C. Liu, C. H. Yan, Z. X. Shen and T. Yu, J. Phys. Chem. C, 2008, 112, 9061–9065 CrossRef CAS.
- V. K. Tomer and S. Duhan, J. Mater. Chem. A, 2016, 4, 1033–1043 RSC.
- X. Lai, G. Shen, P. Xue, B. Yan, H. Wang, P. Li, W. Xia and J. Fang, Nanoscale, 2015, 7, 4005–4012 RSC.
- A. Dey, Mater. Sci. Eng., B, 2018, 229, 206–217 CrossRef CAS.
- M. Poloju, N. Jayababu and M. V. Ramana Reddy, Mater. Sci. Eng., B, 2018, 227, 61–67 CrossRef CAS.
- Z. Qu, Y. Fu, B. Yu, P. Deng, L. Xing and X. Xue, Sens. Actuators, B, 2016, 222, 78–86 CrossRef CAS.
Footnote |
| † Electronic supplementary information (ESI) available. See DOI: 10.1039/c9ra00441f |
| This journal is © The Royal Society of Chemistry 2019 |

