DOI:
10.1039/C9RA00305C
(Paper)
RSC Adv., 2019,
9, 8415-8425
Thermal debinding behavior of a low-toxic DMAA polymer for gelcast ceramic parts based on TG-FTIR and kinetic modeling†
Received
13th January 2019
, Accepted 7th March 2019
First published on 14th March 2019
Abstract
In this work, the pyrolysis characteristics of a low-toxic N,N-dimethylacrylamide (DMAA) gel polymer was investigated through nonisothermal thermogravimetry (TG) and TG-FTIR analyses. Moreover, the thermal debinding kinetics of gelcast SiAlON ceramic parts was studied through three different kinetic models: the Coats–Redfern (C–R) method, distributed activation energy model (DAEM) and three-Gaussian-DAEM-reaction model (3-DAEM). The rationality and adaptability of the three models to the thermal debinding kinetics study were analyzed by comparison with experimental data. The results showed that three mass loss zones were observed in the temperature ranges of 100–320 °C, 320–520 °C and 520–600 °C, respectively, and the main pyrolysis gas products were CO2, H2O and CH4. The conversion rate (α) curves calculated by 3-DAEM were more consistent with the experimental values than those calculated with the C–R and DAEM methods. The fitting quality parameter (Fit%) was less than 2.63%, and the reaction rate (dα/dT) curves calculated by 3-DAEM were bimodal distribution curves, which were in good agreement with the experimental results. The kinetic parameters (E0,i, k0,i and σi) of the global thermal debinding process calculated by 3-DAEM were 116.00–145.79 kJ mol−1, 1.10 × 10⁹ s−1 and 1.67–43.25 kJ mol−1, respectively. It is anticipated that the study achievements can be used to help predict the thermal debinding behavior and design a reasonable debinding technology for the gelcasting of ceramic parts.
1 Introduction
As a novel molding technology, gelcasting combines traditional ceramic colloidal molding with organic chemistry to prepare ceramic components with near-net, complex shapes and high reliability.1–6 Gelcasting ingeniously utilizes the polymerization of organic monomers and crosslinkers to form a polymer with the high strength and toughness of a three-dimensional network structure to achieve in situ solidification of ceramic suspensions.7
Debinding is a critical step in the gelcasting technique. Currently, removing the polymer completely without introducing defects such as cracks and warpage remains a challenge.8,9 Any residual polymer would be transferred to the next step, affecting the formation of the sintering neck between the ceramic particles and causing adverse effects on the properties of sintered bodies. At present, four common debinding techniques have been developed for colloidal molding, such as thermal debinding,10,11 solvent debinding,12,13 wicking debinding14 and catalytic debinding.15 Among these debinding techniques, thermal debinding is the most widely used in gelcasting methods because the low polymer content in gelcast green bodies is easily removed by thermal degradation, and the process is easily controlled to achieve debinding and sintering integration.16,17 The removal of polymers is a very complex physical and chemical process, which involves the heterogeneous reaction of solids and gases and the transfer and diffusion/convection of heat and pyrolysis gases in the already emptied pores, as shown in Fig. 1. Because a large amount of pyrolysis volatiles are released during the debinding process, structural defects such as blisters, cracks and deformations are easily introduced due to excessive pressure or stress inside the body if the debinding techniques are unreasonable. Therefore, a reasonable thermal debinding process is of the utmost importance. The debinding kinetics are the fundamental basis for optimizing thermal debinding techniques.
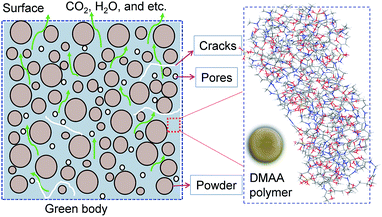 |
| | Fig. 1 Heterogeneous reactions, mass and heat transfer processes during thermal debinding. | |
At present, the relevant research on the thermal debinding mechanism focuses on the following aspects: the thermal decomposition reaction and the mass and heat transfer mechanism of the polymer in the thermal debinding process along with the thermal debinding kinetics. These two aspects of research are of great significance for optimizing thermal debinding techniques and avoiding the introduction of defects. The existing research on the mass transfer mechanism of the thermal debinding process is mainly based on classical mass transfer equations such as gas phase diffusion or the permeation process described by Darcy's law or Fick's law.18 In recent years, the finite element method has also been initially applied in the study of thermal degreasing processes. Heaney et al.19 studied the shrinkage characteristics of metal parts during debinding and sintering in metal injection molding by the finite element method. Additionally, based on the finite element method, the temperature distribution and deformation characteristics in the body of 316L stainless steel feedstocks prepared by powder injection molding in the thermal debinding process were investigated by Belgacem et al.20 In their works, the simulation results are in good agreement with experimental tests. At present, research on the thermal debinding kinetics is mainly based on the Coats–Redfern (C–R) integration method and model-free methods. Yuan et al.17 reported the debinding kinetics of aluminum-copper bodies prepared by gelcasting using the C–R method and established the kinetic equation. Salehi et al.21 studied the debinding kinetics of thermoplastic processing of yttria-stabilized zirconia (YSZ) ceramics using model-free methods such as Ozawa–Flynn–Wall, Kissinger–Akahira–Sunose and Friedman. In addition to the above methods, the distributed activation energy model (DAEM) is also a widely used pyrolysis kinetic model.21–25 Compared with the traditional C–R method, DAEM has made great progress in data processing methods such as the Miura differential method26 and the Miura integral method27 to eliminate the effect of heating rate on the solutions to the kinetic parameters, and this method has been widely applied in the study of the pyrolysis kinetics of organic polymers such as coal,28 solid waste24 and biomass.29 However, few reports on the thermal debinding kinetics of gelcast ceramic bodies using DAEM are currently available.
N,N-Dimethylacrylamide (DMAA) has proven to be a promising monomer for gelcasting various ceramic materials.7,30,31 Despite the presence of many studies on the polymerization mechanism and thermal stability of DMAA gels,30,32 few studies have been conducted on its debinding kinetics and the distribution function of the activation energy. In this work, the pyrolysis characteristics and kinetics of the DMAA gel during a thermal debinding process of a gelcast SiAlON green body were investigated through nonisothermal thermogravimetric analysis (TGA), thermogravimetry-Fourier transform infrared spectroscopy (TG-FTIR) and three different kinetic models (C–R, DAEM and the three-Gaussian-DAEM-reaction model (3-DAEM)). Moreover, the rationality and adaptability of the three models to be used as a predictive tool were tested by comparison with experimental data.
2 Materials and methods
2.1 Materials
The green body used in this work was a mixture of Si3N4 (SN-E10, UBE Industries, Ube, Japan), AlN (99.5% purity, 2.0 μm, Aladdin Industrial Co., Ltd., China), Al2O3 (99.9% purity, 0.5 μm, AKP-50, Sumitomo Chemical, Japan), Y2O3 (99.99% purity, grade fine, H.C. Stark, Germany) and Ce2O3 (99.99% purity, 5 μm, Aladdin Industrial Co., Ltd., China) powders combined with gel polymer. Before gelcasting, a thermal treatment at 850 °C for 2 h in air was applied for the surface modification of AlN such that a dense alumina film was formed on the surface of AlN powders, thereby resulting in hydrolytic resistance.33 DMAA (Kowa Co., Ltd., Japan) was used as a monomer, along with the N,N′-methylenebisacrylamide (MBAM) crosslinker (Aladdin Industrial Co., Ltd., China), the ammonium polyacrylate (NH4PAA) dispersant (Ling Feng Chemical Reagent Co., Ltd., Shanghai, China), the ammonium persulfate (APS) initiator (self-prepared, 10 wt%), and N,N,N′,N′-tetramethylethylene-diamine (TEMED, Aladdin Industrial Co., Ltd., China) as a catalyst.
2.2 Experimental facility and method
A premixed solution containing the DMAA monomer, MBAM crosslinker and dispersant was prepared by dissolving the components in deionized water. The mass of DMAA and MBAM is 13 wt% of the total mass of the premixed solution with a DMAA to MBAM ratio of 14![[thin space (1/6-em)]](https://www.rsc.org/images/entities/char_2009.gif) :
:![[thin space (1/6-em)]](https://www.rsc.org/images/entities/char_2009.gif) 1. The premixed solution was adjusted to pH = 11 by adding ammonia water. Then, the premixed solution was mixed with Si3N4, Al2O3, AlN, Y2O3 and Ce2O3 mixture powders (mass ratio of Si3N4
1. The premixed solution was adjusted to pH = 11 by adding ammonia water. Then, the premixed solution was mixed with Si3N4, Al2O3, AlN, Y2O3 and Ce2O3 mixture powders (mass ratio of Si3N4![[thin space (1/6-em)]](https://www.rsc.org/images/entities/char_2009.gif) :
:![[thin space (1/6-em)]](https://www.rsc.org/images/entities/char_2009.gif) Al2O3
Al2O3![[thin space (1/6-em)]](https://www.rsc.org/images/entities/char_2009.gif) :
:![[thin space (1/6-em)]](https://www.rsc.org/images/entities/char_2009.gif) AlN
AlN![[thin space (1/6-em)]](https://www.rsc.org/images/entities/char_2009.gif) :
:![[thin space (1/6-em)]](https://www.rsc.org/images/entities/char_2009.gif) Y2O3
Y2O3![[thin space (1/6-em)]](https://www.rsc.org/images/entities/char_2009.gif) :
:![[thin space (1/6-em)]](https://www.rsc.org/images/entities/char_2009.gif) Ce2O3 of 25
Ce2O3 of 25![[thin space (1/6-em)]](https://www.rsc.org/images/entities/char_2009.gif) :
:![[thin space (1/6-em)]](https://www.rsc.org/images/entities/char_2009.gif) 2.2
2.2![[thin space (1/6-em)]](https://www.rsc.org/images/entities/char_2009.gif) :
:![[thin space (1/6-em)]](https://www.rsc.org/images/entities/char_2009.gif) 3.1
3.1![[thin space (1/6-em)]](https://www.rsc.org/images/entities/char_2009.gif) :
:![[thin space (1/6-em)]](https://www.rsc.org/images/entities/char_2009.gif) 1
1![[thin space (1/6-em)]](https://www.rsc.org/images/entities/char_2009.gif) :
:![[thin space (1/6-em)]](https://www.rsc.org/images/entities/char_2009.gif) 2) with a solid loading of 45 vol%. The suspensions were ball milled for 4 h in a planetary ball grinder (zirconia ball). After adding 1.0 wt% APS and TEMED, the slurry was mixed and degassed for 15 min by vacuum pumping. Afterward, the slurry was cast into a designed plastic mold (80 mm × 80 mm × 20 mm) and then was placed under room temperature for 40 min until sufficient polymerization of the gel system. After drying at 80 °C for 24 h, the gelled green bodies were demolded and dried in a temperature-humidity test chamber under controlled humidity conditions (40 °C, 98% relative humidity) for 24 h and subsequently in a drying oven at 90 °C for 24 h.
2) with a solid loading of 45 vol%. The suspensions were ball milled for 4 h in a planetary ball grinder (zirconia ball). After adding 1.0 wt% APS and TEMED, the slurry was mixed and degassed for 15 min by vacuum pumping. Afterward, the slurry was cast into a designed plastic mold (80 mm × 80 mm × 20 mm) and then was placed under room temperature for 40 min until sufficient polymerization of the gel system. After drying at 80 °C for 24 h, the gelled green bodies were demolded and dried in a temperature-humidity test chamber under controlled humidity conditions (40 °C, 98% relative humidity) for 24 h and subsequently in a drying oven at 90 °C for 24 h.
The thermal stability of the DMAA polymer during debinding was determined by thermogravimetric-differential scanning calorimeter analysis (TG-DSC, STA-449 F3 Jupiter, NETZSCH, Germany). Approximately 15 mg of specimen powder was used for each experiment in a pure Ar (99.999%, a flow of 20 mL min−1) atmosphere. The nonisothermal runs are as follows: the temperature ranged from 35 °C to 900 °C with heating rates of 5, 15, and 20 °C min−1.
The characteristics of organic chemical groups in the DMAA polymer during debinding were identified by TG-FTIR (TGA8000-FRONTIER, PE, USA). A 6.4 mg sample was heated from 35 °C to 900 °C at a heating rate of 10 °C min−1 under 40 mL min−1 He flow. The pyrolysis volatiles from TG were identified by the FTIR measurement. The IR absorption band ranged from 400 to 4000 cm−1 with a detection resolution of 4 cm−1.
3 Kinetics methods
3.1 The C–R method
The pyrolysis reaction rate of the polymer for the gelcast green ceramic parts is expressed as:| |
 | (1) |
where α is the conversion rate, α = (m0 − mt)/(m0 − m∞), m0, mt, and m∞ are the initial, actual and final mass of the gel polymer, respectively, f(α) is the differential reaction mechanism function for the reaction model and k is the Arrhenius rate constant, which is expressed as:| |
 | (2) |
Eqn (1) can be rewritten by substituting the heating rate constant (β = dT/dt) as follows:
| |
 | (3) |
where
β is the heating rate,
k0 is the pre-exponential factor,
E is the activation energy,
R is the universal gas constant and
T is the actual reaction temperature.
For the simple reaction kinetic mechanism function f(α), the pyrolysis reaction of the gel polymer can be regarded as an isothermal homogeneous reaction, and f(α) = (1 − α)n is used to express the reaction mechanism; thus, the pyrolysis reaction rate equation can be depicted as follows:
| |
 | (4) |
The integral form of the nonisothermal reaction mechanism function g(α) is given as shown in eqn (5):
| |
 | (5) |
where
y =
E/(
RT),

The C–R integration method was used to treat the reaction kinetics at a constant heating rate, and the pyrolysis process of the gel polymer was approximated as a first-order kinetic reaction. Then, eqn (5) can be expressed as:
| |
 | (6) |
For a typical reaction zone and most activation energy values, E, the 2RT/E is much less than 1, and  in eqn (6) can be approximated as a constant,
 34 therefore, eqn (6) can be further simplified as follows:
| |
 | (7) |
| |
 | (8) |
Therefore, when n = 1, plot  vs. 1/T, and when n ≠ 1, plot
  vs. 1/T. A linear relationship can be obtained by determining a reasonable value of n. Then, the activation energy E and the pre-exponential factor k0 can be obtained according to the slope (−E/R) and the intercept
  of the fitting equations.
3.2 The DAEM method
The DAEM is based on two basic assumptions: (1) the reaction system consists of numerous independent first-order reactions that possess different activation energies and (2) the activation energy of each reaction presents a form of continuous distribution and is expressed by a continuously distributed function f(E). The conversion rate of the gel polymer during thermal debinding can be expressed as:| |
 | (9) |
Here, f(E) is assumed to be a Gaussian distribution function and can be defined as:
| |
 | (10) |
where
E0 is the mean activation energy and
σ is the standard deviation of the distributed activation energy.
The reaction rate equation is written as the following differential equation:
| |
 | (11) |
According to the theoretical analysis method of the order approximation function proposed by Miura et al.,27 namely, the Miura integral method, eqn (11) can be simplified as given by eqn (12), which can be used to accurately calculate the kinetic parameters (activation energy E and the pre-exponential factor k0) in DAEM.
| |
 | (12) |
3.3 The 3-DAEM method
In this model, the DMAA polymer is assumed to be the sum of three independently reacting pseudo components. The pyrolysis reaction of every such pseudo component is regarded as infinite first-order reactions. The pyrolysis reaction rate expression for each first-order reaction is expressed as:35| |
 | (13) |
| |
 | (14) |
where ψ(E, T) is the integral of the Boltzmann factor, ci is the mass fraction of pseudo component i in the gel polymer, and subscript i refers to the three pseudo components (i = 1, 2, and 3).
ψ(E, T) is simplified using the Fong–Hong–Zou approximation algorithm, and therefore, the second-order integral defined in eqn (13) is converted into a first-order integral, thereby reducing the calculation capacity.29,36 ψ(E, T) can be rewritten as follows:
| |
 | (15) |
where
u =
E/(
RT).
Based on the experimental thermogravimetric data, the unknown kinetic parameters (E0,i, k0,i, and σi) of the 3-DAEM are calculated using the Lemberg–Marquardt algorithm's nonlinear least squares fitting method.29 The calculation equation is given as:
| |
 | (16) |
where subscript
i indicates the data points used,
nd refers to the number of data points,
αexp,ij represents the experimental data at heating rate
j (
j = 1, 2, and 3 correspond to the heating rates of 5, 15, and 20 °C min
−1, respectively), and
αcal,ij denotes a series of parameters and data calculated using
eqn (13).
The consistency between the model predicted value and the experimental data can be determined through the following Fit quality parameter:
| |
 | (17) |
where
Np indicates the number of data points.
4 Results and discussion
4.1 TG, TG-FTIR analysis
Fig. 2 shows the TG, DSC and reaction rate (dα/dT) curves of the SiAlON green body obtained at 5 °C min−1, 15 °C min−1 and 20 °C min−1. As shown in Fig. 2a and b, the trend of the TG and dα/dT curves is basically the same at the different heating rates. As the heating rate increases, both the TG and dα/dT curves move toward the high-temperature region; that is, the initial temperature and the termination temperature of the polymer pyrolysis are shifted to the high-temperature zone. This result occurs mainly because the higher the heating rate is, the lower the reaction time and degree, meaning that there has not been enough time for polymer degradation to result in hysteresis. Ignoring the effect of residual moisture in the body, three weight loss zones were observed in the temperature ranges of 100–320 °C, 320–520 °C and 520–600 °C. The first two zones are shoulder peaks, and the mass loss rate reached the highest value at 380–410 °C in zone 2. These are typical mass losses caused by polymer pyrolysis, which correspond to the two main pyrolysis stages of the DMAA polymer. As seen from the DSC curves, the pyrolysis reactions in the first two weight loss zones are endothermic processes, and the endothermic ranges and intensities at different heating rates are listed in Table 1. The pyrolysis reactions in zone 3 is an exothermic process. The exothermic and endothermic phenomena are more pronounced as the heating rate increases.
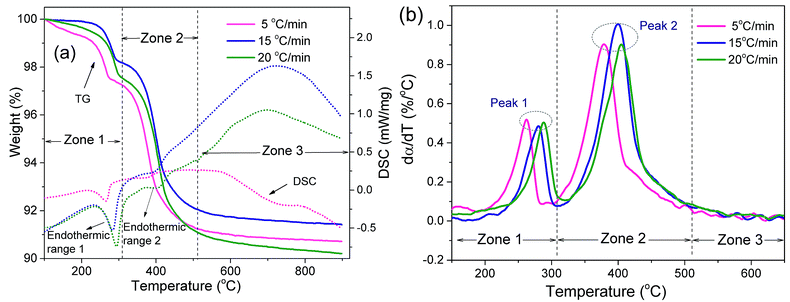 |
| | Fig. 2 TG, DSC and dα/dT curves of the thermal debinding process at different heating rates: (a) TG, DSC and (b) dα/dT. | |
Table 1 Endothermic ranges of the DSC curves at different heating rates
| Heating rates (°C min−1) |
Endothermic range 1 |
Endothermic range 2 |
| Ti (°C) |
Tf (°C) |
Peak (°C) |
Integral (J g−1) |
Ti (°C) |
Tf (°C) |
Peak (°C) |
Integral (J g−1) |
| 5 |
235.2 |
277.0 |
264.9 |
−80.58 |
277.0 |
396.3 |
318.2 |
−18.4 |
| 15 |
249.0 |
300.4 |
283.9 |
−76.96 |
300.4 |
426.6 |
327.1 |
−26.67 |
| 20 |
262.3 |
310.1 |
294.2 |
−65.19 |
310.1 |
414.8 |
431.9 |
−12.67 |
In the present work, the thermal debinding behavior can be considered a thermal degradation reaction accompanying the cleavages of main and side chains of a gel polymer in an inert atmosphere. To further identify the pyrolysis process and gas products of the DMAA polymer during thermal debinding, the FTIR spectra were recorded as shown in Fig. 3. As shown in Fig. 3(a)and (b), gas products and fragments were observed during the pyrolysis process of the DMAA polymer. The bands at 667 and 2349 cm−1 for CO2 had peaks at approximately 396 °C, which had a main escape temperature range of 350–420 °C. The bands at 650 and 1640 cm−1 for H2O had peaks at approximately 245 and 398 °C, which had two main escape temperature ranges, 200–300 °C and 320–410 °C respectively. The bands at 1533 cm−1 for CH4 had peaks at about 403 °C, which had a main escape temperature range of 320–500 °C. CO2, H2O and CH4 were the main pyrolysis gas products. The evolution of other bands indicated the appearance of weak bands of other gases and fragments during thermal debinding, such as CO, O–H, –CH2, etc. This result indicated that the carbon chains and carbonyl groups were cleaved when the polymer pyrolysis produced a large amount of CO2, H2O, CH4 and small amounts of CO. As shown in Fig. 3b, the first high decomposition represented in DTG curve mainly corresponded to the initial escape of H2O, while the second high decomposition represented in DTG curve mainly corresponded to escape of CO2, CH4, H2O and a very small amount of CO. After 600 °C, there is very little gas evolution, which is consistent with the DTG results.
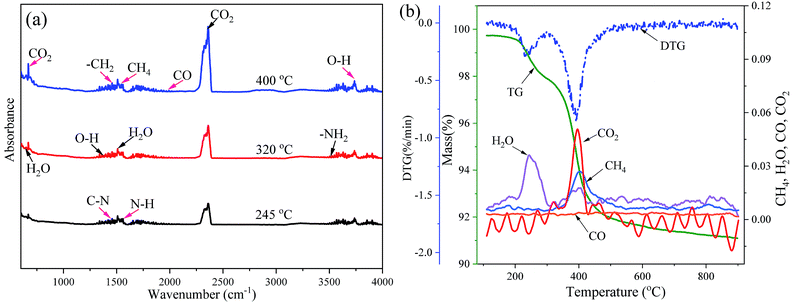 |
| | Fig. 3 Evolution of FTIR bands recorded for the analysis of gas products in DMAA polymer pyrolysis during the debinding process: (a) 2D IR spectra and (b) the main gas products. | |
It is assumed that the pyrolysis of the polymer in the thermal debinding process consists mainly of chemical decomposition and gas evolution. Using the C–R, DAEM and 3-DAEM methods, the nonisothermal TG weight loss data of the SiAlON green body were subjected to kinetic studies.
4.2 Kinetic analysis using the C–R method
The pyrolysis kinetic parameters (activation energy E and pre-exponential factors k0) of the DMAA polymer during debinding were determined by the C–R method. The fitting equations, correlation coefficients, p-values and kinetic parameters obtained by the C–R method at different heating rates and n values are listed in Table 2. As can be seen from Table 2, there are obvious fluctuations in the values of kinetic parameters under different heating rates and n values. For the heating rate of 5 °C min−1, when n = 0.7, the fitting equation is y = −2652.13x − 9.16, which has a maximum correlation coefficient (0.9401) and a minimum p-value (5.33 × 10⁻⁴); for the heating rate of 15 °C min−1, when n = 1.4, the fitting equation is y = −5567.05x − 4.72, which has a maximum correlation coefficient (0.9381) and a minimum p-value of 5.38 × 10⁻⁴; for the heating rate of 20 °C min−1, when n = 1.5, the fitting equation is y = −4728.53x − 5.92, which has a maximum correlation coefficient (0.9512) and a minimum p-value (5.07 × 10⁻⁴). Due to space limitations, only the best linear fitting results using the C–R method at different heating rates are illustrated in Fig. 4. It can be seen from Fig. 4 that the fitting equations are straight lines at different heating rates, and the slopes and intercepts of the three fitting equations are different with the increase in the heating rate. The kinetic parameters of the thermal debinding of the SiAlON green bodies can be obtained by the fitting equations, as listed in Table 2. As the heating rate increases, the dα/dT curves move toward the high-temperature region, and the temperature of the corresponding reaction rate peak gradually increases. The activation energy was 22.05–46.28 kJ mol−1, and the pre-exponential factor was 0.0233–12.40 s−1. At the same time, the activation energy increased with an increase in the pre-exponential factor, indicating that the pyrolysis reaction is sensitive to temperature and kinetics.
Table 2 Debinding kinetic parameters of gelcast SiAlON green parts obtained by the C–R method at different heating rates and n values
| n |
Slope |
Intercept |
R2 |
p-Value |
E (kJ mol−1) |
ln(k0) (s−1) |
| β = 5 °C min−1 |
| 0.1 |
−2049.34 |
−10.38 |
0.9204 |
5.82 × 10⁻⁴ |
17.04 |
−5.24 |
| 0.2 |
−2138.94 |
−10.20 |
0.9265 |
5.67 × 10⁻⁴ |
17.78 |
−5.01 |
| 0.3 |
−2232.67 |
−10.01 |
0.9314 |
5.54 × 10⁻⁴ |
18.56 |
−4.78 |
| 0.4 |
−2330.70 |
−9.81 |
0.9353 |
5.45 × 10⁻⁴ |
19.38 |
−4.54 |
| 0.5 |
−2433.20 |
−9.60 |
0.9380 |
5.38 × 10⁻⁴ |
20.23 |
−4.29 |
| 0.6 |
−2540.30 |
−9.38 |
0.9396 |
5.34 × 10⁻⁴ |
21.12 |
−4.03 |
| 0.7 |
−2652.13 |
−9.16 |
0.9401 |
5.33 × 10⁻⁴ |
22.05 |
−3.76 |
| 0.8 |
−2768.80 |
−8.92 |
0.9395 |
5.34 × 10⁻⁴ |
23.02 |
−3.48 |
| 0.9 |
−2890.37 |
−8.68 |
0.9379 |
5.38 × 10⁻⁴ |
24.03 |
−3.20 |
| 1 |
−3016.91 |
−8.43 |
0.9352 |
5.45 × 10⁻⁴ |
25.08 |
−2.90 |
| 1.1 |
−3148.41 |
−8.17 |
0.9316 |
5.54 × 10⁻⁴ |
26.18 |
−2.60 |
| 1.2 |
−3284.87 |
−7.89 |
0.9271 |
5.65 × 10⁻⁴ |
27.31 |
−2.28 |
| 1.3 |
−3426.24 |
−7.61 |
0.9219 |
5.78 × 10⁻⁴ |
28.49 |
−1.96 |
| 1.4 |
−3572.45 |
−7.32 |
0.9160 |
5.94 × 10⁻⁴ |
29.70 |
−1.63 |
| 1.5 |
−3723.39 |
−7.02 |
0.9095 |
6.12 × 10⁻⁴ |
30.96 |
−1.29 |
| 1.6 |
−3878.93 |
−6.72 |
0.9026 |
6.31 × 10⁻⁴ |
32.25 |
−0.94 |
| 1.7 |
−4038.94 |
−6.40 |
0.8952 |
6.53 × 10⁻⁴ |
33.58 |
−0.58 |
| 1.8 |
−4203.24 |
−6.08 |
0.8877 |
6.76 × 10⁻⁴ |
34.95 |
−0.22 |
![[thin space (1/6-em)]](https://www.rsc.org/images/entities/char_2009.gif) |
| β = 15 °C min−1 |
| 0.1 |
−3221.03 |
−8.90 |
0.8527 |
7.95 × 10⁻⁴ |
26.78 |
−2.20 |
| 0.2 |
−3357.11 |
−8.65 |
0.8646 |
7.52 × 10⁻⁴ |
27.91 |
−1.92 |
| 0.3 |
−3499.81 |
−8.39 |
0.8758 |
7.14 × 10⁻⁴ |
29.10 |
−1.62 |
| 0.4 |
−3649.42 |
−8.12 |
0.8863 |
6.80 × 10⁻⁴ |
30.34 |
−1.31 |
| 0.5 |
−3806.20 |
−7.84 |
0.8958 |
6.51 × 10⁻⁴ |
31.64 |
−0.98 |
| 0.6 |
−3970.40 |
−7.55 |
0.9045 |
6.26 × 10⁻⁴ |
33.01 |
−0.65 |
| 0.7 |
−4142.23 |
−7.24 |
0.9122 |
6.04 × 10⁻⁴ |
34.44 |
−0.30 |
| 0.8 |
−4321.87 |
−6.92 |
0.9190 |
5.86 × 10⁻⁴ |
35.93 |
0.06 |
| 0.9 |
−4509.42 |
−6.59 |
0.9247 |
5.71 × 10⁻⁴ |
37.49 |
0.44 |
| 1 |
−4704.99 |
−6.24 |
0.9294 |
5.59 × 10⁻⁴ |
39.12 |
0.83 |
| 1.1 |
−4908.59 |
−5.88 |
0.9330 |
5.50 × 10⁻⁴ |
40.81 |
1.23 |
| 1.2 |
−5120.19 |
−5.51 |
0.9357 |
5.44 × 10⁻⁴ |
42.57 |
1.65 |
| 1.3 |
−5339.72 |
−5.12 |
0.9373 |
5.40 × 10⁻⁴ |
44.39 |
2.08 |
| 1.4 |
−5567.05 |
−4.72 |
0.9381 |
5.38 × 10⁻⁴ |
46.28 |
2.52 |
| 1.5 |
−5802.00 |
−4.31 |
0.9380 |
5.38 × 10⁻⁴ |
48.24 |
2.97 |
| 1.6 |
−6044.38 |
−3.88 |
0.9371 |
5.40 × 10⁻⁴ |
50.25 |
3.44 |
| 1.7 |
−6293.93 |
−3.44 |
0.9355 |
5.44 × 10⁻⁴ |
52.33 |
3.92 |
| 1.8 |
−6550.39 |
−2.99 |
0.9332 |
5.50 × 10⁻⁴ |
54.46 |
4.41 |
![[thin space (1/6-em)]](https://www.rsc.org/images/entities/char_2009.gif) |
| β = 20 °C min−1 |
| 0.1 |
−2540.19 |
−9.92 |
0.8460 |
8.20 × 10⁻⁴ |
21.12 |
−3.18 |
| 0.2 |
−2655.31 |
−9.70 |
0.8604 |
7.67 × 10⁻⁴ |
22.08 |
−2.92 |
| 0.3 |
−2776.07 |
−9.48 |
0.8740 |
7.20 × 10⁻⁴ |
23.08 |
−2.65 |
| 0.4 |
−2902.72 |
−9.25 |
0.8867 |
6.79 × 10⁻⁴ |
24.13 |
−2.37 |
| 0.5 |
−3035.49 |
−9.00 |
0.8983 |
6.44 × 10⁻⁴ |
25.24 |
−2.08 |
| 0.6 |
−3174.60 |
−8.74 |
0.9088 |
6.14 × 10⁻⁴ |
26.39 |
−1.78 |
| 0.7 |
−3320.21 |
−8.48 |
0.9182 |
5.88 × 10⁻⁴ |
27.60 |
−1.47 |
| 0.8 |
−3472.48 |
−8.20 |
0.9264 |
5.67 × 10⁻⁴ |
28.87 |
−1.14 |
| 0.9 |
−3631.52 |
−7.91 |
0.9334 |
5.49 × 10⁻⁴ |
30.19 |
−0.81 |
| 1 |
−3797.39 |
−7.61 |
0.9393 |
5.35 × 10⁻⁴ |
31.57 |
−0.46 |
| 1.1 |
−3970.12 |
−7.29 |
0.9439 |
5.24 × 10⁻⁴ |
33.01 |
−0.10 |
| 1.2 |
−4149.69 |
−6.97 |
0.9473 |
5.16 × 10⁻⁴ |
34.50 |
0.27 |
| 1.3 |
−4336.03 |
−6.63 |
0.9497 |
5.11 × 10⁻⁴ |
36.05 |
0.65 |
| 1.4 |
−4529.02 |
−6.28 |
0.9509 |
5.08 × 10⁻⁴ |
37.65 |
1.04 |
| 1.5 |
−4728.53 |
−5.92 |
0.9512 |
5.07 × 10⁻⁴ |
39.31 |
1.44 |
| 1.6 |
−4934.36 |
−5.55 |
0.9506 |
5.09 × 10⁻⁴ |
41.02 |
1.86 |
| 1.7 |
−5146.32 |
−5.17 |
0.9492 |
5.12 × 10⁻⁴ |
42.79 |
2.28 |
| 1.8 |
−5364.16 |
−4.77 |
0.9471 |
5.17 × 10⁻⁴ |
44.60 |
2.72 |
 |
| | Fig. 4 The best linear fitting results using the C–R method at different heating rates: (a) 5 °C min−1, (b) 15 °C min−1 and (c) 20 °C min−1. | |
4.3 DAEM kinetics of different stages
The activation energy (E0) and pre-exponential factor (k0) of the whole thermal debinding process are evaluated by the DAEM method. The plot of ln(β/T2) versus 1/T at a conversion rate range from 0.1 to 0.9 is presented in Fig. 5. Table 3 lists the fitted equations, correlation coefficients (R2) and kinetic parameters (E0 and k0). It can be seen from Fig. 5 and Table 3 that the R2 values of most fitting equations are greater than 0.92 at different heating rates, which indicates that it is reasonable and reliable to carry out kinetic studies on the thermal debinding process of gelcast green bodies. Moreover, the values of E0 and k0 are not constant, but they change with the polymer pyrolysis; as the activation energy increases, the pre-exponential factor also increases correspondingly. The value ranges of E0 and k0 are 34.34–188.61 kJ mol−1 and 1.62 × 100 to 5.19 × 10¹¹ s−1, respectively, which also indicates that the pyrolysis process of the DMAA polymer has a complex multistep reaction mechanism during debinding.
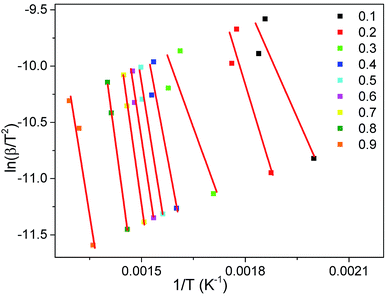 |
| | Fig. 5 Arrhenius plot of ln(β/T2) vs. 1/T at the different conversion rates. | |
Table 3 Debinding kinetic parameters of gelcast SiAlON green parts calculated by the DAEM method
| α |
Slope |
Intercept |
R2 |
E0 (kJ mol−1) |
k0 (s−1) |
| 0.10 |
−6952.37 |
3.10 |
0.88 |
57.80 |
1.40 × 10³ |
| 0.15 |
−10068.45 |
8.37 |
0.95 |
83.71 |
3.94 × 10⁵ |
| 0.20 |
−10129.56 |
8.07 |
0.89 |
84.22 |
2.95 × 10⁵ |
| 0.25 |
−4130.06 |
−3.14 |
0.51 |
34.34 |
1.62 × 100 |
| 0.30 |
−8496.88 |
3.47 |
0.76 |
70.64 |
2.49 × 10³ |
| 0.35 |
−13417.54 |
10.76 |
0.87 |
111.55 |
5.76 × 10⁶ |
| 0.40 |
−16313.21 |
14.88 |
0.92 |
135.63 |
4.29 × 10⁸ |
| 0.45 |
−18210.12 |
17.46 |
0.96 |
151.40 |
6.30 × 10⁹ |
| 0.50 |
−19074.43 |
18.47 |
0.97 |
158.58 |
1.81 × 10¹⁰ |
| 0.55 |
−19876.30 |
19.41 |
0.98 |
165.25 |
4.85 × 10¹⁰ |
| 0.60 |
−20189.15 |
19.64 |
0.98 |
167.85 |
6.19 × 10¹⁰ |
| 0.65 |
−21424.41 |
21.22 |
0.99 |
178.12 |
3.18 × 10¹¹ |
| 0.70 |
−21765.66 |
21.42 |
1.00 |
180.96 |
3.97 × 10¹¹ |
| 0.75 |
−21360.49 |
20.45 |
1.00 |
177.59 |
1.48 × 10¹¹ |
| 0.80 |
−22685.56 |
21.65 |
1.00 |
188.61 |
5.19 × 10¹¹ |
| 0.85 |
−22343.84 |
20.19 |
0.99 |
185.77 |
1.19 × 10¹¹ |
| 0.90 |
−19228.01 |
14.63 |
0.94 |
159.86 |
3.95 × 10⁸ |
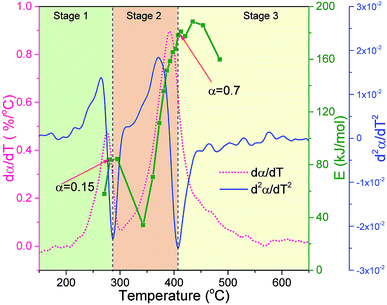
The variations in E0, dα/dT and differential dα/dT (d2α/dT2) with temperature during debinding at a heating rate of 5 °C min−1 are shown in Fig. 6. In this work, the second derivative method to divide the pyrolysis stages of organic matter reported by Chen et al.29 and Grønli et al.37 was adopted to analyze the debinding stages. As shown in Fig. 6, the thermal debinding process can be roughly divided into three stages: stage 1 is in the temperature range of 150–275 °C, stage 2 is in the temperature range of 275–395 °C, and stage 3 is in the temperature range of 395–650 °C. Therefore, it can be assumed that the DMAA polymer consists of three pseudo components that react independently and have different thermal stabilities.29 Stage 1 (low-temperature zone) is assumed to be the pyrolysis stage of pseudo component 1 with a conversion rate of approximately 0.15; stage 2 is the pyrolysis stage of pseudo component 2 with a conversion rate of approximately 0.55; and stage 3 is the pyrolysis stage of pseudo component 3 with a conversion rate of approximately 0.30. According to the relationship between E0 and α, the activation energy increases with an increase in the conversion rate in the low-temperature stage, mainly because in the initial stage of polymer pyrolysis, the destruction of the side or end chains requires a strong intense energy, and a higher activation energy is required at this stage. As the temperature increases, the monomer is rapidly depolymerized by the linkage mechanism, and the chain reactions dominate. Thus, the activation energy decreases correspondingly and reaches a minimum of 34.34 kJ mol−1 at 343 °C. Then, as the conversion rate of the polymer increases, the activation energy shows a basically increasing trend due to the reduction of the depolymerization reaction. The peak of the dα/dT curve is reached at 370 °C with a conversion rate of 0.5 in stage 2. After the conversion rate is greater than 0.8, the activation energy rapidly decreases as the polymer pyrolysis reaction is substantially completed. Therefore, to avoid the debinding too fast and control the gas evolution rate, a three-stage insulation measures should be implemented corresponding to the above three debinding stages.
 |
| | Fig. 6 The variations in E0, dα/dT and d2α/dT2 with temperature during the thermal debinding process at a heating rate of 5 °C min−1. | |
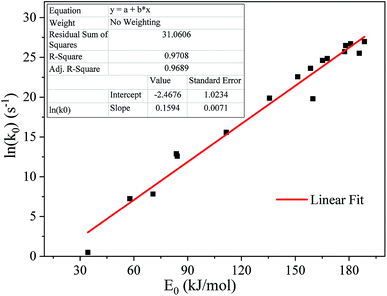
Fig. 7 shows the linear fitting results between E0 and ln(k0), revealing that there is a strong linear relationship between E0 and ln(k0). Most of the data fall on the regression line or are not far away. The linear correlation coefficient R2 > 0.95 indicates that E0 and ln(k0) basically satisfy the kinetic compensation effect.
 |
| | Fig. 7 Kinetic compensation effect for thermal debinding of a SiAlON green body. | |
A method reported by Wang et al.28 was adopted to obtain more reasonable kinetic parameters (E0, k0 and σ). The average value of activation energy for the conversion rate varying from 0.10 to 0.90 was used as the activation energy E0 of the DAEM. The pre-exponential factor (k0) was obtained according to the fitting equation of E0 and ln(k0) shown in Fig. 5 and Table 3. The standard deviation (σ) was determined by a least squares method. As a result, the E0, k0 and σ for the DAEM during the global thermal debinding process were 134.82 kJ mol−1, 4.29 × 10⁸ s−1 and 19.84 kJ mol−1, respectively.
4.4 Kinetic analysis using the 3-DAEM method
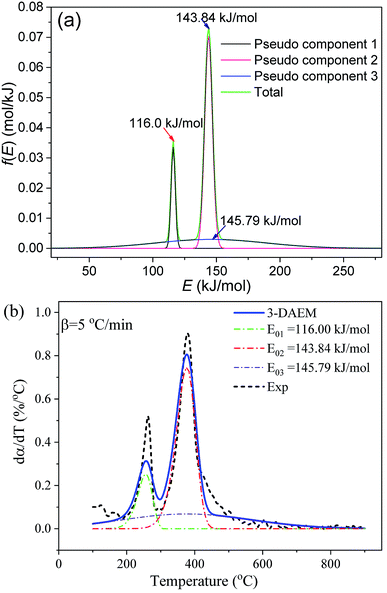
The Gaussian activation energy distribution (f(E)) and reaction rate (dα/dT) curves of the three pseudo components calculated by the 3-DAEM method during the whole thermal debinding process are shown in Fig. 8. The debinding kinetic parameters (E0,i, k0,i and σi) of the three pseudo components are depicted in Table 4. The average values of activation energy for the three pseudo components (E0,1, E0,2 and E0,3) were 116, 143.84, and 145.79 kJ mol−1, respectively. The average values of standard deviation (σ1, σ2 and σ3) were 1.67, 3.06 and 43.25 kJ mol−1, respectively. Therefore, the f(E) for pseudo component 3 had the widest distribution. In contrast, pseudo component 1 presented the narrowest distribution. The estimated mass fractions of the three pseudo components in the DMAA polymer were 0.14, 0.54, and 0.32, respectively. As shown in Fig. 8b, the predicted dα/dT curve of the whole thermal debinding process is a bimodal curve, which is in good agreement with the experimental data; the value of the fitting quality parameter (Fit%) is less than 2.5%, which indicates that the 3-DAEM method can be used as a predictive tool to depict the thermal debinding kinetics of gelcast ceramic green parts.
 |
| | Fig. 8 Gaussian f(E) and dα/dT of the pseudo components calculated by 3-DAEM during the thermal debinding process at a heating rate of 5 °C min−1: (a) f(E) and (b) dα/dT. | |
Table 4 Thermal debinding kinetic parameters of the three pseudo components using 3-DAEM
| DMAA polymer |
ci |
k0 (s−1) |
E0 (kJ mol−1) |
σi (kJ mol−1) |
| Pseudo component 1 |
0.14 |
1.10 × 10⁹ |
116.00 |
1.67 |
| Pseudo component 2 |
0.54 |
1.10 × 10⁹ |
143.84 |
3.06 |
| Pseudo component 3 |
0.32 |
1.10 × 10⁹ |
145.79 |
43.25 |
4.5 Model comparison and validation
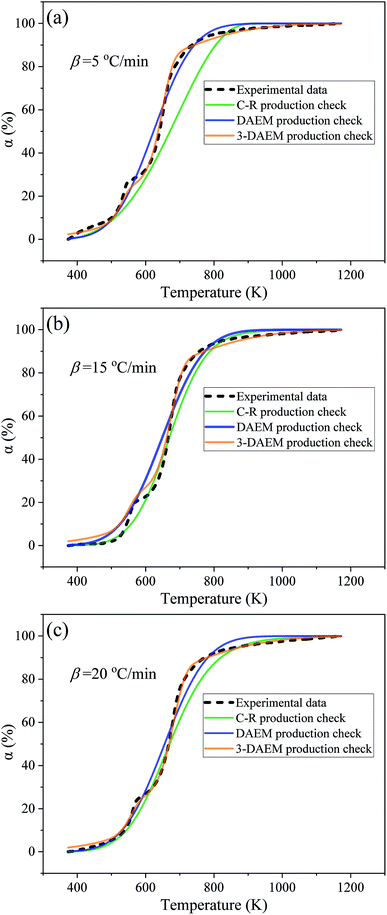
The conversion rate (α) curves at different heating rates obtained using the C–R, DAEM, and 3-DAEM methods were compared with the experimental data, as shown in Fig. 9. It can be seen from Fig. 9(a)–(c) that the conversion curves calculated by the three methods show basically the same trend at different heating rates, but there is a certain difference between them and the experimental data. The fitting quality parameters of the three models at different heating rates are shown in Table 5. As seen in Fig. 9 and Table 5, 3-DAEM has the highest agreement with the experimental results, with a Fit (%) value of less than 2.63%, followed by DAEM with a Fit (%) value of less than 4.52%, and the C–R method has lowest agreement. Fig. 10 shows the comparison of the reaction rate (dα/dT) curves calculated by the three models with different heating rates and with experimental data. It can be seen from Fig. 10 that only the dα/dT curves calculated by the 3-DAEM method showed a trend with a bimodal curve with two distinct pyrolysis peaks, which are in good agreement with the experimental results, while the dα/dT curves calculated by the C–R and DAEM methods presented a unimodal curve, indicating that the 3-DAEM method is a more suitable tool that can truly and effectively describe the thermal debinding kinetics of the gelcast SiAlON green bodies. There is usually a difference between the activation energies obtained by the C–R, DAEM, and 3-DAEM methods. It has been shown that the causes for these differences are due to the data processing methods and model assumptions. In addition, it is found that the activation energy has a large fluctuation as the reaction progresses, indicating that the pyrolysis process of the DMAA polymer in the gelcast ceramic parts has a complex multiple reaction mechanism. Therefore, a single-stage reaction model is inappropriate to accurately describe the entire pyrolysis process of the DMAA polymer. The 3-DAEM method considers the reaction system is a weighting of the independently reactions of three pseudo components and the activation energy of each reaction accords with normal distribution. This multi-peak fitting method is fitted to describe the two pyrolysis peaks in the overall reaction process. Therefore, the kinetic parameters calculated by 3-DAEM method are relatively more reliable.
 |
| | Fig. 9 Comparison between experimental and model calculated conversion rates (α) obtained with the three different models: (a) 5 °C min−1, (b) 15 °C min−1 and (c) 20 °C min−1. | |
Table 5 Comparison of the adaptability of the three kinetic models
| Methods |
Fit (%) |
| 5 °C min−1 |
15 °C min−1 |
20 °C min−1 |
| C–R |
8.87 |
4.18 |
4.63 |
| DAEM |
3.32 |
4.52 |
3.35 |
| 3-DAEM |
1.46 |
2.63 |
1.12 |
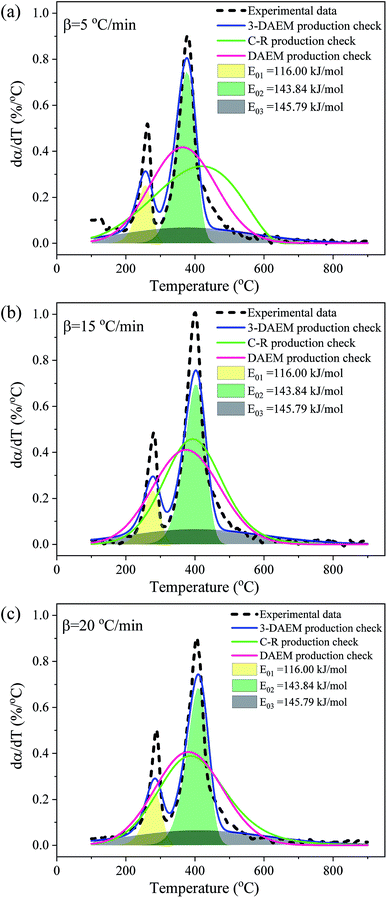 |
| | Fig. 10 Comparison between experimental and model calculated reaction rates (dα/dT) obtained with the three different models: (a) 5 °C min−1, (b) 15 °C min−1 and (c) 20 °C min−1. | |
5 Conclusions
The debinding behavior of a low-toxic DMAA polymer during a thermal debinding process of gelcast SiAlON ceramic parts was investigated through nonisothermal TGA, TG-FTIR analyses and with three different kinetic models (C–R, DAEM and 3-DAEM). The main conclusions were as follows:
(1) Three weight loss zones were observed in the temperature ranges of 100–320 °C (zone 1), 320–520 °C (zone 2) and 520–600 °C (zone 3). The first two zones were typical mass losses caused by polymer pyrolysis, and the pyrolysis reactions in the two zones were endothermic processes; the pyrolysis reactions in zone 3 were exothermic processes. TG-FTIR analysis indicated that gas products and fragments were observed during the pyrolysis of the DMAA polymer, and the main gas products were CO2, H2O and CH4.
(2) The kinetic analysis of the C–R method showed that the activation energy was 22.05–46.28 kJ mol−1, and the pre-exponential factor was 0.0233–12.40 s−1. The correlation coefficients obtained for the fitting equations at different rates were greater than 0.938, and the heating rate had a greater influence than the other tested variables on the kinetic parameters.
(3) DAEM kinetic analysis indicated a complex multistep reaction mechanism for the DMAA/MBAM polymer in the green body. The thermal debinding process can be divided into three stages that correspond to the pyrolysis reactions of different pseudo components. The kinetic parameters (E0, k0 and σ) determined by DAEM were 134.82 kJ mol−1, 4.29 × 10⁸ s−1 and 19.84 kJ mol−1, respectively.
(4) Compared with the C–R and DAEM methods, the 3-DAEM method had the highest agreement with the experimental results, with a Fit (%) value of less than 2.63%. The dα/dT curves calculated by the 3-DAEM method showed a trend of a bimodal curve with two distinct pyrolysis peaks, which was in good agreement with the experimental results. The kinetic parameters (E0,i, k0,i and σi) of the global thermal debinding process estimated by 3-DAEM were 116–145.79 kJ mol−1, 1.149 × 10⁹ s−1 and 1.67–44.10 kJ mol−1, respectively.
Conflicts of interest
The authors declare that they have no conflict of interest.
Acknowledgements
This work is financially supported by the National Natural Science Foundation of China (No. 51574120). We thank Dr Huang for his theoretical guidance in the construction of the kinetic models. We are grateful for the technical assistance and the use of facilities at the Shanghai Yuyi Analytical & Testing Center, China and the Shanghai Buke Analytical & Testing Center, China.
Notes and references
- T. Deng, Y. Wang, A. Dufresne and N. Lin, Carbohydr. Polym., 2018, 181, 111–118 CrossRef CAS.
- P. Jamshidi, N. Lu, G. Liu, E. Herny and M. M. Attallah, Ceram. Int., 2018, 44, 3440–3447 CrossRef CAS.
- J. Yang, J. Yu and Y. Huang, J. Eur. Ceram. Soc., 2011, 31, 2569–2591 CrossRef CAS.
- T. Fey, M. Stumpf, A. Chmielarz, P. Colombo, P. Greil and M. Potoczek, J. Eur. Ceram. Soc., 2018, 38, 3424–3432 CrossRef CAS.
- Q. Yao, L. Zhang, Z. Jiang, G. Huang, T. Zhou, Y. Ben, S. Wei, R. Sun, H. Chen and Y. Wang, Ceram. Int., 2018, 44, 1699–1704 CrossRef CAS.
- F. Wang, J. Yin, K. Zuo, Y. Xia, D. Yao and Y. Zeng, Process. Appl. Ceram., 2016, 10, 227–233 CrossRef CAS.
- S. Yin, L. Pan, L. Guo, Y. Liu, Y. Feng, T. Qiu and J. Yang, Ceram. Int., 2018, 44, 7569–7579 CrossRef CAS.
- P. Bednarek and M. Szafran, J. Therm. Anal. Calorim., 2012, 109, 773–782 CrossRef CAS.
- G. Chen, P. Cao, G. Wen and N. Edmonds, Mater. Chem. Phys., 2013, 139, 557–565 CrossRef CAS.
- L. Liu, N. Loh, B. Tay, S. Tor, Y. Murakoshi and R. Maeda, Mater. Lett., 2007, 61, 809–812 CrossRef CAS.
- S. M. Ani, A. Muchtar, N. Muhamad and J. A. Ghani, Ceram. Int., 2014, 40, 2819–2824 CrossRef.
- W.-W. Yang, K.-Y. Yang, M.-C. Wang and M.-H. Hon, Ceram. Int., 2003, 29, 745–756 CrossRef CAS.
- R. K. Enneti, T. S. Shivashankar, S.-J. Park, R. M. German and S. V. Atre, Powder Technol., 2012, 228, 14–17 CrossRef CAS.
- L. Gorjan, A. Dakskobler and T. Kosmač, J. Am. Ceram. Soc., 2012, 95, 188–193 CrossRef CAS.
- G. Fu, N. Loh, S. Tor, B. Tay, Y. Murakoshi and R. Maeda, Appl. Phys. A: Mater. Sci. Process., 2005, 81, 495–500 CrossRef CAS.
- L. Zhang, L. Zhang, L. Wang, H. Zhou, P. Liu, Z. Li and Y. Huang, Rare Met. Mater. Eng., 2008, 37, 697–701 Search PubMed.
- H.-Y. Yuan, C.-C. Jia, X.-X. Zhang, B. Karima and Z.-L. Wang, Chin. J. Eng., 2016, 38, 102–107 Search PubMed.
- X.-F. Yang, Z.-P. Xie and W. Liu, Trans. Mater. Heat Treat., 2012, 33, 26–30 CAS.
- D. F. Heaney and R. Spina, J. Mater. Process. Technol., 2007, 191, 385–389 CrossRef CAS.
- M. Belgacem, B. Thierry and G. Jean-Claude, Powder Technol., 2013, 235, 192–202 CrossRef CAS.
- M. Salehi, F. Clemens, T. Graule and B. Grobéty, Appl. Energy, 2012, 95, 147–155 CrossRef CAS.
- J. Domínguez, B. del Saz-Orozco, M. Oliet, M. Alonso and F. Rodriguez, J. Compos. Mater., 2017, 51, 125–138 CrossRef.
- X.-G. Liu and B.-Q. Li, J. Fuel Chem. Technol., 2000, 28, 289–293 CAS.
- S. Fang, Z. Yu, X. Ma, Y. Lin, L. Chen and Y. Liao, Energy, 2018, 143, 517–532 CrossRef CAS.
- Y. Lin, Z. Chen, M. Dai, S. Fang, Y. Liao, Z. Yu and X. Ma, Bioresour. Technol., 2018, 259, 173–180 CrossRef CAS.
- K. Pielichowski and K. Flejtuch, J. Anal. Appl. Pyrolysis, 2005, 73, 131–138 CrossRef CAS.
- K. Miura, Energy Fuels, 1995, 9, 302–307 CrossRef CAS.
- J. Wang, W. Lian, P. Li, Z. Zhang, J. Yang, X. Hao, W. Huang and G. Guan, Fuel, 2017, 207, 126–135 CrossRef CAS.
- Z. Chen, M. Hu, X. Zhu, D. Guo, S. Liu, Z. Hu, B. Xiao, J. Wang and M. Laghari, Bioresour. Technol., 2015, 192, 441–450 CrossRef CAS.
- C. Zhang, T. Qiu, J. Yang and J. Guo, Mater. Sci. Eng., A, 2012, 539, 243–249 CrossRef CAS.
- H.-X. Xu, T. Qiu, J. Yang and J. Guo, J. Inorg. Mater., 2011, 26, 1105–1110 CrossRef CAS.
- J. Guo, T. Qiu, J. Yang, Y. Feng, C. Zhang, W. Zhang and T. Guo, Ceram. Int., 2012, 38, 2905–2911 CrossRef CAS.
- Y. Q. Li, T. Qiu and J. Xu, Mater. Res. Bull., 1997, 32, 1173–1179 CrossRef CAS.
- S. Liu, J. Yu, K. Bikane, T. Chen, C. Ma, B. Wang and L. Sun, Energy, 2018, 155, 215–225 CrossRef CAS.
- J. Cai, W. Wu and R. Liu, Bioresour. Technol., 2013, 132, 423–426 CrossRef CAS.
- J. J. M. Órfão, AIChE J., 2007, 53, 2905–2915 CrossRef.
- M. G. Grønli, G. Várhegyi and C. Di Blasi, Ind. Eng. Chem. Res., 2002, 41, 4201–4208 CrossRef.
Footnote |
| † Electronic supplementary information (ESI) available. See DOI: 10.1039/c9ra00305c |
|
| This journal is © The Royal Society of Chemistry 2019 |
Click here to see how this site uses Cookies. View our privacy policy here.  Open Access Article
 *a,
Chuanfu Zhanga,
Ruiming Yinb and
Wenhai Zhangac
![[thin space (1/6-em)]](https://www.rsc.org/images/entities/char_2009.gif) :
:![[thin space (1/6-em)]](https://www.rsc.org/images/entities/char_2009.gif) 1. The premixed solution was adjusted to pH = 11 by adding ammonia water. Then, the premixed solution was mixed with Si3N4, Al2O3, AlN, Y2O3 and Ce2O3 mixture powders (mass ratio of Si3N4
1. The premixed solution was adjusted to pH = 11 by adding ammonia water. Then, the premixed solution was mixed with Si3N4, Al2O3, AlN, Y2O3 and Ce2O3 mixture powders (mass ratio of Si3N4![[thin space (1/6-em)]](https://www.rsc.org/images/entities/char_2009.gif) :
:![[thin space (1/6-em)]](https://www.rsc.org/images/entities/char_2009.gif) Al2O3
Al2O3![[thin space (1/6-em)]](https://www.rsc.org/images/entities/char_2009.gif) :
:![[thin space (1/6-em)]](https://www.rsc.org/images/entities/char_2009.gif) AlN
AlN![[thin space (1/6-em)]](https://www.rsc.org/images/entities/char_2009.gif) :
:![[thin space (1/6-em)]](https://www.rsc.org/images/entities/char_2009.gif) Y2O3
Y2O3![[thin space (1/6-em)]](https://www.rsc.org/images/entities/char_2009.gif) :
:![[thin space (1/6-em)]](https://www.rsc.org/images/entities/char_2009.gif) Ce2O3 of 25
Ce2O3 of 25![[thin space (1/6-em)]](https://www.rsc.org/images/entities/char_2009.gif) :
:![[thin space (1/6-em)]](https://www.rsc.org/images/entities/char_2009.gif) 2.2
2.2![[thin space (1/6-em)]](https://www.rsc.org/images/entities/char_2009.gif) :
:![[thin space (1/6-em)]](https://www.rsc.org/images/entities/char_2009.gif) 3.1
3.1![[thin space (1/6-em)]](https://www.rsc.org/images/entities/char_2009.gif) :
:![[thin space (1/6-em)]](https://www.rsc.org/images/entities/char_2009.gif) 1
1![[thin space (1/6-em)]](https://www.rsc.org/images/entities/char_2009.gif) :
:![[thin space (1/6-em)]](https://www.rsc.org/images/entities/char_2009.gif) 2) with a solid loading of 45 vol%. The suspensions were ball milled for 4 h in a planetary ball grinder (zirconia ball). After adding 1.0 wt% APS and TEMED, the slurry was mixed and degassed for 15 min by vacuum pumping. Afterward, the slurry was cast into a designed plastic mold (80 mm × 80 mm × 20 mm) and then was placed under room temperature for 40 min until sufficient polymerization of the gel system. After drying at 80 °C for 24 h, the gelled green bodies were demolded and dried in a temperature-humidity test chamber under controlled humidity conditions (40 °C, 98% relative humidity) for 24 h and subsequently in a drying oven at 90 °C for 24 h.
2) with a solid loading of 45 vol%. The suspensions were ball milled for 4 h in a planetary ball grinder (zirconia ball). After adding 1.0 wt% APS and TEMED, the slurry was mixed and degassed for 15 min by vacuum pumping. Afterward, the slurry was cast into a designed plastic mold (80 mm × 80 mm × 20 mm) and then was placed under room temperature for 40 min until sufficient polymerization of the gel system. After drying at 80 °C for 24 h, the gelled green bodies were demolded and dried in a temperature-humidity test chamber under controlled humidity conditions (40 °C, 98% relative humidity) for 24 h and subsequently in a drying oven at 90 °C for 24 h.


 in eqn (6) can be approximated as a constant,
 34 therefore, eqn (6) can be further simplified as follows:

 vs. 1/T, and when n ≠ 1, plot
  vs. 1/T. A linear relationship can be obtained by determining a reasonable value of n. Then, the activation energy E and the pre-exponential factor k0 can be obtained according to the slope (−E/R) and the intercept
  of the fitting equations.


![[thin space (1/6-em)]](https://www.rsc.org/images/entities/char_2009.gif)
![[thin space (1/6-em)]](https://www.rsc.org/images/entities/char_2009.gif)


