 Open Access Article
Structural basis for the formation of soy protein nanofibrils†
Leila Josefsson,
Melker Cronhamn,
Malin Ekman,
Hugo Widehammar,
Åsa Emmer and
Christofer Lendel
 *
*
Department of Chemistry, KTH Royal Institute of Technology, Stockholm, Sweden. E-mail: lendel@kth.se
First published on 21st February 2019
Abstract
Amyloid-like protein nanofibrils (PNFs) can assemble from a range of different proteins including disease-associated proteins, functional amyloid proteins and several proteins for which the PNFs are neither related to disease nor function. We here examined the core building blocks of PNFs formed by soy proteins. Fibril formation at pH 2 and 90 °C is coupled to peptide hydrolysis which allows isolation of the PNF-forming peptides and identification of them by mass spectrometry. We found five peptides that constitute the main building blocks in soy PNFs, three of them from the protein β-conglycinin and two from the protein glycinin. The abilities of these peptides to form PNFs were addressed by amyloid prediction software and by PNF formation of the corresponding synthetic peptides. Analysis of the structural context in the native soy proteins revealed two structural motifs for the PNF-forming peptides: (i) so-called β-arches and (ii) helical segments involved in quaternary structure contacts. However, the results suggest that neither the native structural motifs nor the protein of origin defines the morphology of the PNFs formed from soy protein isolate.
Introduction
The ability of proteins to self-assemble into ordered amyloid-like nanofibrils appears to be generic.1 Protein nanofibrils (PNFs) are characterized by their nanoscale dimensions (ca. 5–10 nm wide), their high aspect ratio (up to several micrometers long) and a high degree of β-sheet secondary structure. Investigations of such fibrils traditionally focused on disease-related amyloid (e.g. associated with Alzheimer's or Parkinson's diseases)1 but today the field also covers natural functional amyloid,2,3 engineered nanomaterials4 and food science.5 A variety of different protein sources have been explored for the latter two applications, such as whey,6–8 egg,9 fish waste10 and various legumes.11–16 Depending on protein source and fibrillation conditions, variations in the nanoscale morphology of the fibrils are commonly observed, which have substantial impact on their nanomechanical properties17 as well as the properties of macroscale materials made from the PNFs.18Soy protein is a highly interesting protein source as this is a major crop that to a large extent is used for oil production. This leaves a protein rich side stream that could be valorised in food applications or as materials. The two major protein components of soy protein isolate (SPI), glycinin (11S globulin) and β-conglycinin (7S globulin), have both been found to form amyloid-like PNFs.11,19 The two proteins have a high degree of structural and sequential homology but differ in the quaternary structure. β-Conglycinin is a trimer consisting of three different chains (α, α′ and β), while glycinin is a hexamer built from five different subunits (G1–G5).20,21 The three-dimensional structure of the subunits with two jelly-roll β-barrels and extended α-helical domains is also similar to the architecture of other seed storage proteins (e.g. ref. 22–26). Each glycinin subunit is post-translationally cleaved into an acidic chain and a basic chain that are connected through a disulfide bond.27 Previous studies have reported that all three chains of β-conglycinin can form fibrils and that the differences in fibrillation rates might be due to differences in hydrolysis.28 Tang and Wang found that β-conglycinin forms PNFs more easily than glycinin.19 However, Dong et al. reported that when the acidic and the basic chains of glycinin were separated, the acidic subunit easily formed fibrils, while the basic subunits appeared to inhibit this process.29
Several studies have found that proteins undergo the transition into amyloid-like PNFs when incubated at low pH (typically around 2) and high temperature (70–90 °C).11,13,16,19,30–32 The fact that globular proteins are denatured likely contributes to the fibrillation-promoting effect at these conditions but it has also became evident that acid-induced hydrolysis of the peptide backbone can play a crucial role.8,13,19,33,34 The role of hydrolysis can be understood in the light of that the core structures of PNFs only consist of parts of the full-length protein. Hence, large parts of the protein chain are not critical for forming the amyloid structure; rather it will in many cases lead to structural frustrations and reduce the thermodynamic stability of the PNF state.35 Therefore, the shorter peptides originating from hydrolysis will in general have more favourable free energy for the assembly into PNFs than the full-length polypeptides. A recent study from our lab also suggests that the PNF morphology, and thereby also the nanomechanical properties, can be determined by the hydrolysis process.8 In the present study we explored the PNF-forming peptide segments in soy proteins with the aim to better understand how SPI, and potentially other plant proteins, can be used for production of PNFs with defined morphology for nanomaterial applications.
Materials and methods
Materials
Guanidine hydrochloride (GuHCl, product number G4505), trifluoroacetic acid (TFA, product number T6508), acetonitrile (ACN, product number 34881-M), thioflavin T (ThT, product number T3516) and hydrochloric acid (HCl, product number 30721) were purchased from Sigma Aldrich (product numbers in parenthesis). The matrices for matrix-assisted laser desorption/ionization time of flight (MALDI-TOF) mass spectrometry (MS), i.e. 2,5-dihydroxybensoic acid (DHB, product number 8201346) and α-cyano-4-hydroxycinnamic acid (HCCA, product number 8201344), and the peptide calibration standard (covering mass range: 1000–3200 Da, product number 8206195), were products from Bruker Daltonik. 1,4-Dithiothreitol (DTT, product number 443852A) was purchased from VWR and tris(hydroxymethyl)aminomethane (Tris, product number 37190) was from Serva feinbiochemica. All water was purified with Millipore synergy 185 to 18.2 MΩ cm at 25 °C. The SPI, SUPRO 120 IP, was kindly provided by Solae Belgium N.V.Preparation of PNFs
SPI powder corresponding to a final concentration of 50 mg ml−1 was dispersed in 0.1 M HCl and stirred in a glass beaker for 1 h at room temperature. The dispersion was then dialyzed against 0.01 M HCl (pH 2) using a membrane from Spectrum laboratories with 6–8 kDa molecular weight cut-off for 24 hours at room temperature. The dialysis solution was changed 2 times. The insoluble material was separated by centrifugation at 12![[thin space (1/6-em)]](https://www.rsc.org/images/entities/char_2009.gif) 000 × g (30 min) in 50 ml plastic tubes followed by filtration of the supernatant through a filter with 0.45 μm pore size from VWR. The final protein concentration was 14 mg ml−1, as estimated by dry weight measurements. PNF formation was achieved by incubation of the solution at 90 °C at quiescent conditions. The presence of PNFs was confirmed using ThT fluorescence and atomic force microscopy (AFM). Samples for ThT fluorescence measurements were prepared by mixing 0.2 ml protein solution with 2.4 ml 50 μM ThT solution. Fluorescence was measured on a Varian Cary Eclipse Spectrofluorometer with excitation at 440 nm and emission spectra recorded between 460 and 600 nm. PNFs for circular dichroism (CD) and MS analysis were extensively purified by repeated concentration of the sample in a spin filter with 100 kDa molecular weight cut-off membrane (GE Healthcare) spun at 1500 × g followed by dilution to the initial volume.
000 × g (30 min) in 50 ml plastic tubes followed by filtration of the supernatant through a filter with 0.45 μm pore size from VWR. The final protein concentration was 14 mg ml−1, as estimated by dry weight measurements. PNF formation was achieved by incubation of the solution at 90 °C at quiescent conditions. The presence of PNFs was confirmed using ThT fluorescence and atomic force microscopy (AFM). Samples for ThT fluorescence measurements were prepared by mixing 0.2 ml protein solution with 2.4 ml 50 μM ThT solution. Fluorescence was measured on a Varian Cary Eclipse Spectrofluorometer with excitation at 440 nm and emission spectra recorded between 460 and 600 nm. PNFs for circular dichroism (CD) and MS analysis were extensively purified by repeated concentration of the sample in a spin filter with 100 kDa molecular weight cut-off membrane (GE Healthcare) spun at 1500 × g followed by dilution to the initial volume.
Gel electrophoresis
Samples for sodium dodecyl sulfate polyacrylamide gel electrophoresis (SDS-PAGE) were prepared from ca. 5 μg protein mixed with 2× Laemmli buffer from Bio-Rad (product number 1610737) supplemented with 25 mM DTT. They were incubated at 90 °C for 10 min before loading them on precast Mini-Protean 4–20% gradient gels from Bio-Rad (product number 4568093). The molecular size marker was from Bio-Rad (product number 64060948). SDS-PAGE was carried out using a voltage of 180 V. The gels were stained by AcquaStain from Lubio science (product number LU0010000).Atomic force microscopy
AFM imaging was carried out using a Bruker Dimension FastScan instrument operating in tapping mode. The samples were diluted between 1![[thin space (1/6-em)]](https://www.rsc.org/images/entities/char_2009.gif) :
:![[thin space (1/6-em)]](https://www.rsc.org/images/entities/char_2009.gif) 10 and 1
10 and 1![[thin space (1/6-em)]](https://www.rsc.org/images/entities/char_2009.gif) :
:![[thin space (1/6-em)]](https://www.rsc.org/images/entities/char_2009.gif) 500 in 10 mM HCl, and 25 μl was applied on a freshly cleaved mica surface and dried in air. FastScan A cantilevers from Bruker were used for the experiments and the images were investigated in Nanoscope 1.5 software.
500 in 10 mM HCl, and 25 μl was applied on a freshly cleaved mica surface and dried in air. FastScan A cantilevers from Bruker were used for the experiments and the images were investigated in Nanoscope 1.5 software.
Circular dichroism spectroscopy
Samples were diluted in 10 mM HCl and CD measurements were carried out using a Chirascan instrument from Applied Photophysics equipped with a Peltier temperature control system. The measurements were performed at 25 °C using a cell with 1 mm optical path length. The spectral region was recorded from 190 to 260 nm with a step size of 0.5 nm, a measurement time of 0.5 s per point and a bandwidth of 1 nm. The displayed spectra are averages of 5 individual scans for which the background signal has been subtracted. The amplitude of the spectra for SPI-derived PNFs was corrected for the relative protein concentrations (estimated from the absorption in the wavelength range of the CD spectrum). The spectra of the peptides were not corrected for the concentrations since all measured samples of each peptide contained the same concentration of peptide.Mass spectrometry
Purified PNF samples (vide supra) corresponding to 7 mg starting material were lyophilized and dissolved in 0.1 M Tris HCl buffer (pH 8), with 8 M GuHCl and 0.1 M DTT followed by incubation on a tilting table 30–60 min to disintegrate the PNFs.33 The samples were desalted using Pierce® C18 Tips (100 μl) from Thermo Scientific according to the manufacturers protocol.The matrices used for MALDI-TOF analysis, DHB and HCCA, were prepared according to Bruker MALDI sample preparation guide. Briefly, 20 mg ml−1 DHB was dissolved in 30![[thin space (1/6-em)]](https://www.rsc.org/images/entities/char_2009.gif) :
:![[thin space (1/6-em)]](https://www.rsc.org/images/entities/char_2009.gif) 70 (v/v) ACN
70 (v/v) ACN![[thin space (1/6-em)]](https://www.rsc.org/images/entities/char_2009.gif) :
:![[thin space (1/6-em)]](https://www.rsc.org/images/entities/char_2009.gif) 0.1% TFA (TA30), whereas HCCA was added to a TA30 solution until a complete saturated solution was achieved. The desalted samples were mixed with either DHB or HCCA in a ratio of 1
0.1% TFA (TA30), whereas HCCA was added to a TA30 solution until a complete saturated solution was achieved. The desalted samples were mixed with either DHB or HCCA in a ratio of 1![[thin space (1/6-em)]](https://www.rsc.org/images/entities/char_2009.gif) :
:![[thin space (1/6-em)]](https://www.rsc.org/images/entities/char_2009.gif) 1, and 1 μl of the mixtures was deposited onto a MTP 384 polished steel plate (Bruker Daltonik), with 5 replicated spots for each sample. The spots were dried at room temperature and ambient pressure. The MALDI-TOF analyses were performed using an ultrafleXtreme MALDI TOF/TOF with a smartbeam-II™ laser operating at a wavelength of 355 nm (Bruker Daltonik), controlled by FlexControl software (Bruker Daltonik). The samples were analysed in positive mode using a method where the mass to charge (m/z) ranged from 450 to 4500 with a matrix suppression activated at 600 Da. The acceleration potential was set to +25 kV, with pulsed ion extraction at 160 ns. The method was calibrated using the monoisotopic masses in Bruker peptide calibration I, and the method was recalibrated every other sample spot. The MALDI-TOF spectra were the results of 500 laser shots collected to a total of 10
1, and 1 μl of the mixtures was deposited onto a MTP 384 polished steel plate (Bruker Daltonik), with 5 replicated spots for each sample. The spots were dried at room temperature and ambient pressure. The MALDI-TOF analyses were performed using an ultrafleXtreme MALDI TOF/TOF with a smartbeam-II™ laser operating at a wavelength of 355 nm (Bruker Daltonik), controlled by FlexControl software (Bruker Daltonik). The samples were analysed in positive mode using a method where the mass to charge (m/z) ranged from 450 to 4500 with a matrix suppression activated at 600 Da. The acceleration potential was set to +25 kV, with pulsed ion extraction at 160 ns. The method was calibrated using the monoisotopic masses in Bruker peptide calibration I, and the method was recalibrated every other sample spot. The MALDI-TOF spectra were the results of 500 laser shots collected to a total of 10![[thin space (1/6-em)]](https://www.rsc.org/images/entities/char_2009.gif) 000 laser shots. For HCCA matrix random walk was utilized covering the whole sample spot (2000 μm), while for DHB matrix the spectra were collected when a ‘hotspot’ was found. Analysis of the spectra was performed with FlexAnalysis software (Bruker Daltonik) and the spectra were processed using the SNAP peak detection algorithm with a signal-to-noise (S/N) threshold of 2.
000 laser shots. For HCCA matrix random walk was utilized covering the whole sample spot (2000 μm), while for DHB matrix the spectra were collected when a ‘hotspot’ was found. Analysis of the spectra was performed with FlexAnalysis software (Bruker Daltonik) and the spectra were processed using the SNAP peak detection algorithm with a signal-to-noise (S/N) threshold of 2.
For MS/MS analysis the parent ions were chosen based on the intensity, S/N, and the m/z value, and the peaks with intensities > 5000 and m/z > 1200 were selected. The spectra for the daughter ions were collected with 2000 laser shots collected to a total of 20![[thin space (1/6-em)]](https://www.rsc.org/images/entities/char_2009.gif) 000 laser shots. The database searches were performed using BioTools software (Bruker Daltonik) and the MASCOT function, with SwissProt selected as the sole database, and the taxonomy chosen to other green plants, with no selected modifications on the peptides, the MS tolerance was set to 0.5 Da, while the MS/MS tolerance was set to 1 Da, and MALDI-TOF-PSD was chosen as the instrumentation (no collision gas present in the cell).
000 laser shots. The database searches were performed using BioTools software (Bruker Daltonik) and the MASCOT function, with SwissProt selected as the sole database, and the taxonomy chosen to other green plants, with no selected modifications on the peptides, the MS tolerance was set to 0.5 Da, while the MS/MS tolerance was set to 1 Da, and MALDI-TOF-PSD was chosen as the instrumentation (no collision gas present in the cell).
Fibrillation of synthetic peptides
Synthetic peptides with ≥95% purity were purchased from AlexoTech AB (Umeå, Sweden). The molecular weights of the peptides were verified using MS by the supplier. The peptides were dispersed in 10 mM HCl and insoluble material was removed by centrifugation (12000 × g for 15 min). The solubilities were estimated using dry weight measurements and absorbance at 280 nm (the latter only when the peptides contained tyrosine or tryptophan residues). Fibril formation was investigated by incubation at 50 °C for up to 2 days with or without agitation. Agitation at 500 rpm was achieved by a ThermoMixer C (Eppendorf). The lower temperature for these experiments compared to the fibrillation of SPI was chosen to avoid hydrolysis of the peptides. The presence of nanofibrils was assayed by ThT fluorescence and AFM. Samples for ThT were prepared by mixing 20 μl of the protein solution with 200 μl 50 μM ThT solution. Fluorescence was measured on a Varian Cary Eclipse Spectrofluorometer with excitation at 440 nm and emission spectra recorded between 460 and 600 nm. AFM was performed as described above. The peptide samples (only with agitation) were also investigated by CD, using the same instrument and protocol as described above.Results and discussion
PNF formation from SPI
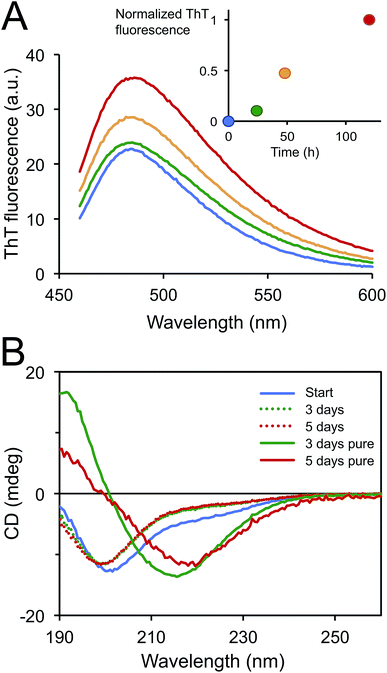
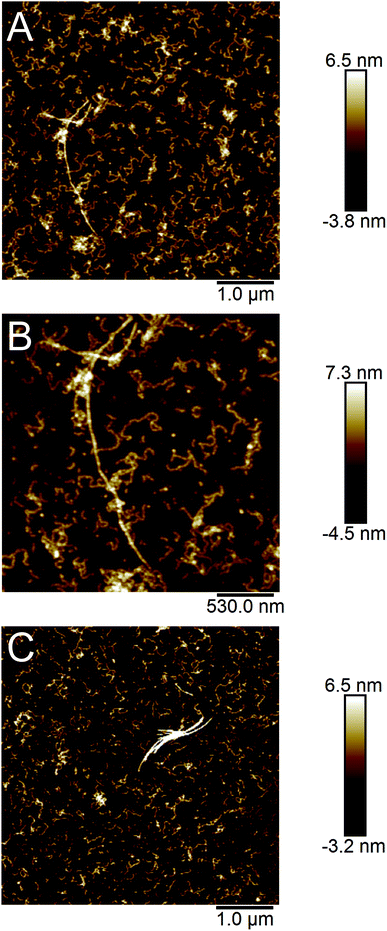
PNFs were prepared by incubation of extracted soluble proteins from SPI at pH 2 and 90 °C. The total protein concentration was 14 mg ml−1 (estimated by dry weight analysis). During the incubation the proteins were hydrolysed, which was confirmed by SDS-PAGE analysis and a progressive increase of the pH of the sample (Fig. S1†). The formation of nanofibrils was monitored by the fluorescence of the amyloidophilic dye ThT (Fig. 1A). The ThT fluorescence intensity displayed an increasing trend during 5 days indicating a rather slow fibrillation process. The samples were also investigated by CD to monitor the change in secondary structure (Fig. 1B). The CD spectrum of the starting sample indicated a high degree of disordered structure (minimum around 200 nm) with some contribution of ordered secondary structure (region 210–230 nm). Upon incubation at 90 °C, the amount of ordered structure decreases, which is in agreement with hydrolysis of the polypeptide chain. No differences are observed between the samples taken after 3 and 5 days incubation, respectively. After purification of the PNFs using a 100 kDa cut-off filter, the CD spectra show a high content of β-sheet structure, as indicated by the minimum between 215 and 220 nm. The minimum occurs at a slightly longer wavelength for the 5 days sample compared to the 3 days sample, suggesting that some structural maturation is taking place between these time points.AFM images of the samples showed that the majority of the PNFs are rather short (typically between 0.1 and 0.5 μm) and highly curved (Fig. 2), similar to fibrils reported for the whey protein β-lactoglobulin under certain conditions8,36,37 as well as other proteins.13,34,38,39 However, a few longer (>1 μm) and more straight fibrils could also be observed. Previous studies suggest that glycinin, and in particular the acidic subunit, forms long, straight fibrils11,29 while PNFs from β-conglycinin appear to be more curved.19,28,40
Identification of the PNF-forming peptides by mass spectrometry
MALDI-TOF was used to identify the peptide building blocks of the formed PNFs after rigorous purification and disaggregation. To have a complete understanding of the sample, all samples were allowed to crystallize with either HCCA or DHB matrices. The intensity and distribution of the peaks varied between the two matrices (Fig. S2†), which is expected because of different desorption/ionization characteristics towards the same peptides.41 For DHB, peptides with higher mass (>2000 Da) were more intense by nearly a factor of 10 compared to when HCCA was used, which might be due to the different collection methods of the spectra (see Material and methods). The samples incubated for 5 days showed a trend of giving more intense peaks in the region of m/z 1000–2000 for both of the matrices compared to samples incubated for 3 days only (Fig. S2†). This is in agreement with more extensive hydrolysis at the longer incubation time.In order to characterize the PNF-forming peptides of the SPI fibrils a top-down approach was used and the peaks with the highest S/N and m/z > 1200 in the MS spectra were chosen as parent ions (Table S1†). The MASCOT search of the combined MS and MS/MS spectra (Fig. 3) for the peptide samples incubated for 3 days when using HCCA as the matrix resulted in a hit for the segment ADFLLFVLSGRAILTLVNND (hereafter referred to as BB1) from β-conglycinin, β-chain (UniProt, P25974, position 92–111) for the peaks 2005.16 and 2191.22 m/z, with a protein score at 71 (where above 36 is significant). However, there seems to be a correlation between the peaks of m/z 1662.04, 1777.07, 1848.11, 1891.11, 1963.14, 2005.16, 2077.19, and 2191.22, which corresponds to the amino acid sequence DADN or NNW (with a mass tolerance of ±0.5 Da, Fig. S3†). Indeed, peptides with slightly different lengths are expected as a result of the non-specific hydrolysis of the SPI sample.
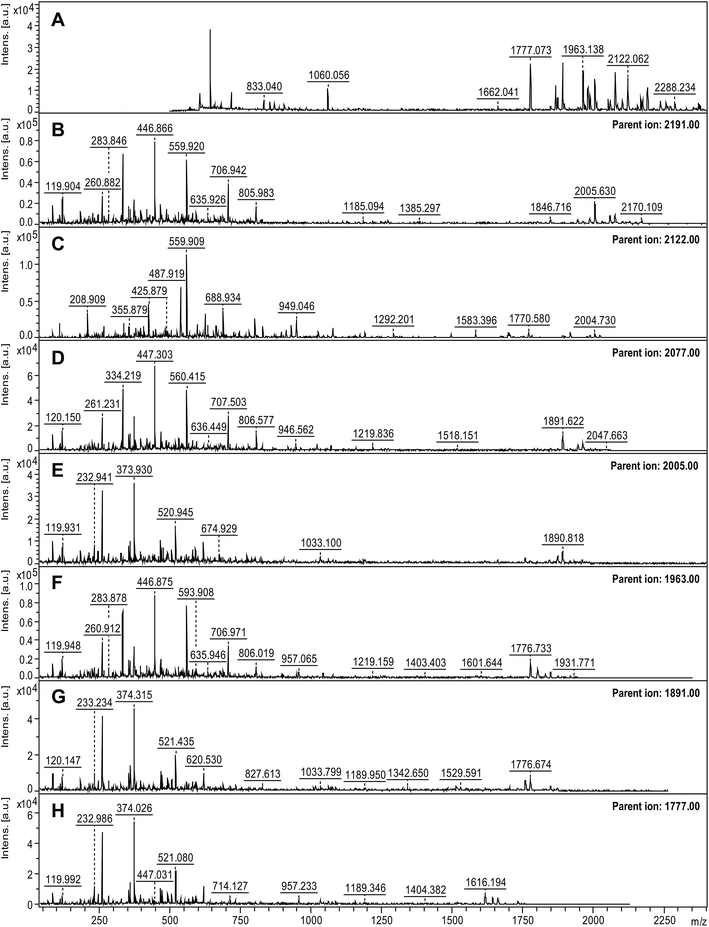 | ||
| Fig. 3 Mass spectra of disaggregated soy PNFs prepared by 3 days incubation. (A) Mass spectrum obtained with HCCA matrix. (B–H) MS/MS analysis of the parent ions. | ||
For the peptide samples in DHB matrix, a MASCOT search based on the combined MS and MS/MS data (Fig. S4†) matched the peaks m/z 1896.85 and 2010.86 with the sequence (GG)SILSGFTLEFLEHAFSV in glycinin G1 (UniProt, P04776, the shorter fragment without the two glycines called GG2 hereafter) with a score of 74 (a value above 48 is significant). Additionally, the peak of m/z 2256.97 was matched to the amino acid sequence of LDIFLSIVDMNEGALLLPHF in β-conglycinin, α chain (UniProt, P13916, called BA1 hereafter) with a score of 72.
Another interesting peak from the analyses, which did not provide a hit in the database search, was the peak at m/z 2971. The corresponding MS/MS spectrum could manually be matched with the 10 amino acid sequence AWWMYNNEDT (Fig. 4), which can be found in glycinin G1 or G2 (UniProt, P04776 and P04405, respectively) as part of the 2971 Da segment GVAWWMYNNEDTPVVAVSIIDTNSLE at position 147–172 or 144–169, respectively (hereafter referred to as GG1).
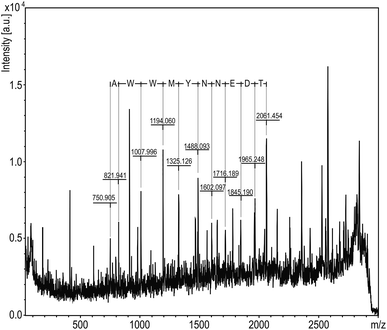 | ||
| Fig. 4 MS/MS spectrum for m/z 2971 parent ion using DHB as matrix. The amino acid sequence AWWMYNNEDT marked at the top of the peaks using FlexAnalysis software. | ||
One of the most intense peaks in the mass spectrum was the one at m/z 2122. Since the MASCOT searches did not suggest any significant hits for this peak, the ExPASy Findpept search algorithm42,43 was used. This way, two potential peptide segments were identified in the β-chain of β-conglycinin: LSSTQAQQSYLQGFSHNIL in position 163–181 or LQGFSHNILETSFHSEFE in position 173–190. These two segments overlap and are hereafter referred to as BB2a and b, respectively. The whole sequence 163–190 is referred to as BB2.
Taken together, we could identify five different peptides that constitute the building blocks of PNFs from SPI. The MS analysis could not reveal if the different peptides were all part of the same fibrils or not. However, it seems more likely that the peptides represent different classes of fibrils, in particular since they originate from different proteins. It should also be noted that not all the peaks in the mass spectra could be assigned, suggesting that there could still be other components of the PNFs.
Structural properties of the PNF-forming segments
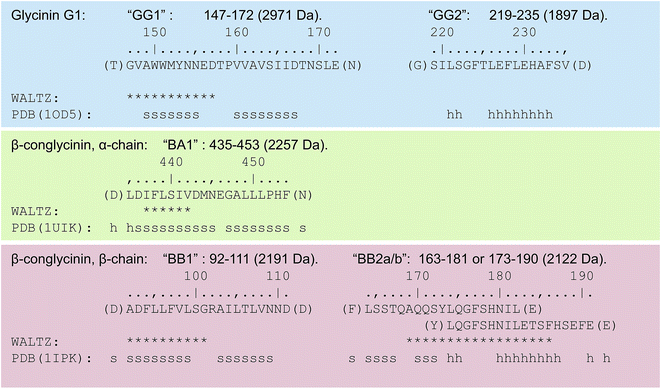
The identified peptide segments were analysed with respect to the structural characteristics in the native proteins and the predicted propensity to form amyloid-like structures (Fig. 5). The amyloid propensity was predicted using the WALTZ algorithm,44 which allows prediction specifically at low pH (Fig. 5). WALTZ finds regions with significant amyloid propensity in all segments except segment GG2. This supports the results of the MS analysis but does not prove the ability of these segments to form PNFs. Many other amyloidogenic segments were indeed predicted in the proteins but could not be validated by MS. The secondary structures of the corresponding segments in the native protein structures indicate that three of the segments have high β-sheet content while the other two contain only α-helical structure or a mixture of sheet and helix. A native β-sheet structure is likely to facilitate the formation of cross-β fibrils. The finding that two of the peptides have substantial helical structure in the native protein is, however, intriguing.The 3D structures of the proteins from which the PNF-forming peptides originated, i.e. glycinin, and the α- and β-chains of β-conglycinin, are highly homologous (Fig. 6A). It is therefore possible to map the structural elements corresponding to the PNF-forming peptides onto one structure in order to compare their original positions in the native structure (Fig. 6B). The three peptides with high content of β-sheet structure all map to “β-arch” motifs.45 It is easy to see how such segments could form amyloid-like fibrils when released by hydrolysis, and this type of structures has indeed been explored as predictive of amyloidogenic segments in proteins.46 The scores found by the ArchCandy algorithm for the three β-arch segments are 0.345 (GG1), 0.644 (BB1) and 0.323 (BA1), which are all low-medium scores. Notably, all three proteins contain regions that are predicted to have higher ArchCandy scores (Fig. S5†). However, ArchCandy cannot predict anti-parallel fibrils or structures that are not based on β-archs. Although the three peptides originating from this structural motif (GG1, BB1 and BA1) come from different parts of the protein structures, all correspond to strands in the middle of the β-sheets. This may be related to an evolutionary pressure to avoid intermolecular interactions and self-assembly in edge strands.47
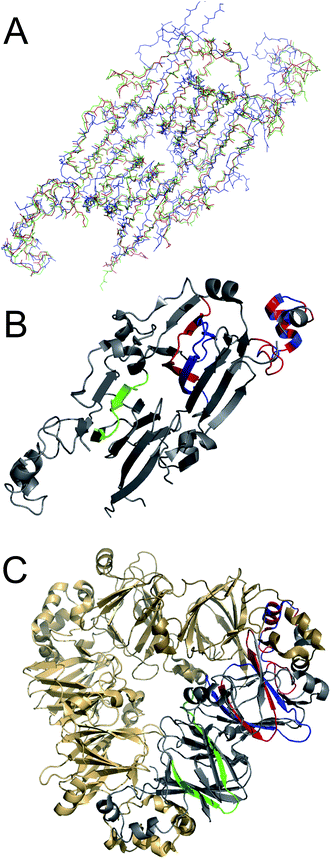 | ||
| Fig. 6 (A) Overlay of backbone traces for the 3D structures of glycinin G1 (blue, PDB ID: 1OD5), β-conglycinin α chain (green, PDB ID: 1UIK) and β-conglycinin β chain (red, PDB ID: 1IPK). (B) The identified PNF forming segments shown in the same structure (1IPK). The colours correspond to the different proteins of origin with glycinin G1 in blue, β-conglycinin β chain in red and β-conglycinin α chain in green. (C) Illustration of the position of the subunits in the multimeric native proteins. Here illustrated with β-conglycinin (1IPK). | ||
Interestingly, the two PNF-forming peptides with α-helical content (GG2 and BB2) correspond to the same part of the native protein structure (Fig. 6B). This part is involved in the interdomain-interactions in the trimeric structures of the proteins (Fig. 6C). Hence, one can speculate that the driving force for the fibril formation of this region is more related to the intrinsic ability of intermolecular interactions while for the three β-sheet rich peptides it is related to the structural propensity. It is also tempting to speculate about a potential cooperative mechanism where both the β-arch and α-helical segments are involved in the fibril formation while still connected by the polypeptides chain. The linkages between these regions are around 50 amino acid residues in glycinin and β-conglycinin.
Fibril formation of the peptide segments
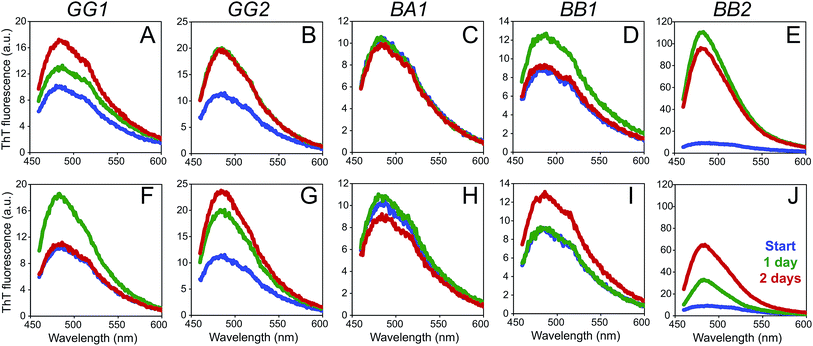
The five identified peptides were synthesized using solid phase peptide synthesis. Since there were two possibilities for BB2 (a and b) we decided to synthesize the whole BB2 sequence to ensure that the PNF-forming segment was included. The abilities of the peptides to form nanofibrils were investigated at pH 2 and 50 °C with and without agitation. Notably, compared to the other peptides, BB2 was significantly more soluble than the other two peptides, and could easily be dissolved at 1.3 g l−1 in 10 mM HCl. The solubilities of the other peptides were estimated to 0.1 g l−1 (GG1), 0.2 g l−1 (GG2), 0.05 g l−1 (BA1) and 0.2 g l−1 (BB1).Fibrillation was monitored using ThT fluorescence and AFM (Fig. 7 and 8). All peptides displayed increased intensity of the ThT fluorescence after incubation at 50 °C (with or without agitation) for 1–2 days (Fig. 7), which is indicative of the formation of amyloid-like structures. In some cases the increase in fluorescence intensity was moderate (e.g. BA1, and BB1) while substantial increases were observed for the BB2 peptide. However, quantitative comparison between the different peptide samples is difficult because of their variations in peptide concentration and limited knowledge about the ThT affinity of the formed aggregates.
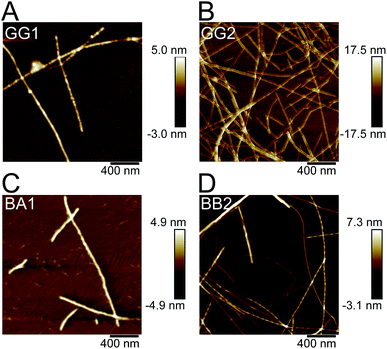 | ||
| Fig. 8 Representative AFM images of fibrils formed by the peptides. (A) GG1, (B) GG2, (C) BA1 and (D) BB2. | ||
AFM investigations of the fibrillated samples revealed the presence of long and relatively straight PNFs for all the peptides, except BB1 (Fig. 8 and S6–S8†). In the BB1 sample incubated with agitation, on the other hand, particulate-like structures48 with heights of up to 50 nm were observed. In the BB1 sample from quiescent conditions only one short fibril-like fragment was found (Fig. S6†).
Changes in the secondary structures of the peptides during incubation with agitation were investigated using CD (Fig. S9†). Notably, the structures of the peptides are not necessarily the same as in the native proteins since most of the tertiary context is missing. The results differ significantly between the peptides. Interestingly, the BB1 peptide started from a predominantly disordered conformation and did not show any structural transition during the incubation. This is in agreement with the absence of fibrils in the AFM analysis of the samples. The GG2 displayed a CD spectrum with some α-helical features in the initial sample, which changed into more typical β-sheet spectrum after incubation. The other three peptides (GG1, BA1, BB2) displayed obvious alterations in the CD spectra upon incubation but the structural interpretation of these changes is not straightforward. Attempts to quantify the secondary structure contents resulted in poor curve fitting and unreliable results (Table S2†) for most spectra. Notably, structural decomposition algorithms for CD spectra are in general developed for full-length proteins and may have lower accuracy for short peptides.
The results confirm that four of the identified peptide segments are able to form PNFs. This ability does not seem to be related to the nature of their secondary structure in the native proteins as both peptides with α-helical content (GG2 and BB2), and β-sheet structure (GG1 and BA1) formed PNFs. On the other hand, the BB1 peptide with native β-sheet structure did not show the same ability to form PNFs. Interestingly, the two peptides that resulted in the largest increases in ThT fluorescence (BB2 and GG2) both originate from helical segments. The outcome of the experiments is likely related to both the structural propensities of the peptides and their solubility. However, it is obvious that the fibrillation processes are also affected by regions outside the identified core segments as we did not observe any short, curved fibrils similar to those that were the main product from the fibrillation of SPI (Fig. 2). This suggests that the PNF morphology (curved vs. straight) is neither determined to the protein of origin (glycinin or β-conglycinin) nor the native secondary structure of the segment. More likely, it is related to the length and the physicochemical properties of the peptide segments as suggested for whey PNFs in our previous work.8
Conclusions
In the presented work we analysed the peptide building blocks of soy PNFs prepared from SPI raw material. We can confirm previous findings that hydrolysis of the polypeptide chains occur simultaneously as fibril formation. Using MALDI-TOF MS, we were able to identify five different peptides that are present in the PNFs. The peptides originate from both major seed storage proteins from soy, glycinin and β-conglycinin, and we were in four cases able to confirm the ability of corresponding synthetic peptides to form PNFs. The identified PNF-forming segments originate from two types of structural motifs in the native proteins, showing that fibril formation can proceed through different molecular pathways. Moreover, despite the same amino acid sequences in the synthetic peptides and the PNF-forming segments from SPI, the morphologies of the formed PNFs are different. We propose that the peptide length may be a stronger determinant of fibril morphology than the specific sequences forming the β-sheet core of the fibrils. Our findings suggest that there are several parallel fibrillation pathways present for the mixture of proteins in SPI. The resulting PNFs and their nanoscale characteristics are the outcome of a complex process that may be related to both protein unfolding and hydrolysis. Given the structural similarity between the involved proteins, cross-reactivity and synergistic effects could also be of importance. The structural homology with other seed storage proteins suggests that the findings may be relevant also for the formation of PNFs from other plant protein resources.Conflicts of interest
There are no conflicts of interest to declare.Acknowledgements
We thank Niclas Solin for kindly sharing the SPI and Matthew Fielden for assistance with AFM measurements. The work was supported by Formas (grant no. 213-2014-1389 to C. L.).References
- F. Chiti and C. M. Dobson, Annu. Rev. Biochem., 2006, 75, 333–366 CrossRef CAS PubMed.
- D. Otzen, Prion, 2010, 4, 256–264 CrossRef CAS PubMed.
- D. M. Fowler, A. V. Koulov, C. Alory-Jost, M. S. Marks, W. E. Balch and J. W. Kelly, PLoS Biol., 2006, 4, e6 CrossRef PubMed.
- T. P. Knowles and R. Mezzenga, Adv. Mater., 2016, 28, 6546–6561 CrossRef CAS PubMed.
- A. Kroes-Nijboer, P. Venema and E. van der Linden, Food Funct., 2012, 3, 221–227 RSC.
- S. M. Loveday, S. G. Anema and H. Singh, Int. Dairy J., 2017, 67, 35–45 CrossRef CAS.
- C. Veerman, H. Ruis, L. M. C. Sagis and E. van der Linden, Biomacromolecules, 2002, 3, 869–873 CrossRef CAS PubMed.
- X. Ye, M. S. Hedenqvist, M. Langton and C. Lendel, RSC Adv., 2018, 13, 6915–6924 RSC.
- M. R. Krebs, D. K. Wilkins, E. W. Chung, M. C. Pitkeathly, A. K. Chamberlain, J. Zurdo, C. V. Robinson and C. M. Dobson, J. Mol. Biol., 2000, 300, 541–549 CrossRef CAS PubMed.
- J. Healy, K. Wong, E. B. Sawyer, C. Roux, L. Domigan, S. L. Gras, M. Sunde, N. G. Larsen, J. Gerrard and M. Vasudevamurthy, Biopolymers, 2012, 97, 595–606 CrossRef CAS PubMed.
- C. Akkermans, A. J. Van der Goot, P. Venema, H. Gruppen, J. M. Vereijken, E. Van der Linden and R. M. Boom, J. Agric. Food Chem., 2007, 55, 9877–9882 CrossRef CAS PubMed.
- S. A. Bhat and B. Bano, Arch. Biochem. Biophys., 2014, 562, 51–61 CrossRef CAS PubMed.
- J. Liu and C. H. Tang, Food Res. Int., 2013, 51, 621–632 CrossRef CAS.
- C. D. Munialo, A. H. Martin, E. van der Linden and H. H. J. de Jongh, J. Agric. Food Chem., 2014, 62, 2418–2427 CrossRef CAS PubMed.
- V. Vetri, C. Canale, A. Relini, F. Librizzi, V. Militello, A. Gliozzi and M. Leone, Biophys. Chem., 2007, 125, 184–190 CrossRef CAS PubMed.
- C.-H. Tang, Y.-H. Zhang, Q.-B. Wen and Q. Huang, J. Agric. Food Chem., 2010, 58, 8061–8068 CrossRef CAS PubMed.
- T. P. Knowles, A. W. Fitzpatrick, S. Meehan, H. R. Mott, M. Vendruscolo, C. M. Dobson and M. E. Welland, Science, 2007, 318, 1900–1903 CrossRef CAS PubMed.
- A. Kamada, N. Mittal, L. D. Söderberg, T. Ingverud, W. Ohm, S. V. Roth, F. Lundell and C. Lendel, Proc. Natl. Acad. Sci. U. S. A., 2017, 114, 1232–1237 CrossRef CAS PubMed.
- C. H. Tang and C. S. Wang, J. Agric. Food Chem., 2010, 58, 11058–11066 CrossRef CAS PubMed.
- M. Adachi, J. Kanamori, T. Masuda, K. Yagasaki, K. Kitamura, B. Mikami and S. Utsumi, Proc. Natl. Acad. Sci. U. S. A., 2003, 100, 7395–7400 CrossRef CAS PubMed.
- M. Adachi, Y. Takenaka, A. B. Gidamis, B. Mikami and S. Utsumi, J. Mol. Biol., 2001, 305, 291–305 CrossRef CAS PubMed.
- T. Itoh, R. N. Garcia, M. Adachi, Y. Maruyama, E. M. Tecson-Mendoza, B. Mikami and S. Utsumi, Acta Crystallogr., Sect. D: Biol. Crystallogr., 2006, 62, 824–832 CrossRef PubMed.
- T. C. Jin, C. Wang, C. Y. Zhang, Y. Wang, Y. W. Chen, F. Guo, A. Howard, M. J. Cao, T. J. Fu, T. H. McHugh and Y. Z. Zhang, J. Agric. Food Chem., 2017, 65, 7560–7568 CrossRef CAS PubMed.
- M. C. Lawrence, E. Suzuki, J. N. Varghese, P. C. Davis, A. Van Donkelaar, P. A. Tulloch and P. M. Colman, EMBO J., 1990, 9, 9–15 CrossRef CAS PubMed.
- M. R. G. Tandang-Silvas, T. Fukuda, C. Fukuda, K. Prak, C. Cabanos, A. Kimura, T. Itoh, B. Mikami, S. Utsumi and N. Maruyama, BBA, Biochim. Biophys. Acta, Proteins Proteomics, 2010, 1804, 1432–1442 CrossRef CAS PubMed.
- E. J. Woo, J. M. Dunwell, P. W. Goodenough, A. C. Marvier and R. W. Pickersgill, Nat. Struct. Biol., 2000, 7, 1036–1040 CrossRef CAS PubMed.
- P. E. Staswick, M. A. Hermodson and N. C. Nielsen, J. Biol. Chem., 1984, 259, 13431–13435 CAS.
- J. M. Wang, X. Q. Yang, S. W. Yin, D. B. Yuan, N. Xia and J. R. Qi, J. Agric. Food Chem., 2011, 59, 11270–11277 CrossRef CAS PubMed.
- S. R. Dong, H. H. Xu, B. Y. Li, W. Cheng and L. G. Zhang, J. Cereal Sci., 2016, 70, 263–269 CrossRef CAS.
- G. M. Kavanagh, A. H. Clark and S. B. Ross-Murphy, Int. J. Biol. Macromol., 2000, 28, 41–50 CrossRef CAS PubMed.
- K. Pan and Q. X. Zhong, Soft Matter, 2015, 11, 5898–5904 RSC.
- J. Z. Zhou, H. Zhang, H. Y. Yang, L. Wang and H. F. Qian, J. Sci. Food Agric., 2014, 94, 2009–2015 CrossRef CAS PubMed.
- C. Akkermans, P. Venema, A. J. van der Goot, H. Gruppen, E. J. Bakx, R. M. Boom and E. van der Linden, Biomacromolecules, 2008, 9, 1474–1479 CrossRef CAS PubMed.
- C. Lara, S. Gourdin-Bertin, J. Adamcik, S. Bolisetty and R. Mezzenga, Biomacromolecules, 2012, 13, 4213–4221 CrossRef CAS PubMed.
- A. J. Baldwin, T. P. Knowles, G. G. Tartaglia, A. W. Fitzpatrick, G. L. Devlin, S. L. Shammas, C. A. Waudby, M. F. Mossuto, S. Meehan, S. L. Gras, J. Christodoulou, S. J. Anthony-Cahill, P. D. Barker, M. Vendruscolo and C. M. Dobson, J. Am. Chem. Soc., 2011, 133, 14160–14163 CrossRef CAS PubMed.
- S. M. Loveday, X. L. Wang, M. A. Rao, S. G. Anema, L. K. Creamer and H. Singh, Int. Dairy J., 2010, 20, 571–579 CrossRef CAS.
- C. C. vandenAkker, M. F. Engel, K. P. Velikov, M. Bonn and G. H. Koenderink, J. Am. Chem. Soc., 2011, 133, 18030–18033 CrossRef CAS PubMed.
- W. S. Gosal, I. J. Morten, E. W. Hewitt, D. A. Smith, N. H. Thomson and S. E. Radford, J. Mol. Biol., 2005, 351, 850–864 CrossRef CAS PubMed.
- F. Hasecke, T. Miti, C. Perez, J. Barton, D. Scholzel, L. Gremer, C. S. R. Gruning, G. Matthews, G. Meisl, T. P. J. Knowles, D. Willbold, P. Neudecker, H. Heise, G. Ullah, W. Hoyer and M. Muschol, Chem. Sci., 2018, 9, 5937–5948 RSC.
- C. H. Tang, S. S. Wang and Q. R. Huang, Food Res. Int., 2012, 46, 229–236 CrossRef CAS.
- F. Hillenkamp and M. Karas, in MALDI MS, ed. F. Hillenkamp and J. Peter-Katalinić, Wiley-VCH Verlag GmbH & Co. KGaA, Weinheim, Germany, 2007, vol. 1, pp. 1–28 Search PubMed.
- A. Gattiker, W. V. Bienvenut, A. Bairoch and E. Gasteiger, Proteomics, 2002, 2, 1435–1444 CrossRef CAS PubMed.
- E. Gasteiger, C. Hoogland, A. Gattiker, S. Duvaud, M. R. Wilkins, R. D. Appel and A. Bairoch, in The proteomics protocols handbook, ed. J. M. Walker, Humana Press, 2005, pp. 571–607 Search PubMed.
- S. Maurer-Stroh, M. Debulpaep, N. Kuemmerer, M. Lopez de la Paz, I. C. Martins, J. Reumers, K. L. Morris, A. Copland, L. Serpell, L. Serrano, J. W. Schymkowitz and F. Rousseau, Nat. Methods, 2010, 7, 237–242 CrossRef CAS PubMed.
- A. V. Kajava, U. Baxa and A. C. Steven, FASEB J., 2010, 24, 1311–1319 CrossRef CAS PubMed.
- A. B. Ahmed, N. Znassi, M. T. Chateau and A. V. Kajava, Alzheimer's Dementia, 2015, 11, 681–690 CrossRef PubMed.
- J. S. Richardson and D. C. Richardson, Proc. Natl. Acad. Sci. U. S. A., 2002, 99, 2754–2759 CrossRef CAS PubMed.
- V. Vetri and V. Foderà, FEBS Lett., 2015, 589, 2448–2463 CrossRef CAS PubMed.
Footnote |
| † Electronic supplementary information (ESI) available: Additional tables and figures. See DOI: 10.1039/c8ra10610j |
| This journal is © The Royal Society of Chemistry 2019 |

