 Open Access Article
Effects of dispersed copper nanoparticles on Ni-ceria based dry methanol fuelled low temperature solid oxide fuel cells†
Ok Sung Jeona,
Jin Goo Leeb,
Yunseong Jia,
Sung-hun Leec,
Ohchan Kwona,
Jeong Pil Kima and
Yong Gun Shul *a
*a
aDepartment of Chemical and Bio-molecular Engineering, Yonsei University, 134 Shinchon-dong Seodaemun-gu, Seoul 120-749, Republic of Korea. E-mail: shulyg@yonsei.ac.kr
bSchool of Chemistry, University of St Andrews, St Andrews, Fife KY16 9ST, UK
cWonik Materials, 30, Yangcheong 3-gil, Ochang-eup, Cheongwon-gu, Cheongju-si, Chungcheongbuk-do, Republic of Korea
First published on 21st February 2019
Abstract
Methanol is an attractive energy source due to its portability and thermodynamic coke resistance by its oxygen content. In order to operate dry methanol fuel low temperature solid oxide fuel cells (LT-SOFCs), it is important to solve the problems of carbon formation and its low performance. In this study, copper impregnation was selected to decrease the carbon deposition and enhance the performance at low temperature. The interaction of copper, ceria and nickel improves CO oxidation capacity which improves coke tolerance and nano-sized nickel copper alloys improved durability and catalytic performance under methanol feed. It markedly amplified the performance about 0.4 W cm−2 at 550 °C with the durable operation at 1.4 A cm−2 over 50 h. Loading copper nanoparticles is promising method for Ni-ceria based LT-SOFC using methanol fuel with high performance and stable operation.
Introduction
Direct hydrocarbon fuelled low temperature solid oxide fuel cells (LT-SOFCs) have been studied for decades.1–6 Among various hydrocarbon fuels, methanol can be great candidate for following reasons. Firstly, oxygen content in CH3OH can thermodynamically promote to oxidize the carbon which was deposited on metal active sites inhibiting catalytic reaction.7–10 Secondly, methanol can be easily reformed to CO and H2 at low temperature. Portability of methanol fuel was key point to expand range of application.11Though it has lots of advantages, significant problems such as carbon deposition and poor performance at low temperature appear in methanol fuelled LT-SOFC. In SOFC system, the thermodynamic equilibrium of the Boudouard reaction (2CO(g) → C(s) + CO2(g)) is shifted to the right at operating temperatures below 700 °C and carbon deposition occurs mainly owing to Boudouard reaction.12–14 For this reason, Boudouard reaction should be avoided at 550 °C to minimize the carbon deposition, which causes the degradation of cell performance.
Ni-based catalyst has been generally used as anode materials, but the most of the carbon deposition arising from the nickel metal. Tian Gan recently reported that consistent voltage drop occurred at Ni-SDC anode based SOFC during 200 min operation due to carbon deposition on nickel metal at 700 °C.15
Great efforts have been devoted to develop the nickel-free anodes with high performance using perovskite type catalyst such as La0.8Sr0.2Cr0.98Ru0.02O3,16 Sr2FeNb0.2Mo0.8O6−δ,17 LaCo0.3Fe0.67Pd0.03O3–δ,18 etc.,19–23 but the nickel is still essential to lower the price of anode materials and operating temperature with reasonable performance. In order to overcome vulnerable properties of Ni for carbon deposition, an addition of coke-tolerant oxide materials has been studied. Recently, Q. Yang et al. referred that small quantity of MgO (∼3 wt%) on Ni cermet anode shows excellent long-term stability for 330 h in humidified methane at 800 °C.24 J. Qu et al. also reported that CaO assisted to inhibit carbon deposition under humidified methane fuel at 650 °C.25 However, these oxide additives can reduce SOFC performance when quantities of additive increased.
For these reasons, it was necessary to modify nickel metal with low-cost metals to enhance both performance and coke resistance. Among inexpensive metal group, copper is expected to be applicable as an anode material for methanol since it is widely used as the catalyst for methanol decomposition.26–28 Although Cu is active for methanol decomposition, it is not good catalyst for the electrochemical oxidation of H2 and CO. The copper simply acted as an electrical conducting path in SOFC.29 Ceria contents within the cermet assisted to electrochemically oxidize the hydrocarbon fuel. Ceria based oxide ion conductor such as gadolinium doped ceria (GDC) has been used as coke resistant material in anode at low temperature.30 The valence change between +3 and +4 in GDC remarkably facilitated the hydrocarbon oxidation on the surface.31–33 Furthermore, if copper is used as dopant in GDC, with forming Cu–Ce–O bonds, tiny copper contents tempt to make the oxygen vacancies and structural defects at the ceria support which give an enormous influence on the CO oxidation ability and oxide ionic transport.34–36
Although Cu is active for methanol decomposition and Cu-ceria composite enhance the CO oxidation ability, Cu metal has poor catalytic activity for C–H bond scission and H2.37 It was main cause to degrade the performance compared to the conversion of Ni-based anode supported SOFC. In the case of Cu–Ni alloys, the formation of the solid solution has been shown to significantly alter the catalytic properties of the Ni component that copper concentrates strongly in the surface of copper–nickel alloys of low overall copper content would imply a much greater alteration of intrinsic metallic properties in the surface region than in the bulk.38 It can provide methanol fuelled LT-SOFC with high performance and durability.
For these reasons, we focused on the copper doping in anode materials, nickel metal and ceria, which can enhance the methanol conversion and coke resistance. Copper dispersed coke-tolerant methanol fuelled LT-SOFC was successfully fabricated by impregnation method in this study. The Ni–Cu–cerium oxide based anode enhanced the CO oxidation ability which can suppress the carbon formation. Furthermore, the cell exhibited remarkable performance of 0.4 W cm−2 at 550 °C in CH3OH and was durable at the high current density of 1.4 A cm−2 over 50 h.
Experimental
Anode and cathode materials
NiO (J. T. Baker), 10 mol% gadolinium doped ceria (GDC, fuel cell materials) and starch as a pore former were ball-milled in ethanol for 24 h, then dried at 80 °C for 12 h. The weight ratio of NiO to GDC was 6![[thin space (1/6-em)]](https://www.rsc.org/images/entities/char_2009.gif) :
:![[thin space (1/6-em)]](https://www.rsc.org/images/entities/char_2009.gif) 4 and the starch contents was 20 wt% of the anode powder. Cathode paste was prepared by 3-role milling with commercial 24 h ball-milled La0.6Sr0.4Co0.8Fe0.2 (LSCF) (Kceracell) powder.
4 and the starch contents was 20 wt% of the anode powder. Cathode paste was prepared by 3-role milling with commercial 24 h ball-milled La0.6Sr0.4Co0.8Fe0.2 (LSCF) (Kceracell) powder.
Anode functional layer
The anode functional layer (AFL) powder was fabricated by the method presented in previous study.39 Core–shell like nanocomposite Ni-GDC AFL powders were prepared using the Pechini. Core particles is composed of commercialized Gd0.1Ce0.9O1.95 powders with surface area of 10–14 m2 g−1 and particle size (d50) of 0.1–0.4 μm (GDC, fuel cell materials). Gd(NO3)3·6H2O (Sigma Aldrich), Ce(NO3)3·6H2O (Sigma Aldrich) and Ni(NO3)3·6H2O (Junsei) were dissolved in distilled water with the mole fraction of 0.1![[thin space (1/6-em)]](https://www.rsc.org/images/entities/char_2009.gif) :
:![[thin space (1/6-em)]](https://www.rsc.org/images/entities/char_2009.gif) 0.9
0.9![[thin space (1/6-em)]](https://www.rsc.org/images/entities/char_2009.gif) :
:![[thin space (1/6-em)]](https://www.rsc.org/images/entities/char_2009.gif) 4.83. Citric acid (CA) (Duksan) and ethylene glycol (EG) (Sigma Aldrich) were added into the solution containing the metal salts (M) ([CA]/[M] = 1 and [EG]/[CA] = 4). The core particles were added into the solution, and then vigorous stirring was carried out at 70 °C until the polymeric sol was formed. The polymeric sol was burned out at 200 °C to obtain core–shell-like AFL particles. The AFL powders calcined at 600
4.83. Citric acid (CA) (Duksan) and ethylene glycol (EG) (Sigma Aldrich) were added into the solution containing the metal salts (M) ([CA]/[M] = 1 and [EG]/[CA] = 4). The core particles were added into the solution, and then vigorous stirring was carried out at 70 °C until the polymeric sol was formed. The polymeric sol was burned out at 200 °C to obtain core–shell-like AFL particles. The AFL powders calcined at 600![[thin space (1/6-em)]](https://www.rsc.org/images/entities/char_2009.gif) °C were ball-milled with EFKA 4340 (0.4
°C were ball-milled with EFKA 4340 (0.4![[thin space (1/6-em)]](https://www.rsc.org/images/entities/char_2009.gif) ml) as a dispersant in a mixed toluene/isopropyl alcohol (IPA; 100
ml) as a dispersant in a mixed toluene/isopropyl alcohol (IPA; 100![[thin space (1/6-em)]](https://www.rsc.org/images/entities/char_2009.gif) ml) for 12
ml) for 12![[thin space (1/6-em)]](https://www.rsc.org/images/entities/char_2009.gif) h. Thereafter, di-n-butylphthalate (DBP) (2
h. Thereafter, di-n-butylphthalate (DBP) (2![[thin space (1/6-em)]](https://www.rsc.org/images/entities/char_2009.gif) ml) as a plasticiser, Triton-X (0.4
ml) as a plasticiser, Triton-X (0.4![[thin space (1/6-em)]](https://www.rsc.org/images/entities/char_2009.gif) ml) as a surfactant and polyvinyl butyral (PVB) (0.5
ml) as a surfactant and polyvinyl butyral (PVB) (0.5![[thin space (1/6-em)]](https://www.rsc.org/images/entities/char_2009.gif) g) as a binder were added to the suspension, and then the AFL slurry was ball-milled for 24
g) as a binder were added to the suspension, and then the AFL slurry was ball-milled for 24![[thin space (1/6-em)]](https://www.rsc.org/images/entities/char_2009.gif) h.
h.
GDC electrolyte
GDC electrolyte slurry was prepared by ball-milling process. GDC powder was ball-milled with proper amount of EFKA 4340 in mixed toluene/IPA for 12 h. Then, DBP, Triton-X, PVB and 0.2 wt% of CuO as a sintering aid were added to suspension. The dip-coating process was carried out on the anode supports without the AFL.Single-cell fabrication
The Ni-GDC powder was pressed at 50 MPa to fabricate disk-like anode supports with a diameter of 3.6 cm. The anode substrates were partially sintered at 1100 °C for 3 h. The AFL powder was coated on the Ni-GDC anode by dip-coating method. AFL coated anode substrate was sintered at 1000 °C for 3 h. The GDC slurry was coated on the AFL by same method. The half-cell was fully sintered at 1500 °C for 3 h. Ni–Cu nanoalloys in the anode substrate were fabricated by impregnation method and in situ nano-alloying during an operation with reduced atmosphere. Precursor solution was composed of mixture with Cu(NO3)3·3H2O, urea, water and ethanol according to the molar ratio of 0.1![[thin space (1/6-em)]](https://www.rsc.org/images/entities/char_2009.gif) :
:![[thin space (1/6-em)]](https://www.rsc.org/images/entities/char_2009.gif) 1
1![[thin space (1/6-em)]](https://www.rsc.org/images/entities/char_2009.gif) :
:![[thin space (1/6-em)]](https://www.rsc.org/images/entities/char_2009.gif) 11.7
11.7![[thin space (1/6-em)]](https://www.rsc.org/images/entities/char_2009.gif) :
:![[thin space (1/6-em)]](https://www.rsc.org/images/entities/char_2009.gif) 2.1. The solution was dropped on the half-cell to fill the pores. To remove the solvent inside the pellet, dry process was added to decompose the urea at 80 °C for 2 h and heat treatment at 400 °C for an hour to remove carbon in the organic compound induced the formation of CuO nanoparticles on the surface of anode substrate. The impregnated pellet was sintered at 800 °C for 3 h to crystalize the nickel–copper oxide phase. A polishing process to remove the top side of impregnated anode surface is needed to lower the diffusion resistance. The cathode paste was screen-printed on the GDC electrolyte side, and the cell was finally sintered at 1000 °C for 2 h.
2.1. The solution was dropped on the half-cell to fill the pores. To remove the solvent inside the pellet, dry process was added to decompose the urea at 80 °C for 2 h and heat treatment at 400 °C for an hour to remove carbon in the organic compound induced the formation of CuO nanoparticles on the surface of anode substrate. The impregnated pellet was sintered at 800 °C for 3 h to crystalize the nickel–copper oxide phase. A polishing process to remove the top side of impregnated anode surface is needed to lower the diffusion resistance. The cathode paste was screen-printed on the GDC electrolyte side, and the cell was finally sintered at 1000 °C for 2 h.
Characterizations
The crystal structures of the anode pellets were determined by X-ray diffraction (XRD, Rigaku, D/Max-2200 model) with Cu Kα radiation at a wavelength of 1.5406 Å after sintered at 1500 °C for 3 h. Temperature-programmed reduction (TPR) of the same weighted sample (0.1 g) was packed in a quartz tube and heat treated in 10% H2 atmosphere with flow rate as 50 sccm from 150 °C to 550 °C with heating rate, 10 °C min−1. Hydrogen consumption was measured by thermal conductivity (TCD) detector. Ni2p and Ce3d of samples were detected by X-ray photoelectron spectroscopy (XPS, K-alpha, Thermo U. K.) with monochromated Al X-ray sources (Al Kα line: 1486.6 eV). The electrical conductivity was determined by using versatile multichannel potentiostat (VSP, Biologic, VMP3B-10 model). The frequency range was varied from 1 Hz to 1 MHz with the applied AC amplitude of 30 mV. Field emission scanning electron microscopy (FE-SEM, JEOL, JSM-6701F model) was used to observe a surface and cross-sectional images of the cells and the catalyst. Individual cells (2 cm × 2 cm) with the electrode area of 1.1 cm2 were used in the cell test. Two Au meshes were attached to each of the anodes and cathodes, and Pt paste was used only on the cathode side as a current collector. A Pyrex sealant adhered to the cell and a zirconia tube in a testing apparatus. The temperature was gradually increased to 750 °C, then remained for 30 minutes to ensure complete sealing. The temperature was down to 700 °C, and then hydrogen gas was fed into the anode for 1 h to reduce anode nickel oxide and copper oxide to metal phase. The cells were tested at 500 °C, 550 °C, 600 °C and 650 °C with hydrogen, respectively. The methanol fuelled cells were only tested at 550 °C. The electrochemical measurement was conducted in the flow rates of air of 400 sccm, hydrogen of 200 sccm and liquid methanol of 0.83 sccm, respectively. The electrochemical analysis was carried out by using a FC Impedance meter (Kikusi, KFM-2030 model) and versatile multichannel potentiostat. The catalytic reforming reactions of methanol were carried out at atmospheric pressure in a continuous-flow quartz reactor (diameter: 8 mm) packed with 0.57 g anode pellet of cells. The anode materials were pre-heated at 700 °C with H2 to transform the ceramic oxide to metal form for 1 h. In order to compare the conversion and selectivity from methanol reaction between two cells, reduced anode pellets were heated at 550 °C in 95 sccm gas flow (5.26% methanol in N2) and 10![[thin space (1/6-em)]](https://www.rsc.org/images/entities/char_2009.gif) 000 cm3 h−1 gcat−1 gas hourly space velocities (GHSV). After 1 h, these were analysed by gas chromatography with FID and TCD, using a porapak N and mol sieve 13X column and Ar as the carrier gas. Raman spectroscopy was measured at room temperature under ambient conditions using LabRam Aramis (Horriba Jovin Yvon) an Ar-ion laser beam at an exciting radiation wavelength of 532 nm on the reference cell and the Cu impregnated cell after long-term methanol fuelled test for 20 h and 60 h, respectively.
000 cm3 h−1 gcat−1 gas hourly space velocities (GHSV). After 1 h, these were analysed by gas chromatography with FID and TCD, using a porapak N and mol sieve 13X column and Ar as the carrier gas. Raman spectroscopy was measured at room temperature under ambient conditions using LabRam Aramis (Horriba Jovin Yvon) an Ar-ion laser beam at an exciting radiation wavelength of 532 nm on the reference cell and the Cu impregnated cell after long-term methanol fuelled test for 20 h and 60 h, respectively.
Results and discussion
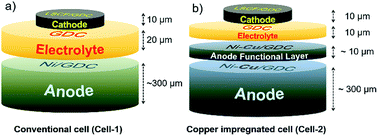
The cell configuration directly affected to the performance of the SOFC. Conventional SOFC fabricated by dip-coating method is generally composed of 20 μm thick electrolyte. In our previous research, thin electrolyte layer could be successfully fabricated by simple dip-coating method and resulted to form highly efficient SOFC.40 This thin electrolyte about 10 μm thick reduced the ohmic resistance of SOFC. In order to demonstrate the beneficial effects of dispersed copper contents on activity and coke tolerance, two respective cells were prepared, Ni/GDC based anode supported conventional cell abbreviating to “Cell-1” and copper infiltrated anode cell abbreviating to “Cell-2” (Fig. 1a and b).To obtain the states of anode materials at initial SOFC operating system, half cells of Cell-1 and Cell-2 were exposed to H2 at 700 °C for 1 h. It was discovered that dispersed copper nanoparticles occurred at the Ni and GDC surfaces after copper infiltration (Fig. 2). Green and blue dots were Ce, Cu and Ni elements located in the anode. As shown in Fig. 2, nickel metal and GDC were completely separated. On the other hand, copper contents were dispersed on the GDC electrolyte and nickel. It means that coper contents were co-doped in nickel metal and GDC via infiltration method.
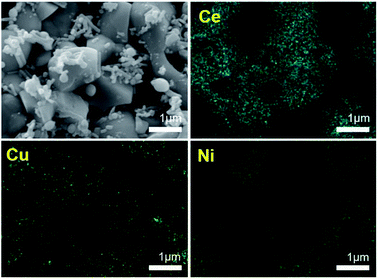 | ||
| Fig. 2 Scanning Electron Microscope (SEM) images and elemental scan mapping images of the Cell-2 with Ni, Cu and Ce elements. | ||
Fig. 3 shows X-ray diffraction (XRD) patterns of the Cell-1 and Cell-2 anode before and after H2 reduction at 700 °C for 1 h. As shown in ESI Fig. 1,† no extra diffraction peaks to copper oxide (CuO) were detected before reduction due to similar ionic radii of Ni2+ (78 pm) and Cu2+ (87 pm) which means that Cu ions can be easily substituted for Ni ions without significant lattice distortion.41 Furthermore, it also strongly combined with nearby GDC and led to shift the main peak degree of X-ray diffraction (XRD) pattern. At high annealing temperature (1000 °C), the solubility dropped and Cu started to dissolve in GDC. It was found that 2θ value at main peak of GDC in Cell-1 anode, 28.46°, was increased to 28.48° by copper infiltration owing to difference between crystal ionic radius of cerium and copper. (Ce4+: 101 pm and Cu2+: 87 pm) (Fig. 3a) After reduction, the NiO phase was transformed into nickel metal which were face-centered cubic (FCC) structures (Fig. 3b). As shown in Fig. 3b, formation of Ni–Cu alloy was confirmed by 2θ value of Ni main peak which was decreased by copper infiltration as 44.48° in Cell-1 to 44.46° in Cell-2. Furthermore, main peak degree of GDC in Cell-1 was also increased more rather than Cell-2 compared to the cells before reduction process. It indicated that copper metal was slightly more doped in Cell-2 though it was exsolved from GDC in both cells. This Cu doped GDC can enhance CO oxidation which is a key step for suppressing the growth of carbon whiskers on the Ni surfaces at low temperatures, and nano-sized Ni–Cu alloy would enhance the number of active sites.
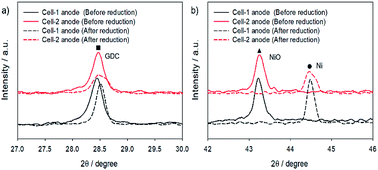 | ||
| Fig. 3 X-ray diffraction (XRD) patterns of the Cell-1 and Cell-2 anodes magnified (a) GDC and (b) NiO, Ni peaks. | ||
Interestingly, grain sizes of GDC and nickel metal were significantly decreased in Cell-2 (GDC: 40.96 nm to 25.93 nm, NiO: 44.96 nm, Ni: 29.69 nm), though that of Cell-1 were increased after reduction at high temperature (GDC: 50.54 nm to 51.53 nm, NiO: 37.24 nm, Ni: 58.76 nm) (ESI Table 1†). The reduction of the grain sizes of GDC and nickel metal probably arose from the Cu doping in the host Ni and GDC lattice. Copper contents in GDC and nickel motivated formation of more defects during phase transition by reduction process on account of the grain growth relying on the grain boundary mobility.42 These defects increased mismatch and it significantly reduced grain sizes of Ni and GDC. Increasing the number of grain boundaries in GDC can enhance CO oxidation and smaller particle size of Ni–Cu can be expected by copper infiltration.
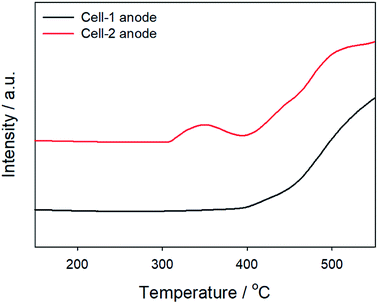
The effects of reducing metal grain size by copper infiltration were shown in Fig. 4. Hydrogen gas was mainly formed during methanol oxidation. Copper metal has poor reactivity for H2 oxidation as mentioned above. On the other hand, Temperature Programmed Reduction (TPR) data of H2 referred that initial reaction temperature was reduced owing to the nanoparticles and the activity of Cell-2 anode was better than that of Cell-1 anode. It implied that the reduction of particle size in anode metal by copper infiltration improved catalytic activity. These improvement affected to the performance of methanol fuelled SOFC.
Fig. 5 shows X-ray photoelectron spectroscopy (XPS) of Cell-1 anode and Cell-2 anode after reduction. The main peaks of Ni in Cell-1 anode and Cell-2 anode were 852.08 eV and 851.88 eV, respectively (Fig. 5a). The binding energy of nickel decreased when it was doped with copper. It was demonstrated that the decrease in the binding energy for Ni was relevant to changes in unfilled d-band electron holes stemming from the charge transfer from Cu to the adjacent Ni when it formed Ni–Cu alloy.43 Furthermore, copper doping also modified the state of ceria (Fig. 5b). The amplification of Ce3+ related to numerical increment of oxygen vacancies. As shown in ESI Table 2,† Ce3+/Ce4+ ratio increased to 0.46 from 0.34 by copper doping. The increment in oxygen vacancies was directly linked to CO oxidation,44 and it means that enhanced catalytic activity of CO oxidation in ceria was induced by copper.
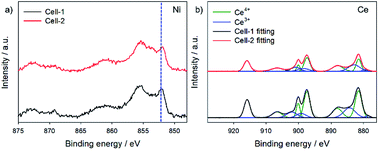 | ||
| Fig. 5 X-ray photoelectron spectroscopy (XPS) with the element of (a) Ni and (b) Ce in Cell-1 anode and Cell-2 anode. | ||
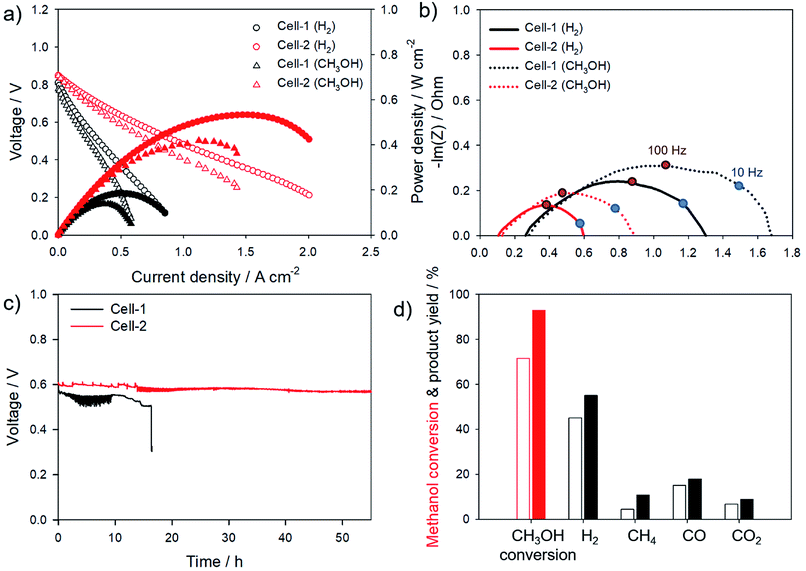
Fig. 6a shows typical current–voltage characteristics of Cell-1 and Cell-2 with hydrogen and methanol used as fuel at 550 °C, respectively. The maximum power density of Cell-1 was 0.18 W cm−2 with H2 and 0.14 W cm−2 with CH3OH at 550 °C. On the other hand, the maximum power density of Cell-2 was improved to 0.53 W cm−2 in H2 atmosphere which primarily generated by decrease in thickness of electrolyte and grain size of anode materials. For methanol fuel, the power density was 0.42 W cm−2 in Cell-2. In order to determine the main causes of performance improvement, impedance spectra was measured. The impedance spectra of Cell-1 and Cell-2 were shown in Fig. 6b. The ohmic resistance value represents at an intersection of impedance arc and x-axis at high frequency. Diameter of the semicircle refers to the charge transfer resistance. The ohmic resistance values of Cell-1 and Cell-2 with H2 referred to 0.27 Ω cm2 and 0.11 Ω cm2, respectively. It was considered that thin electrolyte in Cell-2 contributed to lower the ohmic resistance. With methanol fuel, ohmic resistances were similar to the values at H2 atmosphere. The charge transfer resistances were 1.00 Ω cm2 in Cell-1 and 0.48 Ω cm2 in Cell-2 at 550 °C with H2. With methanol fuel, charge transfer resistances were 0.75 Ω cm2 in Cell-1 and 0.76 Ω cm2 in Cell-2, respectively. H. Li et al. reported that the anode polarization of the cell using H2 as fuel is much smaller than using methanol.45 The difference of anode polarization stems from the electro-oxidation of CH3OH which is much more difficult than that of H2. Furthermore, impedance spectra at low frequency range below 10 Hz shows the gas conversion which represented that gas conversion at the Cell-2 anode was better than Cell-1.46 The increment in the number of active sites in Cell-2 would lower overall charge transfer resistance and enhance conversions for both fuel, H2 and CH3OH. In order to demonstrate enhancement in durability of cell, the cell voltages were recorded under the constant current load with methanol fuel at 550 °C, as exhibited in Fig. 6c. Initial voltage outputs of both cells were approximately 0.6 V. It was found that the performance of Cell-1 was gradually dropped until about 15 h. When the carbon deposition increased immoderately, the excessive carbon dissolves into the nickel and then it significantly reduced the nickel activity.47 After 15 h, irreversible degradation occurred which was difficult to regenerate the power output. On the other hand, Cell-2 generated a stable voltage output for more than 50 h implying that the coke formation was inhibited by configuration of Cell-2. Gas chromatography (GC) was used to confirm difference of methanol conversion and CO oxidation activity between Cell-1 and Cell-2 anode as shown in Fig. 6d. At 550 °C, Cell-2 anode shows significant improvement in CH3OH conversion (92.87%) compared to that of Cell-1 (71.63%). Higher conversion of CH3OH enhanced the yield of hydrogen (Cell-1: 45.17%, Cell-2: 55.10%). Furthermore, Cell-2 also enhanced CO oxidation which is main cause of coke formation with Boudouard reaction. CO selectivities of Cell-1 and Cell-2 anode were 21.11% and 19.40%, respectively. It resulted to form larger amount of CO2 in product of Cell-2 (CO2 selectivity of Cell-1: 9.46%, Cell-2: 9.68%). Catalytic activities for CH3OH and CO oxidation of Cell-2 were far superior compared to that of Cell-1.
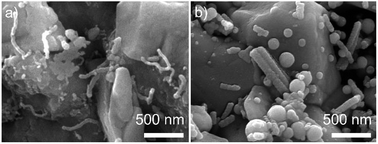
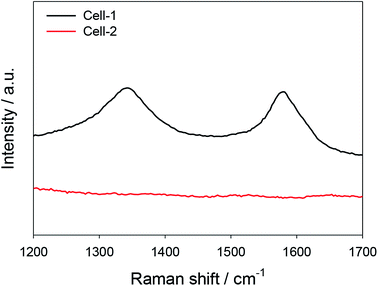
The coke resistant properties of Cell-1 and Cell-2 were easily and optically distinguished by scanning electron microscope (SEM) images. After long-term test with methanol, although filamentous graphitic carbon dominantly appeared at Cell-1 (Fig. 7a), it was not detected in Cell-2 (Fig. 7b). The absence of graphitic carbon in Cell-2 was also detected by ex situ Raman spectroscopy. On account of graphitic carbon peak which appeared at ∼1350 cm−1 (D band), ∼1590 cm−1 (G band) and ∼1620 cm−1 (D′ band),48,49 it can verify nonexistence of graphitic carbon in Cell-2 after long-term test though graphitic carbon was detected in Cell-1 (Fig. 8). As shown in ESI Table 3,† severe carbon growth (∼82 mol% C composition) was detected at the Cell-1 anode after CH3OH long-term test for 15 h. On the other hand, less amorphous carbon was detected in the Cell-2 after CH3OH long-term test for 60 h (∼36 mol% C composition). It implied that further research on Cell-2 is needed to overcome the amorphous carbon deposition.
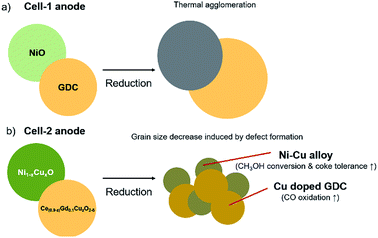
In summary, two typical improved points were introduced by copper infiltration as shown in Fig. 9. Direct CH3OH oxidative ability of Cu improved CH3OH conversion, and increasing oxygen vacancies in ceria enhanced CO oxidation to inhibit carbon formation. Additionally, these abilities were boosted by reducing grain sizes of Ni and GDC arising from forming defects in Cu doped sites in this study.
Conclusions
We improved the coke-tolerance of low temperature solid oxide fuel cell anode by simple infiltration method. Copper nanoparticles were dispersed in anode materials consisting of nickel and GDC which assisted to reduce grain size of metal and GDC enhancing its activity to reform CH3OH and CO oxidation. It resulted to have maximum power density about 0.4 W cm−2. Furthermore, the long-term durability test was stably operated at constant current density over 50 h and it implied that copper infiltration also enhanced durability of CH3OH fueled LT-SOFC. Hence, dispersed copper nanoparticles for nickel and ceria based anode enhance the performance and durability simultaneously, and it has application prospect to low temperature targeted SOFCs using methanol as fuel.Conflicts of interest
There are no conflicts to declare.Acknowledgements
This research was supported by New & Renewable Energy Core Technology Program of the Korea Institute of Energy Technology Evaluation and Planning (KETEP) granted financial resource from the Ministry of Trade, Industry & Energy, Republic of Korea (No. 20173010041930).Notes and references
- X. Wu, X. Zhou, Y. Tian, X. Kong, J. Zhang, W. Zuo and X. Ye, Stability and electrochemical performance of lanthanum ferrite-based composite SOFC anodes in hydrogen and carbon monoxide, Electrochim. Acta, 2016, 208, 164–173 CrossRef CAS
.
- B. Farrell and S. Linic, Direct electrochemical oxidation of ethanol on SOFCs: improved carbon tolerance of Ni anode by alloying, Appl. Catal., B, 2016, 183, 386–393 CAS
.
- X. Wu, Y. Tian, J. Zhang, W. Zuo, X. Kong, J. Wang, K. Sun and X. Zhou, Enhanced electrochemical performance and carbon anti-coking ability of solid oxide fuel cells with silver modified nickel-yttrium stabilized zirconia anode by electroless plating, J. Power Sources, 2016, 301, 143–150 CrossRef CAS
.
- J. G. Lee, C. M. Lee, M. Park and Y. G. Shul, Direct methane fuel cell with La2Sn2O7-Ni-Gd0.1Ce0.9O1.95 anode and electrospun La0.6Sr0.4Co0.2Fe0.8O3-δ-Gd0.1Ce0.9O1.95 cathode, RSC Adv., 2013, 3, 11816–11822 RSC
.
- H. Kan and H. Lee, Sn-doped Ni/YSZ anode catalysts with enhanced carbon deposition resistance for an intermediate temperature SOFC, Appl. Catal., B, 2010, 97(1–2), 108–114 CrossRef CAS
.
- J. Myung, S. Kim, T. H. Shin, D. Lee, J. T. S. Irvine, J. Moon and S. Hyun, Nano-composite structural Ni–Sn alloy anodes for high performance and durability of direct methane-fueled SOFCs, J. Mater. Chem. A, 2015, 3, 13801–13806 RSC
.
- B. Feng, C. Y. Wang and B. Zhu, Catalysts and Performances for Direct Methanol Low-Temperature
![[thin space (1/6-em)]](https://www.rsc.org/images/entities/char_2009.gif) (300 to 600
(300 to 600![[thin space (1/6-em)]](https://www.rsc.org/images/entities/char_2009.gif) °C)
°C)![[thin space (1/6-em)]](https://www.rsc.org/images/entities/char_2009.gif) Solid Oxide Fuel Cells, Electrochem. Solid-State Lett., 2006, 9(2), A80–A81 CrossRef CAS
Solid Oxide Fuel Cells, Electrochem. Solid-State Lett., 2006, 9(2), A80–A81 CrossRef CAS .
- T. Kim, K. Ahn, J. M. Vohs and R. J. Gorte, Deactivation of ceria-based SOFC anodes in methanol, J. Power Sources, 2007, 164(1), 42–48 CrossRef CAS
.
- M. D. Mat, X. Liu, Z. Zhu and B. Zhu, Development of cathodes for methanol and ethanol fuelled low temperature (300–600 °C) solid oxide fuel cells, Int. J. Hydrogen Energy, 2007, 32(7), 796–801 CrossRef CAS
.
- G. J. Saunders, J. Preece and K. Kendall, Formulating liquid hydrocarbon fuels for SOFCs, J. Power Sources, 2004, 131(1–2), 23–26 CrossRef CAS
.
- M. Liu, R. Peng, D. Dong, J. Gao, X. Liu and G. Meng, Direct liquid methanol-fueled solid oxide fuel cell, J. Power Sources, 2008, 185(1), 188–192 CrossRef CAS
.
- E. P. Murray, T. Tsai and S. A. Barnett, A direct-methane fuel cell with a ceria-based anode, Nature, 1999, 400, 649–651 CrossRef CAS
.
- J. B. Wang, H. C. Jang and T. J. Huang, Study of Ni-samaria-doped ceria anode for direct oxidation of methane in solid oxide fuel cells, J. Power Sources, 2003, 122, 122–131 CrossRef CAS
.
- S. P. Yoon, J. Han, S. W. Nam, T. H. Lim and S. A. Hong, Improvement of anode performance by surface modification for solid oxide fuel cell running on hydrocarbon fuel, J. Power Sources, 2004, 136, 30–36 CrossRef CAS
.
- T. Gan, G. Ding, B. Chen, X. Zhi, P. Li, X. Yao, N. Hou, L. Fan, Y. Zhao and Y. Li, Effects of manganese oxides on the activity and stability of Ni-Ce0.8Sm0.2O1.9 anode for solid oxide fuel cells with methanol as the fuel, Catal. Today, 2018 DOI:10.1016/j.cattod.2018.01.014
.
- T. Caillot, G. Gauthier, P. Delichère, C. Cayron and F. J. Cadete Santos Airesa, Evidence of anti-coking behavior of La0.8Sr0.2Cr0.98Ru0.02O3 as potential anode material for Solid Oxide Fuel Cells directly fed under methane, J. Catal., 2012, 290, 158–164 CAS
.
- H. Ding, Z. Tao, S. Liua and Y. Yang, A redox-stable direct-methane solid oxide fuel cell (SOFC) with Sr2FeNb0.2Mo0.8O6−δ double perovskite as anode material, J. Power Sources, 2016, 327, 573–579 CrossRef CAS
.
- J. Shen, Y. Chen, G. Yang, W. Zhou, M. O. Tadé and Z. Shao, Impregnated LaCo0.3Fe0.67Pd0.03O3-δ as a promising electrocatalyst for “symmetrical” intermediate-temperature solid oxide fuel cells, J. Power Sources, 2016, 306, 92–99 CrossRef CAS
.
- E. S. Punta, J. Stubenrauch, J. M. Vohs and R. J. Gorte, Ceria-based anodes for the direct oxidation of methane in solid oxide fuel cells, Langmuir, 1995, 11, 4832–4837 CrossRef
.
- T. Wei, X. Zhou, Q. Hu, Q. Gao, D. Han, X. Lv and S. Wang, A high power density solid oxide fuel cell based on nano-structured La0.8Sr0.2Cr0.5Fe0.5O3-δ anode, Electrochim. Acta, 2014, 148, 33–38 CrossRef CAS
.
- C. Aliotta, L. F. Liotta, F. Deganello, V. La Parola and A. Martorana, Direct methane oxidation on La1−xSrxCr1−yFeyO3−δ perovskite-type oxides as potential anode for intermediate temperature solid oxide fuel cells, Appl. Catal., B, 2016, 180, 424–433 CrossRef CAS
.
- H. Chang, H. Chen, Z. Shao, J. Shi, J. Bai and S. Li, In situ fabrication of (Sr,La)FeO4 with CoFe alloy nanoparticles as an independent catalyst layer for direct methane-based solid oxide fuel cells with a nickel cermet anode, J. Mater. Chem. A, 2016, 4, 13997–14007 RSC
.
- J. M. Lee and J. W. Yun, Characteristics of Sr0.92Y0.08Ti0.7Fe0.3O3−δ anode running on humidified methane fuel in solid oxide fuel cells, Ceram. Int., 2016, 42(7), 8698–8705 CrossRef CAS
.
- Q. Yang, F. Chai, C. Ma, C. Sun, S. Shi and L. Chen, Enhanced coking tolerance of a MgO-modified Ni cermet anode for hydrocarbon fueled solid oxide fuel cells, J. Mater. Chem. A, 2016, 4, 18031–18036 CAS
.
- J. Qu, W. Wang, Y. Chen, X. Deng and Z. Shao, Stable direct-methane solid oxide fuel cells with calcium-oxide-modified nickel-based anodes operating at reduced temperatures, Appl. Energy, 2016, 164, 563–571 CrossRef CAS
.
- D. J. L. Brett, A. Atkinson, D. Cumming, E. Ramirez-Cabrera, R. Rudkin and N. P. Brandon, Methanol as a direct fuel in intermediate temperature (500-600 °C) solid oxide fuel cell with copper based anodes, Chem. Eng. Sci., 2005, 60, 5649–5662 CrossRef CAS
.
- B. Feng, C. Y. Wang and B. Zhu, Catalyst and performance for direct methanol low temperature (300-600 °C) solid oxide fuel cells, Electrochem. Solid-State Lett., 2006, 2, A80–A81 CrossRef
.
- M. K. Dongare, A. M. Dongare, V. B. Tare and E. Kemnitz, Synthesis and characterization of copper-stabilized zirconia as an anode material for SOFCs, Solid State Ionics, 2002, 152–153, 455–462 CrossRef CAS
.
- S. McIntosh and R. J. Gorte, Direct hydrocarbon solid oxide fuel cells, Chem. Rev., 2004, 104, 4845–4865 CrossRef CAS PubMed
.
- J. G. Lee, O. S. Jeon, H. J. Hwang, J. Jang, Y. Lee, S. H. Hyun and Y. G. Shul, Durable and High-Performance Direct-Methane Fuel Cells with Coke-Tolerant Ceria-Coated Ni Catalysts at Reduced Temperatures, Electrochim. Acta, 2016, 191, 677–686 CrossRef CAS
.
- W. Liu and M. Flytzani-Stephanopoulos, Total oxidation of carbon monoxide and methane over transition metal-fluorite oxide composite catalysts, J. Catal., 1995, 153, 304–316 CrossRef CAS
.
- Y. Li, Y. Cai, X. Xing, N. Chen, D. Deng and Y. Wang, Catalytic activity for CO oxidation of Cu–CeO2 composite nanoparticles synthesized by a hydrothermal method, Anal. Methods, 2015, 7, 3238–3245 RSC
.
- J. G. Lee, O. S. Jeon, K. H. Ryu, M. G. Park, S. H. Min, S. H. Hyun and Y. G. Shul, Effects of 8 mol% yttria-stabilized zirconia with copper oxide on solid oxide fuel cell performance, Ceram. Int., 2015, 41, 7982–7988 CrossRef CAS
.
- X. Wang, J. A. Rodriguez, J. C. Hanson, D. Gamarra, A. MartinezArias and M. Fernandez-Garcia, Unusual physical and chemical properties of Cu in Ce1-xCuxO2 oxide, J. Phys. Chem. B, 2005, 109, 19595–19603 CrossRef CAS PubMed
.
- G. Sedmak, S. Hocevar and J. Levec, Kinetics of selective CO oxidation in excess of H2 over the nanostructured Cu0.1Ce0.9O2-y catalyst, J. Catal., 2003, 213, 135–150 CrossRef CAS
.
- X. Qi and M. Flytzani-Stephanopoulos, Activity and stability of CuCeO2 catalysts in high-temperature water-gas shift for fuel-cell applications, Ind. Eng. Chem. Res., 2004, 43, 3055–3062 CrossRef CAS
.
- H. Kim, C. Lu, W. L. Worrell, J. M. Vohs and R. J. Gorte, Cu-Ni Cermet Anodes for Direct Oxidation of Methane in Solid-Oxide Fuel Cells, J. Electrochem. Soc., 2002, 149(3), A247–A250 CrossRef CAS
.
- J. H. Sinfelt, J. L. Carter and D. J. C. Yates, Catalytic Hydrogenolysis and Dehydrogenation over Copper-Nickel Alloys, J. Catal., 1972, 24, 283–296 CrossRef CAS
.
- J. G. Lee, M. G. Park, S. Hyun and Y. G. Shul, Nano-Composite Ni-Gd0.1Ce0.9O1.95 Anode Functional Layer for Low Temperature Solid Oxide Fuel Cells, Electrochim. Acta, 2014, 129, 100–106 CrossRef CAS
.
- J. G. Lee, J. H. Park and Y. G. Shul, Tailoring gadolinium-doped ceria-based solid oxide fuel cells to achieve 2
![[thin space (1/6-em)]](https://www.rsc.org/images/entities/char_2009.gif) W
W![[thin space (1/6-em)]](https://www.rsc.org/images/entities/char_2009.gif) cm−2 at 550
cm−2 at 550![[thin space (1/6-em)]](https://www.rsc.org/images/entities/char_2009.gif) °C, Nat. Commun., 2014, 5, 4045 CrossRef CAS PubMed
°C, Nat. Commun., 2014, 5, 4045 CrossRef CAS PubMed .
- S. C. Chen, T. Y. Kuo, Y. C. Lin and H. C. Lin, Preparation and properties of p-type transparent conductive Cu-doped NiO films, Thin Solid Films, 2011, 519, 4944–4947 CrossRef CAS
.
- P. Rao, R. V. Godbole and S. Bhagwat, Copper doped nickel ferrite nano-crystalline thin films: a potential gas sensor towards reducing gases, Mater. Chem. Phys., 2016, 171, 260–266 CrossRef CAS
.
- A. R. Naghash, T. H. Etsell and S. Xu, XRD and XPS Study of Cu-Ni Interactions on Reduced Copper-Nickel-Aluminum Oxide Solid Solution Catalysts, Chem. Mater., 2006, 18, 2480–2488 CrossRef CAS
.
- Y. Li, Y. Cai, X. Xing, N. Chen, D. Deng and Y. Wang, Catalytic activity for CO oxidation of Cu-CeO2 composite nanoparticles synthesized by a hydrothermal method, Anal. Methods, 2015, 7, 3238–3245 RSC
.
- H. Li, Y. Tian, Z. Wang, F. Qie and Y. Li, An all perovskite direct methanol solid oxide fuel cell with high resistance to carbon formation at the anode, RSC Adv., 2012, 2, 3857–3863 RSC
.
- R. Barfod, A. Hagen, S. Ramousse, P. V. Hendriksen and M. Mogensen, Fuel Cells, 2006, 6, 141–145 CrossRef CAS
.
- Y. Kim, J. H. Kim, J. Bae, C. W. Yoon and S. W. Nam, In situ analyses of carbon dissolution into Ni-YSZ anode materials, J. Phys. Chem. C, 2012, 116, 13281–13288 CrossRef CAS
.
- F. Yang, Y. Liu, L. Gao and J. Sun, pH-Sensitive Highly Dispersed Reduced Graphene Oxide Solution Using Lysozyme via an in situ Reduction Method, J. Phys. Chem. C, 2010, 114(50), 22085–22091 CrossRef CAS
.
- C. Su, Y. Xu, W. Zhang, J. Zhao, X. Tang, C. Tsai and L. Li, Electrical and Spectroscopic Characterizations of Ultra-Large Reduced Graphene Oxide Monolayers, Chem. Mater., 2009, 21(21), 5674–5680 CrossRef CAS
.
Footnote |
| † Electronic supplementary information (ESI) available. See DOI: 10.1039/c8ra07586g |
| This journal is © The Royal Society of Chemistry 2019 |

