DOI:
10.1039/C8RA10487E
(Paper)
RSC Adv., 2019,
9, 11641-11648
Fundamental aspects of the corrosion of N80 steel in a formation water system under high CO2 partial pressure at 100 °C
Received
21st December 2018
, Accepted 4th March 2019
First published on 15th April 2019
Abstract
The corrosion behavior of N80 carbon steel in a simulated formation water system saturated with CO2 under high pressure at 100 °C was investigated. The effect of the CO2 partial pressure on the electrochemical behavior and surface morphologies of the N80 carbon steel was analyzed by in situ electrochemical methods and surface analysis, combined with a series of thermodynamic calculations of the potential of anodic/cathodic reactions. While an increase in the CO2 partial pressure did not alter the corrosion mechanism of the N80 steel, it resulted in higher concentrations of H+ and HCO3− ions, thereby significantly enhancing the rate of the cathodic reactions. The precipitation rate of FeCO3 increased with the CO2 partial pressure, with small and fine grains nucleating and growing on the steel surface with poor protectiveness.
Introduction
Carbon steels are widely used in the petroleum industry owing to their cost-efficiency and good mechanical properties.1,2 In particular, N80 carbon steel is the most common tubing material.1 Despite this wide use, carbon steels are prone to undergo corrosion. CO2 corrosion has been regarded as one of the most common corrosion issues in oil- and gas-production and transportation facilities. CO2 corrosion is responsible for the failure of pipelines, tubing, and equipment, resulting in great economic losses and accidents.4–6 In addition, CO2 corrosion results in crude oil leakage and subsequent environmental pollution, having an impact also on downstream industries.7,8
The aqueous CO2 corrosion of carbon steels observed in the oil and gas industries is, by nature, a complex process involving a number of simultaneous electrochemical, chemical, and mass transport reactions taking place close to the corroding steel surface simultaneously. Carbon steel corrosion has been widely investigated over the past decades. Research has either focused on the inherent complexities of modelling the electrochemical processes, the corrosion mechanism itself, or on the numerous factors influencing the corrosion response of carbon steels.2,9–15 The different reactions taking place during corrosion1,12,16–19 and the corrosion behaviors are affected differently by temperature, CO2 partial pressure, pH, and other operational parameters. Temperature is a primary factor that plays an important role in the performance of films generated by CO2 corrosion products.20,21 At room temperature, iron carbonate precipitation is very slow and non-protective layers invariably form, even at high supersaturation values.12 However, higher temperatures (T > 70 °C) result in higher precipitation rates, yielding dense, well-attached protective layers and dramatically decreasing the corrosion rate.22–24 The CO2 partial pressure is another important factor that strongly influences corrosion processes.25,26 High CO2 partial pressures promote the precipitation of FeCO3. Videm27 investigated that increasing the CO2 partial pressure (from 1 to 10 bar) of a brine (80 °C, pH = 5) increased the film formation rate on a carbon steel significantly. Gavanluei28 reported high corrosion rates upon increasing the CO2 partial pressure up to 22.1 bar at 75 °C, despite the high density of the FeCO3 crystals formed on the steel surface. These environmental factors influencing the iron carbonate formation and the corrosion rate have been widely investigated at relative low temperatures and/or low CO2 partial pressures, while works at high temperatures and high CO2 partial pressures are scarce in the literature. However, corrosion in severe CO2-containing environments under high temperature and high pressure (HTHP) is potentially important, particularly in wellbore systems.
In this paper, the corrosion behaviors of N80 steel in simulated formation water system saturated with CO2 at high partial pressure and 100 °C were investigated by in situ electrochemical measurements. The formation of corrosion product films at different CO2 partial pressures was analyzed by scanning electron microscopy (SEM) and X-ray diffraction (XRD). With the aim to determine the relationship between the corrosion rate and the electrochemical mechanism, we calculated the ionic concentrations, reaction rate constants, and equilibrium electrode potentials of the possible anodic/cathodic reactions. The effect of high CO2 partial pressure on N80 steel at 100 °C was discussed. We believe that this study can provide an essential insight into the corrosion mechanism of carbon steels under HTHP CO2-containing environments.
Experimental
Materials and solution
The detailed composition of the N80 low alloy steel used herein is presented in Table 1.
Table 1 Chemical composition of the N80 low alloy steel used herein (wt%)
| |
C |
Si |
Mn |
P |
S |
Cr |
Mo |
Ni |
V |
Cu |
| N80 |
0.26 |
0.19 |
1.37 |
0.009 |
0.004 |
0.148 |
0.028 |
0.028 |
0.006 |
0.019 |
Immersion specimens were cut into 20 × 20 × 3 mm pieces, while the electrochemical test specimens were embedded in epoxy resin with an exposed working area of 10 × 10 mm2. All specimens were mechanically ground with up to 2000-grit silicon carbide papers, washed with distilled water, and degreased with acetone prior to testing.
A test solution simulating the formation water was prepared from deionized water and analytical grade chemicals (Tianjin Guangfu Technology Development Co., Ltd.). The chemical composition of the formation water is shown in Table 2. The experiments were conducted for dissolved O2 contents lower than 20 ppb, which was achieved by bubbling ultrapure N2 gas through the test solution. Subsequently, CO2 gas was purged for 2 h to saturate the test solution.
Table 2 Main composition of the simulated formation water (g L−1)
| Composition |
NaCl |
KCl |
CaCl2 |
MgCl2 |
Na2SO4 |
NaHCO3 |
| Content |
28.5 |
23.2 |
2.44 |
4.11 |
4.78 |
0.83 |
Immersion tests
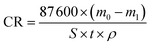
All immersion tests were conducted in a Hastelloy C276 autoclave in static conditions at 100 °C and varying CO2 partial pressures (0.15–4 MPa) for 72 h. The mass of the specimens was measured prior to the immersion tests (m0) and after the corrosion products were removed (m1), according to ASTM G1-03.29 An analytical balance with an accuracy of 10−4 g was used for weighing the specimens. The corrosion rate was calculated according to the following equation:| |
 | (1) |
where CR is the average corrosion rate in mm y−1; m0 and m1 are the masses of the specimen before and after the corrosion products were chemically removed, respectively, in g; t is the exposed time in h; ρ is the steel density in g cm−3, and S is the exposed surface area in cm.2
Morphology observations and composition analysis
The surface morphology and composition of the corrosion films were investigated by SEM. The composition of the corrosion products and their crystal structure were analyzed by XRD.
Electrochemical measurements
All electrochemical experiments were performed in a Hastelloy C276 autoclave using a conventional three-electrode system. A schematic diagram of the electrochemical autoclave and the electrode is shown in Fig. 1.
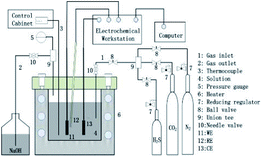 |
| | Fig. 1 Schematic of the HTHP electrochemical autoclave used for immersion tests and electrochemical characterization (WE-working electrode; RE-reference electrode; CE-counter electrode). | |
The specimen was used as working electrode, while a platinum sheet and a HTHP Ag/AgCl probe were used as counter and reference electrode, respectively. Electrochemical impedance spectroscopy (EIS) measurements were performed under open-circuit potential (OCP) over a frequency range of 100 kHz to 5 mHz with an alternating current (AC) perturbation potential of ± 5 mV. ZSimpWin 3.10 was used for fitting the EIS results. Potentiodynamic polarization tests were carried out from −250 (vs. corrosion potential Ecorr) to 750 mV with a scan rate of 0.5 mV s−1. All electrochemical measurements were performed at 100 °C under stagnant conditions.
Results
Immersion tests
Fig. 2 shows the corrosion rate of N80 carbon steel as a function of the CO2 partial pressure in formation water at 100 °C. We obtained herein the average general corrosion rate, while the ends of the error bars represent the maximum and minimum values, respectively. As shown in Fig. 2, the average corrosion rate increased with the CO2 partial pressure, corroborating with the observations of Gao14 and other researchers.30,31
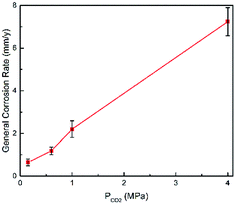 |
| | Fig. 2 Corrosion rate of N80 carbon steel at various CO2 partial pressures and 100 °C. | |
Fig. 3 shows the surface morphologies of corrosion scales on N80 steel at various CO2 partial pressures and 100 °C. The SEM micrographs provided in Fig. 3 indicate the difference in crystal density. At 0.15 MPa of CO2, the scale was composed of crystal grains with heterogeneous sizes, as shown in Fig. 3(a). The grains were observed to arrange closely and regularly with crystal size varying from 20 to 40 μm in width. The compactness of the scale increased and the crystal size decreased with the CO2 partial pressure. It can be clear seen from Fig. 3(d) that the average size of the crystal reduced to nearly 5–10 μm in width as PCO2 increased. In conjunction of these observations, the corrosion rate is obviously increasing. This also indicates that the size and porosity of the crystals in the corrosion product give a contrary indication as to the protectiveness of the layer.
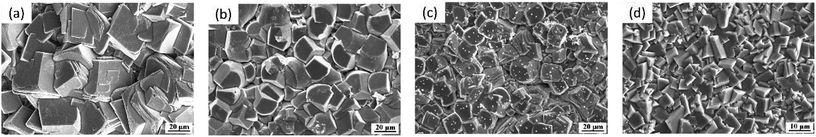 |
| | Fig. 3 Surface morphologies of N80 steel under various CO2 partial pressures at 100 °C: (a) 0.15 MPa; (b) 0.6 MPa; (c) 1 MPa; and (d) 4 MPa. | |
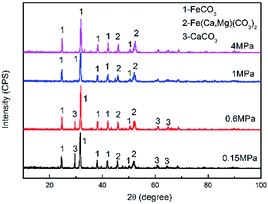
Fig. 4 shows the XRD patterns of the corrosion scale formed on the N80 steel at different CO2 partial pressures. The corrosion products were mainly composed of FeCO3 and Fe(Ca,Mg)(CO3)2. Minor amounts of CaCO3 were found on the steel surface. Owing to the isostructuralism of these carbonates, Ca2+ and Mg2+ are able to substitute themselves for Fe2+ in the FeCO3 structure and form complex carbonates,32 which is thermodynamically stable under the test conditions. The intensity of the CaCO3 peak decreased with the CO2 partial pressure. Which can be explained by the decrease in the solution pH as the CO2 partial pressure increased.
 |
| | Fig. 4 XRD patterns of the corrosion scale formed on N80 steel at various CO2 partial pressures. | |
EIS analyses
EIS provides insight into the corrosion processes occurring on the steel surface. The Nyquist plots of the N80 carbon steel at various CO2 partial pressures and 100 °C are shown in Fig. 5. The EIS curves showed three responses namely, one high-medium-frequency response and two low-frequency responses. The high-medium-frequency capacitive loop was caused by the corrosion product film, while the low-frequency capacitive loop was originated by the electric double layer. The electric double-layer capacitance was not constant and changed with frequency and the amplitude because of the dispersion on the electrode surface.33 The low-frequency inductive loop was caused by the adsorption of the intermediate product FeOHad on the bare substrate not covered by the corrosion scale. As shown in Fig. 5, the impedance amplitude decreased gradually and the curve shrunk inward with the CO2 partial pressure. Moreover, the inductive loop atrophied with the CO2 partial pressure.
 |
| | Fig. 5 EIS curves of N80 carbon steel at various CO2 partial pressures and 100 °C. | |
As shown in Fig. 6, the EIS plots were fitted by the equivalent circuit (EC), where Qdl is the constant phase element (CPE) representing the double charge layer capacitance; Rs and Rct are the electrolyte solution resistance and charge transfer resistance, respectively; Rpore is the pore resistance of the corrosion scale; and L and RL are inductance and inductive resistances, respectively. With regard to the corrosion film not being purely capacitive, Qf was selected to fit the film capacitance. The parameters obtained after the fitting are listed in Table 3. As shown in Table 3, the polarization resistance Rp (Rp = Rpore + Rct) of the N80 carbon steel decreased gradually with the CO2 partial pressure, indicating the corrosion processes enhanced. The inductance decreased from 119.6 to 1.62 H cm2, in accordance with the EIS curves. It's indicating that the coverage of the corrosion scale increased with the partial pressure of CO2. Note that Rpore decreased. It revealed that the formation of the corrosion scale on the steel matrix did not restrain the permeation of ions effectively as the partial pressure of CO2 increased.
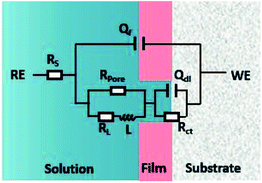 |
| | Fig. 6 Electrochemical equivalent circuit used for EIS fittings. | |
Table 3 Parameter values obtained after the fitting of the EIS results of Fig. 5
| PCO2, MPa |
Rs, Ω cm2 |
Qf |
Rpore, Ω cm2 |
RL, Ω cm2 |
L, H cm2 |
Qdl |
Rct, Ω cm2 |
| Y0 × 10−3 Ω cm−2 sn |
n |
Y0 Ω cm−2 sn |
n |
| 0.15 |
2.544 |
0.955 |
0.7893 |
67.72 |
173.3 |
119.6 |
0.20 |
0.6918 |
34.38 |
| 0.6 |
1.769 |
1.312 |
0.7779 |
22.93 |
107.5 |
9.5 |
2.62 |
1 |
4.86 |
| 1 |
2.095 |
1.259 |
0.7911 |
18.46 |
59.8 |
5.3 |
1.71 |
0.9403 |
6.22 |
| 4 |
2.486 |
0.755 |
0.827 |
12.52 |
77.0 |
1.6 |
1.14 |
0.7937 |
3.74 |
Polarization experiments
Fig. 7 shows the polarization curves of the N80 carbon steel at different CO2 partial pressures and 100 °C. As shown in Fig. 5, the cathodic current increased with the CO2 partial pressure. Unlike the cathodic reactions, the increase of CO2 partial pressure did not affect the anodic reactions significantly. We can conclude that the corrosion was mainly dominated by cathodic reactions.
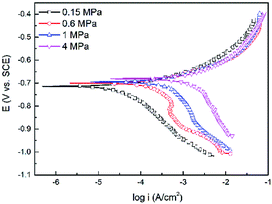 |
| | Fig. 7 Polarization curves of the N80 steel under various CO2 partial pressures at 100 °C. | |
Fitted kinetic parameters, corrosion potential (Ecorr) and corrosion current density (icorr) are listed in Table 4. The corrosion potential shifted towards the less negative values with the CO2 partial pressure. The corrosion current density increased from 48 to 2168 μA cm−2 as the CO2 partial pressure increased from 0.15 to 4 MPa, indicated that the corrosion processes enhanced at higher CO2 partial pressure. This trend was in agreement with the immersion results.
Table 4 Fitting parameters of the polarization curves of N80 steel under different CO2 partial pressures at 100 °C
| PCO2, MPa |
0.15 |
0.6 |
1 |
4 |
| Ecorr (mV) |
−714.7 |
−699.6 |
−693.6 |
−680.9 |
| icorr (μA cm−2) |
48 |
162 |
528 |
2168 |
Discussion
Corrosion reactions of the steel and formation of the main corrosion products in the CO2-containing oilfield formation water system
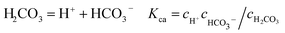
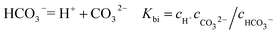
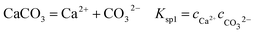
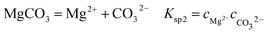
It is known that gaseous CO2 is not corrosive. Once CO2 dissolved in water, the vapor–liquid equilibrium of CO2 is reached, as expressed in Reaction (2). Despite the fact that only a small fraction of CO2 dissociates in water to form carbonic acid (Reaction (3)). The as-formed acid is more corrosive to steel than a completely dissociated acid at the same pH.17,34 It is diprotic and therefore dissociates in two steps (Reactions (4) and (5)). The dissociation of water (Reaction (6)) is also included. The presence of Ca2+ and Mg2+ ions in the formation water can result in the precipitation of calcium carbonate (CaCO3) and magnesium carbonate (MgCO3) (Reactions (7) and (8), respectively), which may affect the ionic equilibrium. The related equilibrium equations are:| | |
CO2(g) = CO2(aq) Ksol = cCO2/(φ × pCO2)
| (2) |
| | |
CO2(aq) + H2O = H2CO3 Khy = cH2CO3/cCO2
| (3) |
| |
 | (4) |
| |
 | (5) |
| | |
H2O = H+ + OH− Kwa = cH+cOH−
| (6) |
| |
 | (7) |
| |
 | (8) |
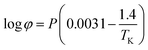
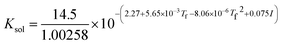
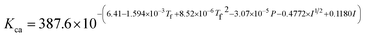
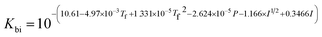
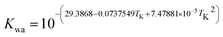
where Ksol and Khy are the solubility and hydrolysis constants of CO2, respectively; Kca, Kbi, and Kwa are the dissociation constants of reactions (4)–(6), respectively; Ksp1 and Ksp2 are the solubility product constants of CaCO3 and MgCO3, respectively. These constants can be calculated by formulae listed in Table 5, where φ is the fugacity coefficient defined in eqn (9);35 PCO2 is the CO2 partial pressure in psi; P is the total pressure in psi; Tk is the Kelvin temperature in K; and Tf is the Fahrenheit temperature in °F.| |
 | (9) |
Table 5 Formulae used for the calculation of the reaction equilibrium constants35,36
| Formula |
Reaction |
 |
(2) |
| Khy = 2.58 × 10⁻³ |
(3) |
 |
(4) |
 |
(5) |
 |
(6) |
| Ksp1 = 5.288 × 10⁻¹⁰ |
(7) |
| Ksp2 = 4.781 × 10⁻⁸ |
(8) |
The ionic strength of a solution is defined as:
| |
 | (10) |
where
mi is the concentration of species in the aqueous solution in mol L
−1 and
zi is the charge of these species.
With regard to the species NaCl, KCl, and Na2SO4 dissociated in the solution completely without affecting the electro-neutrality, and the condition of electronical neutrality provides the following relationship:
| |
 | (11) |
where
cNa+ is the concentration of Na
+ from dissociated NaHCO
3 (9.836 × 10
−3 mol L
−1),
cCl− is the Cl
− concentration from dissociated CaCl
2 and MgCl
2.
cH+,
cOH−,

,
cCa2+,
cMg2+, and

are the equilibrium concentrations of H
+, OH
−, HCO
3−, Ca
2+, Mg
2+, and CO
32−, respectively. The concentrations of CO
2 and H
2CO
3 in solution can be derived by Reactions
(2) and
(3) and
eqn (9) and
(10). Combining
eqn (4)–(8) with
eqn (11), a quartic equation with only one variable,
cH+, can be derived:
| |
 | (12) |
Solving the above equation allows to obtain the concentration of H+. All the ionic concentration can be calculated by plugging the concentration of H+ for the equilibrium eqn (4)–(6), and the results are shown in Table 6. The calculated pH values were in well agreement with the measured values. The pH values and the amount of CO32− dissociated in the formation water decreased with the CO2 partial pressure, while the dissolved CO2, H2CO3, and HCO3− increased significantly.
Table 6 Ionic concentrations in the formation water (mol L−1) and pH values under various CO2 partial pressures at 100 °C
| PCO2, MPa |
cCO2 |
cH2CO3 |

|

|
cH+ |
cOH− |
pHcalculated |
pHmeasured |
| 0.15 |
1.31 × 10⁻² |
3.38 × 10⁻⁵ |
4.06 × 10⁻³ |
7.76 × 10⁻⁷ |
2.80 × 10⁻⁶ |
1.88 × 10⁻⁷ |
5.55 |
5.47 |
| 0.6 |
4.75 × 10⁻² |
12.26 × 10⁻⁵ |
7.63 × 10⁻³ |
7.55 × 10⁻⁷ |
5.43 × 10⁻⁶ |
9.69 × 10⁻⁷ |
5.27 |
5.31 |
| 1 |
7.26 × 10⁻² |
18.73 × 10⁻⁵ |
9.37 × 10⁻³ |
7.45 × 10⁻⁷ |
6.79 × 10⁻⁶ |
7.76 × 10⁻⁸ |
5.17 |
5.06 |
| 4 |
15.11 × 10⁻² |
38.99 × 10⁻⁵ |
1.33 × 10⁻² |
7.22 × 10⁻⁷ |
1.02 × 10⁻⁵ |
5.15 × 10⁻⁸ |
4.99 |
4.88 |
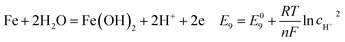
According to corrosion thermodynamics, the Nernst-equation can be used to illustrate the acceleration effect of the CO2 partial pressure on the cathodic reactions. The possible cathodic reactions35,37,38 taking place on N80 steel in CO2-saturated formation water are eqn (13)–(16):
| |
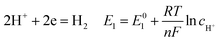 | (13) |
| |
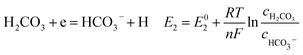 | (14) |
| |
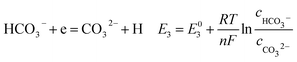 | (15) |
| |
 | (16) |
where
E0 is the potential in standard conditions in V;
R is the gas constant (8.314 J mol
−1 K
−1);
T is temperature in K;
n is the number of electrons flowing through the corrosion cell; and
F is the Faraday constant and equals to 96
![[thin space (1/6-em)]](https://www.rsc.org/images/entities/char_2009.gif)
500 C.
During the steel corrosion processes, iron dissolved forming corrosion products on the surface of the electrode according to the following reactions:8,38–40
| |
 | (17) |
| |
 | (18) |
| |
 | (19) |
| |
 | (20) |
| |
 | (21) |
As shown in Table 8, the standard electrode potential of all the reactions (E0) can be calculated by eqn (22) and (23) that combines the standard Gibbs free energy of the reactants (ΔG0f,products) or products (ΔG0f,reactions) listed in Table 7. Then, we substitute the calculated standard electrode potential into eqn (13)–(21) to obtain the equilibrium electrode potentials of the possible reactions at different CO2 partial pressures, which Table 9. It should be pointed out that Reaction (17) was not included in the equilibrium potential calculation because the concentration of ferrous ions at the initial stage of corrosion is low and unknown, which can be considered negligible.
| | |
ΔG = ∑vΔG0f,products − ∑vΔG0f,reactions
| (22) |
| |
 | (23) |
Table 7 Standard Gibbs free energy of the species in the formation water34
| Species |
ΔG0f (kJ mol−1) |
Species |
ΔG0f (kJ mol−1) |
| H+ |
0 |
Fe |
0 |
| H2O (l) |
−237.129 |
Fe2+ (aq) |
−78.90 |
| H2CO3 (aq) |
−623.08 |
FeCO3 (s) |
−666.67 |
| HCO3− (aq) |
−586.77 |
Fe(OH)2 |
−486.5 |
| CO32− (aq) |
−527.81 |
OH− (aq) |
−157.244 |
Table 8 Standard electrode potential of all the possible reactions (V)
| E01 |
E02 |
E03 |
E04 |
E05 |
E06 |
E07 |
E08 |
E09 |
| 0 |
−0.34 |
−0.61 |
−0.83 |
−0.44 |
−0.23 |
−0.41 |
−0.72 |
−0.06 |
Table 9 Equilibrium electrode potential of the possible reactions (13)–(21) in the CO2-saturated formation water at 100 °C (V)
| PCO2, MPa |
E1 |
E2 |
E3 |
E4 |
E6 |
E7 |
E8 |
E9 |
| 0.15 |
−0.6520 |
−0.7719 |
−0.5767 |
−0.5721 |
−0.7116 |
−0.7720 |
−0.7339 |
−0.7154 |
| 0.6 |
−0.6307 |
−0.7508 |
−0.5556 |
−0.5508 |
−0.7110 |
−0.7715 |
−0.7334 |
−0.6941 |
| 1 |
−0.6236 |
−0.7438 |
−0.5585 |
−0.5437 |
−0.7106 |
−0.7712 |
−0.7332 |
−0.6870 |
| 4 |
−0.6104 |
−0.7316 |
−0.5362 |
−0.5305 |
−0.7092 |
−0.7703 |
−0.7327 |
−0.6738 |
Fig. 8 compares the measured corrosion potential from Fig. 7, Ecorr, and the calculated equilibrium potential of each possible reaction as a function of the CO2 partial pressure. According to the mixed potential theory, only anodic reactions with potentials more negative than Ecorr and cathodic reactions with potentials more positive than Ecorr can occur. According to this theory, all the cathodic reactions which is shown in Fig. 8(a) can take place with the exception of Reaction (14), the reduction of H2CO3 to generate bicarbonate ions, because the equilibrium potential of Reaction (14) is more negative than the corrosion potential. Therefore, the cathodic reactions of N80 steel in the CO2−containing formation water included the reduction of H+, HCO3−, and H2O. However, the reduction of water shows much slower reaction kinetics, resulting in minimal contribution to the total cathodic reaction.9 As shown in Fig. 8(b), all the anodic reactions can take place. It should be pointed out that Reaction (21) can occur only at CO2 partial pressures lower than 1 MPa. Therefore, the anodic reactions taking place on N80 in the CO2-containing formation water included the direct dissolution of iron (Reaction (17)), the formation of FeCO3 scale (Reactions (18)–(20)), and the hydrolysis of iron (Reaction 21) at CO2 partial pressures lower than 1 MPa. However, although the equilibrium potential of Reaction (20) is more negative than Ecorr, this reaction is ignorable because of its low reaction kinetics as a result of the extremely low concentration of CO32− ions.35
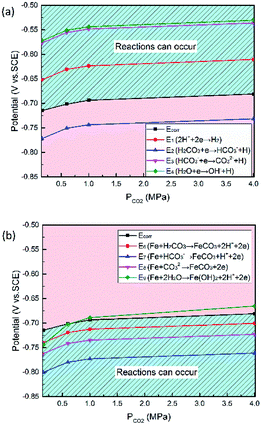 |
| | Fig. 8 Comparison of the measured corrosion potential (Ecorr) and the calculated equilibrium potential of anodic (a) and cathodic (b) reactions as a function of the CO2 partial pressure. | |
Corrosion mechanism of the steel in the CO2-containing oilfield formation water system
At low CO2 partial pressures, the amount of dissociated HCO3− and CO32− is limited. The reduction of H+ ions became the dominant cathodic reaction and the cathodic polarization curves were under charge transfer control. The concentration of HCO3− (Table 6) increased with the CO2 partial pressure and more HCO3− ions transferred from the solution to the matrix surface, accelerating the cathodic reactions to generate CO32− in solution. Therefore, higher CO2 partial pressures resulted in higher corrosion rates not only as a result of the lower pH value but also by increasing the rate of the bicarbonate reduction process.10 Then the supersaturation and precipitation rates of FeCO3 were also accelerated correspondingly. The coverage of the corrosion scale increased. Burkle41 was also discussed the morphology and development of the FeCO3 crystals over time. Burkle stated that the steel surface was almost entirely covered by FeCO3 crystals after several hours of exposure. According to the Faraday admittance reported by Cao42 and Zhu,25 as the coverage rate (θ) of the corrosion scale increases, the inductance loop becomes smaller, which is pretty much in line with the herein obtained Nyquist plots.
The precipitation of FeCO3 crystal involves two steps namely, nucleation and particle growth. Supersaturation levels exceeding 1 initiated the nucleation of FeCO3. Nesic43 pointed out that higher PCO2 leads to a higher supersaturation which accelerates FeCO3 precipitation and scale growth. Once stable nuclei were formed, crystal growth is then dominant process.9 Therefore, high nucleation rate led to crystalline films with small and fine grains at high CO2 partial pressures. In contrast, a rather rough scale with large grains was formed at low CO2 partial pressures because of the low original nucleation rates resulted in relatively large spaces between the FeCO3 grains.
However, the corrosion scales became denser but the corrosion rate at high CO2 partial pressures increased, which implied that this dense scale did not protect the steel matrix effectively. The decrease of pore resistance verified this point and the observations from Gao, et al.14 suggest similar effects that thicker and denser scale formed on pipeline carbon steel have poor protectiveness.
Conclusions
In this study, the effect of high CO2 partial pressures on the corrosion behaviour of carbon steel in the formation water system at 100 °C was investigated by various electrochemical measurements and surface analysis, combined with thermodynamic calculations of the potential anodic/cathodic reactions. Based on the electrochemical and theoretical results, the following conclusions can be drawn:
(1) The corrosion potentials were calculated for each possible anodic/cathodic reaction. The anodic reactions of the steel included the direct dissolution of Fe, the formation of FeCO3 scale, and the hydrolysis of Fe up to 1 MPa of CO2. The cathodic reactions included the reduction of H+, HCO3−, and H2O.
(2) The anodic reactions were not affected by the CO2 partial pressure significantly, while the cathodic reactions were strongly enhanced via reduction of the pH and increase of the rate of bicarbonate reduction.
(3) The concentration of HCO3− increased with the CO2 partial pressure, and the precipitation rate of FeCO3 were also accelerated. Small and fine FeCO3 scale grains were formed on the steel surface at high CO2 partial pressure. This scale showed poor protectiveness and the CO2 corrosion processes was enhanced as a result.
Conflicts of interest
There are no conflicts to declare.
Acknowledgements
This work was financial supported by the National Science and Technology Major Project of China (Grant No. 2016ZX05028-004).
References
- A. Kahyarian, M. Achour and S. Nesic, in Trends in Oil and Gas Corrosion Research and Technologies, 2017, pp. 149–190 Search PubMed.
- P. Sui, J. Sun, Y. Hua, H. Liu, M. Zhou, Y. Zhang, J. Liu and Y. Wang, Int. J. Greenhouse Gas Control, 2018, 73, 60–69 CrossRef CAS.
- S. Nesic, Corros. Sci., 2007, 49, 4308–4338 CrossRef CAS.
- M. H. Sk, A. M. Abdullah, M. Ko, B. Ingham, N. Laycock, R. Arul and D. E. Williams, Corros. Sci., 2017, 126, 26–36 CrossRef CAS.
- J. Han, J. Zhang and J. W. Carey, Int. J. Greenhouse Gas Control, 2011, 5, 1680–1683 CrossRef CAS.
- D. Dwivedi, K. Lepkova and T. Becker, RSC Adv., 2017, 7, 4580–4610 RSC.
- M. B. Kermani and A. Morshed, Corrosion, 2003, 59, 659–683 CrossRef CAS.
- B. R. Linter and G. T. Burstein, Corros. Sci., 1999, 41, 117–139 CrossRef CAS.
- R. Barker, D. Burkle, T. Charpertier, H. Thompson and A. Neville, Corros. Sci., 2018, 142, 312–341 CrossRef CAS.
- G. Schmitt and M. Horstemeier, in Corrosion 2006, NACE International, 2006 Search PubMed.
- G. Schmitt, in Corrosion 2015, NACE International, 2015 Search PubMed.
- A. Dugstad, in Corrosion 2006, NACE international, 2006 Search PubMed.
- R. Barker, Y. Hua and A. Neville, Int. Mater. Rev., 2017, 62, 1–31 CrossRef CAS.
- K. Gao, F. Yu, X. Pang, G. Zhang, L. Qiao, W. Chu and M. Lu, Corros. Sci., 2008, 50, 2796–2803 CrossRef CAS.
- M. Gao, X. Pang and K. Gao, Corros. Sci., 2011, 53, 557–568 CrossRef CAS.
- S. Nesic, J. Postlethwaite and S. Olsen, Corrosion, 1996, 52, 280–294 CrossRef CAS.
- J. M. Bockris and D. Drazic, Electrochim. Acta, 1962, 7, 293–313 CrossRef CAS.
- S. Nesic, N. Thevenot, J. L. Crolet and D. Drazic, in Corrosion 1996, NACE International, 1996 Search PubMed.
- T. D. C. Almeida, M. C. E. Bandeira, R. M. Moreira and O. R. Mattos, Corros. Sci., 2017, 120, 239–250 CrossRef.
- H. Liu, T. Gu, G. Zhang, G. Liu and Y. Cheng, Corros. Sci., 2018, 136, 47–59 CrossRef CAS.
- H. M. Ezuber, Mater. Des., 2009, 30, 3420–3427 CrossRef CAS.
- G. Schmitt, in Corrosion 1985, NACE International, 1985 Search PubMed.
- R. Nyborg and A. Dugstad, in Corrosion 1998, NACE International, 1998 Search PubMed.
- M. B. Tomson and M. L. Johnson, in SPE 1991, SPE International, 1991 Search PubMed.
- S. Zhu, A. Fu, J. Miao, Z. Yin, G. Zhou and J. Wei, Corros. Sci., 2011, 53, 3156–3165 CrossRef CAS.
- Z. Qiu, C. Qiong, Z. Chang, Z. Zhao, C. Zhao and Z. Ye, Petroleum Exploration and Development, 2012, 39, 256–260 CrossRef.
- K. Videm and A. Dugstad, in Corrosion 1988, NACE International, 1988 Search PubMed.
- A. B. Gavanluei, B. Mishra and D. L. Olson, in Corrosion 2013, NACE International, 2013 Search PubMed.
- ASTM G1-03, in Standard, ASTM International, 2017 Search PubMed.
- S. Arumugam, N. Tajallipour and P. J. Teevens, in Corrosion 2014, NACE International, 2014 Search PubMed.
- Y. Sun and S. Nesic, in Corrosion 2004, NACE International, 2004 Search PubMed.
- Y. Hua, A. Shamsa, R. Backer and A. Neville, Appl. Surf. Sci., 2018, 455, 667–682 CrossRef CAS.
- W. Wang, W. Yan, L. Zhu, P. Hu, Y. Shan and K. Yang, Mater. Des., 2009, 30, 3436–3443 CrossRef CAS.
- S. Nesic, M. Nordsveen, R. Nyborg and A. Stangeland, in Corrosion 2001, NACE International, 2001 Search PubMed.
- G. Zhang and Y. Cheng, Corros. Sci., 2009, 51, 87–94 CrossRef CAS.
- P. Atkin and J. D. Paula, Physical Chemistry, Oxford university press, Oxford, 8th edn, 2006 Search PubMed.
- B. Wang, L. Xu, G. Liu and M. Lu, Corros. Sci., 2018, 136, 210–220 CrossRef CAS.
- L. Wei, X. Pang and K. Gao, Corros. Sci., 2016, 111, 637–648 CrossRef CAS.
- D. H. Davies and G. T. Burstein, Corrosion, 1980, 36, 416–422 CrossRef CAS.
- G. Zhang, Y. Zeng, X. Guo, F. Jiang, D. Shi and Z. Chen, Corros. Sci., 2012, 65, 37–47 CrossRef CAS.
- D. Burkle, R. D. Motte, W. Taleb, A. Kleppe, T. Comyn, S. M. Vargas, A. Neville and R. Barker, Electrochim. Acta, 2017, 255, 127–144 CrossRef CAS.
- C. Cao, Electrochim. Acta, 1990, 35, 837–844 CrossRef CAS.
- S. Nesic and K. L. J. Lee, Corrosion, 2003, 59, 616–628 CrossRef CAS.
|
| This journal is © The Royal Society of Chemistry 2019 |
Click here to see how this site uses Cookies. View our privacy policy here. 
 Open Access Article
 This Open Access Article is licensed under a Creative Commons Attribution-Non Commercial 3.0 Unported Licence
 a,
Dapeng Lib,
Lei Zhang
a,
Dapeng Lib,
Lei Zhang


 , cCa2+, cMg2+, and
  are the equilibrium concentrations of H+, OH−, HCO3−, Ca2+, Mg2+, and CO32−, respectively. The concentrations of CO2 and H2CO3 in solution can be derived by Reactions (2) and (3) and eqn (9) and (10). Combining eqn (4)–(8) with eqn (11), a quartic equation with only one variable, cH+, can be derived: