
 Open Access Article
 This Open Access Article is licensed under a Creative Commons Attribution-Non Commercial 3.0 Unported Licence
Improvement of activated sludge dewatering properties using green conditioners: chitosan hydrochloride and lysozyme†
Feng Lin ,
Xiaolin Zhu,
Yong Luo,
Peiran Yu and
Mengru Liu*
,
Xiaolin Zhu,
Yong Luo,
Peiran Yu and
Mengru Liu*
State Key Laboratory of Pulp and Paper Engineering, School of Light Industry and Engineering, South China University of Technology, Guangzhou 510640, China. E-mail: lmr@scut.edu.cn
First published on 28th February 2019
Abstract
In this study, the effects of chitosan hydrochloride (CTSCL), lysozyme (LZM) and cationic polyacrylamide (CPAM) as conditioners on the dewatering performance of activated sludge were comparatively investigated in terms of the capillary suction time (CST), specific resistance to filtration (SRF) and water content after conditioning and subsequent dewatering. CTSCL showed nearly the same capacity to improve the sludge dewaterability as CPAM, with CTSCL and CPAM conditioning resulting in the SRF of sludge decreasing by 95.82% and 96.15%, CST decreasing by 78.22% and 84.88%, and water content of the dewatered sludge decreasing by 10.84% and 8.5%, respectively. However, LZM conditioning exhibited the best improvement in the dewatering extent, which could decrease the water content of dewatered sludge by 19.84%. In addition, the evolution of the physical properties, extracellular polymeric substance content and composition, and the sludge floc morphology were analyzed to explain the sludge conditioning mechanism. Both CTSCL and CPAM could extrude sludge surface bound water into free water, produce sludge flocs with a larger size and more surface pores and finally improve the sludge filterability. In comparison with chemical flocculants, the conditioning mechanism of LZM was distinctly different, which effectively decomposed cell walls, released the internal bound water beneficial for improving the sludge dewatering extent, while the released organic substances clogged the floc surface, and the high proportion of fine particles in the flocs resulted in poorer filtration.
1. Introduction
With the rapid rise of sewage amounts and treatment rates, subsequent sludge treatment and disposal problems are becoming increasingly apparent. The high water content of over 95%, huge volume, and difficulties in transportation accompanied with sludge would bring about serious secondary pollution to the environment if not appropriately dealt with. Therefore, it is necessary to carry out sludge dewatering prior to sludge treatment and disposal.1,2Sludge is a heterogeneous colloidal system containing microorganisms, refractory organics and some heavy metals that form a stable suspension in water.2 The microorganisms are embedded in a matrix of extracellular polymeric substances (EPS) that consists of miscellaneous organic substances such as proteins (PN), polysaccharides (PS) and humic acid.3–5 Both EPS and water within the EPS structure account for approximately 80% of the total sludge mass,6,7 which is a major obstacle hindering the volume reduction of sludge. In addition, the EPS usually occur as highly hydrated capsules surrounding cell walls and contain many hydrophilic functional groups, such as –COOH and –OH, which can change the surface characteristics of sludge particles.8,9 Consequently, the presence of negative charge carried by EPS have the sludge particles to be negatively charged, thus forming a stable and electrically exclusive colloid system in which the hydrated sludge structure is maintained, and the release of water and other components such as PN, PS and heavy metals is effectively prevented.10 As a result, the separation of solid liquid in activated sludge is particularly difficult.
The rate of sludge dewatering could be improved efficiently if the sludge was regulated before dewatering. The addition of organic polymers and inorganic coagulants, such as cationic polyacrylamide (CPAM), polyferric chloride and lime, could agglomerate the fine sludge colloids into large flocs through electrical neutralization and bridging action, which was easily separated from the water.11–13 At present, the sludge utilization means of activated sludge are combustion to generate electricity, dunghill for soil and making building materials, so nonbiodegradable conventional conditioners may result in pollution issues, such as biological toxicity, and thereby limit the subsequent utilization of the sludge. Thus, it is imperative to explore efficient and environmentally friendly conditioners for sludge dewatering.
Green conditioners, such as natural organic polymer flocculants and enzymes, is concerned gradually in sludge dewatering owing to their superiority, nontoxicity and biodegradability.13 Zemmouri et al.14 reported that natural chitosan showed the same efficiency in the field of sludge conditioning as synthetic polymer (SedCF802). However, there remains the issue of the poor solubility of chitosan in water, which is inconvenient for practical applications. Then, Huang et al.15 tried to synthesize a new hydrophobic cationic chitosan flocculant with better water solubility in comparison with chitosan; however, the synthetic process is so complicated that the new chitosan flocculant is not suitable for large-scale applications. Until recently, chitosan hydrochloride (CTSCL) was known as a cationic chitosan derivative without complex synthesis process, which was easily dissolved in water and possessed the advantages of chitosan.16 Currently, the flocculation performance of CTSCL has been used in the removal of humic acids from water, and its effectiveness could approach 95–100%.17 However, there are few reports on the application of CTSCL as a sludge conditioner.
Chemical conditioners commonly accelerate the removal rate of water but hardly influence the destruction of the structure of EPS,18 which was thought to play a critical role in the sludge filtering performance. Consequently, researchers have recently paid more attention to the various enzymes responsible for releasing the bound water from sludge flocs by the degradation of EPS and the lysis of biological cells.19,20 Chen et al.21 found that the application of compound enzymes (protease and α-amylase) disrupted EPS structure and got the dewatered sludge with higher solid content, while the reaction time of was 4 h, not convenient for practical application. Compared with the protease and amylase, lysozyme (LZM), could effectively and quickly destroy the β-1,4-glucoside bond, which connects N-acetylmuramic acid and N-acetylglucosamine in the cytoderm, and then decompose the insoluble mucopolysaccharide into a soluble peptide. These would lead to the lysis of bacteria, and finally disrupt the EPS structure.6 He et al.19 have found that LZM destroyed the microbial cell wall to result in the release of intracellular soluble substances, which had a strong potential to disintegrate activated sludge. However, sludge dewatering properties of the pulp and paper mill were investigated by Bonilla et al.,22 who found that both active and inactive LZM exhibited similar reinforcement of the sludge dewaterability, and the conclusion insisted on there was little difference between the conditioning mechanisms of LZM and chemical flocculants. Our new experimental discoveries about the performance of LZM during sludge conditioning contradict the latter point.
To investigate the feasibility of improving the activated sludge dewaterability on the basis of green conditioning, this paper compared the conditioning effect of CTSCL and LZM with that of CPAM using activated sludge (activated sludge collected from the secondary sedimentation tank) as the research object. In addition, the relevant conditioning mechanism in improving the sludge dewatering performance is expected to be elucidated.
2. Materials and methods
2.1 Materials
2.2. Methods
The enzyme activity (units per mL) was calculated as follows:
The capillary suction time (CST) was measured using a CST instrument (304 M, Triton Electronics Ltd., Dunmow, UK).
As shown in Fig. S2†, a lab-scale pressure filtration system, featured a hydraulic drive piston which could move up and down in an enclosed space, was used for sludge dewatering. The detailed operation process of the sludge deep dewatering was introduced in ESI, Text S2.†
The bound water content was analyzed according to a modified thermal analytical approach.24 The sludge sample of 10 mg was first cooled from 25 °C to −25 °C at a rate of −2 °C min−1 and the released heat (mJ) was recorded, assuming that all the free water was frozen at −25 °C except bound water. The sludge sample was then heated from −25 °C to 25 °C at a heating rate of +2 °C min−1. And the heat uptake during phase transition of bound water (WB) can be calculated with the following equation:
| WB = WT − ΔH/ΔH0 |
2.2.4.1 EPS extraction. The soluble EPS (S-EPS), loosely bound EPS (LB-EPS) and tightly bound EPS (TB-EPS) from the sludge were separated using a series of methods that comprised centrifugation, ultrasonication, and thermal extraction.25 The specific process was shown in ESI, Text S3.†
2.2.4.2 EPS analysis. The PN concentration in the extracted EPS was measured by the Coomassie brilliant blue method with bovine serum albumin (BSA) as a standard.26 The PS concentration of the EPS was determined using the anthrone method with a glucose standard.27 The DNA content in the S-EPS was analyzed using the modified diphenylamine method with calf thymus DNA sodium as the standard.28 Then the PN, PS and DNA were analyzed using a UV/VIS spectrophotometer (TU-1080, Beijing Purkinje General Instrument, China). The accuracy of the standard curve for the three parameters reached 99.60% and pure water was used to “zero” the spectrophotometer. Also a blank test with only LZM was used to exclude the effect of LZM on PN concentration.
2.2.4.3 Three-dimensional excitation emission matrix (3D-EEM). A fluorescence spectrophotometer (F-7000, Hitachi, Japan) was used to analyze the organic matter in each layer of the EPS. The excitation (Ex) wavelengths ranged from 200 to 400 nm, and the emission (Em) wavelengths varied from 200 to 500 nm. The sampling intervals were all at 5 nm. And the scanning speed was 12
![[thin space (1/6-em)]](https://www.rsc.org/images/entities/char_2009.gif) 000 nm min−1, with 5 nm of excitation and emission slit bandwidths.8 The spectrum of deionized water was regarded as the blank before the determination of all the samples, which were then deducted from all data used for plotting. Specially, the spectrum of LZM solution was regarded as another blank before the determination of the LZM-conditioned samples.
000 nm min−1, with 5 nm of excitation and emission slit bandwidths.8 The spectrum of deionized water was regarded as the blank before the determination of all the samples, which were then deducted from all data used for plotting. Specially, the spectrum of LZM solution was regarded as another blank before the determination of the LZM-conditioned samples.
2.3 Statistical analysis
Statistical analysis was carried out using the software Origin Pro 9.0 64 bit (Origin Pro Lab Corp., Northampton, MA, USA).3. Results and discussion
3.1 Effects of the different conditioners on sludge dewatering performance
For a long time, both SRF and CST, which are measures of the difficulty level of filtration, were commonly used to evaluate the sludge dewaterability in sewage treatment plants or research labs.18 Generally, lower SRF and CST mean better filtration performance.The change of the indexes with the increasing dosage of the different conditioners is shown in Fig. 1a–c. SRF, CST and water content simultaneously reached the minimum at the level 5 with the dosage of 2.5 mg g−1 dry solid (DS) CPAM, 15 mg g−1 DS CTSCL and 4.8 × 10⁶ U g−1 DS LZM with the activity of 1.6 × 10⁴ U mg−1, respectively. CTSCL showed nearly the same capacity to improve the sludge dewatering performance as CPAM, with CTSCL and CPAM conditioning resulting in the sludge SRF decreasing by 95.82% and 96.15%, CST decreasing by 78.22% and 84.88%, and water content of the dewatered sludge decreasing by 10.84% and 8.5%, respectively. In contrast, as shown in Fig. 1a–c, although both SRF and CST of the sludge conditioned with LZM were evidently higher than those of the others, the resulting water content of the dewatered sludge reached the lowest value of 58.54%, which could be ascribed to the destruction of microbial cell walls and the release of intracellular water into free water.21 The reason why the filtration performance was unsatisfactory after LZM conditioning is still unclear and needs further investigation.
 | ||
| Fig. 1 Effects of the different conditioners on sludge dewatering performance (a) SRF; (b) CST; (c) water content of the dewatered sludge. | ||
As a synthetic flocculant based on natural polymers, CTSCL showed considerable potency to condition the sludge as well as CPAM. In combination with its biodegradability, CTSCL is expected to be a promising substitute for conventional chemical flocculants if its cost can be reduced in future. In addition, LZM also exhibited unique superiority in improving the degree of sludge dewatering that could not be achieved with traditional chemical flocculants.
3.2 Effects of the different conditioners on particle size and zeta potential of sludge
As shown in Fig. 2a, both organic macromolecular flocculants, CPAM and CTSCL, displayed similar Dv [50] variation of the conditioned sludge particles when the conditioner dosage was increased, with maximum values of 227.81 μm and 105 μm, respectively. Because of the strong bridging effect of high molecular weight polymer, CPAM with a molecular weight of approximately 10–12 million was more beneficial for the formation of large flocs.29 In comparison, CTSCL with a molecular weight of approximately 200 thousand resulted in the weaker bridging effect, thereby producing relatively small particle size of sludge. In contrast, the Dv [50] remained approximately constant with increasing LZM dosage, far smaller than that of the sludge conditioned with polymeric flocculants. It was inferred that the poor filterability of the sludge conditioned with LZM was related to the high proportion of fine particle retention in the flocs, accompanied by the larger total specific surface area and more surface bound water, consistent with research by Raynaud et al.28 | ||
| Fig. 2 Effects of CPAM, CTSCL and LZM dosage on (a) Dv [50] and (b) zeta potential of sludge. | ||
Generally, activated sludge colloidal particles are negatively charged due to anionic functional groups, such as carboxyl, hydroxyl and phosphate groups.3,9 According to the traditional Derjaguin–Landau–Verwey–Overbeek (DLVO) theory,30 with the loss of negative surface charge and increase in zeta potential, the sludge flocs would be in a position to aggregate, settle down rapidly, and be dewatered more readily. As shown in Fig. 2b, there was a upward trend of the zeta potential value from −14.3 mV to −10.5 mV after conditioning by CPAM and to −8.6 mV by CTSCL, respectively. Notably, these observations were inconsistent with the results of particle size, which might be ascribed to the higher dosage of CTSCL (6-fold of that of CPAM), and the higher density of positive charge after CTSCL conditioning than that of CPAM conditioning, thus slightly enhancing the electrostatic neutralization effect.31 The above results also confirmed these organic polymer flocculants conditioned sludge and gave rise to aggregate mainly by means of the bridging action, using long chain-like molecular structure to form larger flocs, combined with a small contribution from electrostatic neutralization.
In sharp contrast, a significant shift in the zeta potential from −14.3 mV to 0.37 mV was observed along with the increase dosage of LZM from 0 to 8 × 10⁶ U g−1 DS. A possible explanation was after the destruction of cell walls and EPS structure by LZM conditioning, the cationic amino group contained in the PN molecule neutralized parts of the negative charges on the sludge surface, thus leading to the aggregation of sludge particles and the increase of zeta potential.32 However, the destruction of EPS structure also weakened the aggregation of sludge particles, consequently the Dv [50] was far smaller than that of the sludge conditioned with polymeric flocculants as shown in Fig. 2a. In combination with the optimum dewaterability in Fig. 1a–c was obtained at the dosage of 4.8 × 10⁶ U g−1 DS, corresponding to the zeta potential of −0.08 mV, and the result was in agreement with the literature, which discovered the best dewatering performance of activated sludge occurred at the zeta potential close to 0 mV (−0.4 ± 0.1 mV) after Fe(II)–S2O82− ozonation under 80 °C.30 Therefore, the contribution of electric neutralization could not be ignored with regards to LZM in improving the sludge dewaterability.
3.3 Effects of the different conditioners on chemical characteristics and sludge morphologies
 | ||
| Fig. 3 Effects of (a) CPAM, (b) CTSCL and (c) LZM dosage on the PN and PS concentration of the different fractions of EPS. | ||
By comparison, the PN concentration rose quickly to 51.64 mg g−1 DS from 1.15 mg g−1 DS after LZM conditioning as shown in Fig. 3c, and the PS concentration boosted to 37.22 mg g−1 DS from 1.84 mg g−1 DS in the S-EPS. From Fig. 4, it can be noticed that the DNA content increased and the bound water content decreased. All the experimental data confirmed that the cell walls were indeed destroyed after LZM conditioning, followed by the release of the substances inside the cells. On the one hand, amino acids with positive charge in the PN contained aliphatic and aromatic side chains including alanine, phenylalanine and tryptophan, which played a critical role in the hydrophobicity of the sludge surface.35 On the other hand, the PS contained negatively charged hydrophilic groups like carboxyl groups, which exerted an adverse influence on the dewatering performance of sludge. As the concentration of PN was more than that of PS,32 the dewaterability of the sludge after LZM conditioning was accordingly improved.
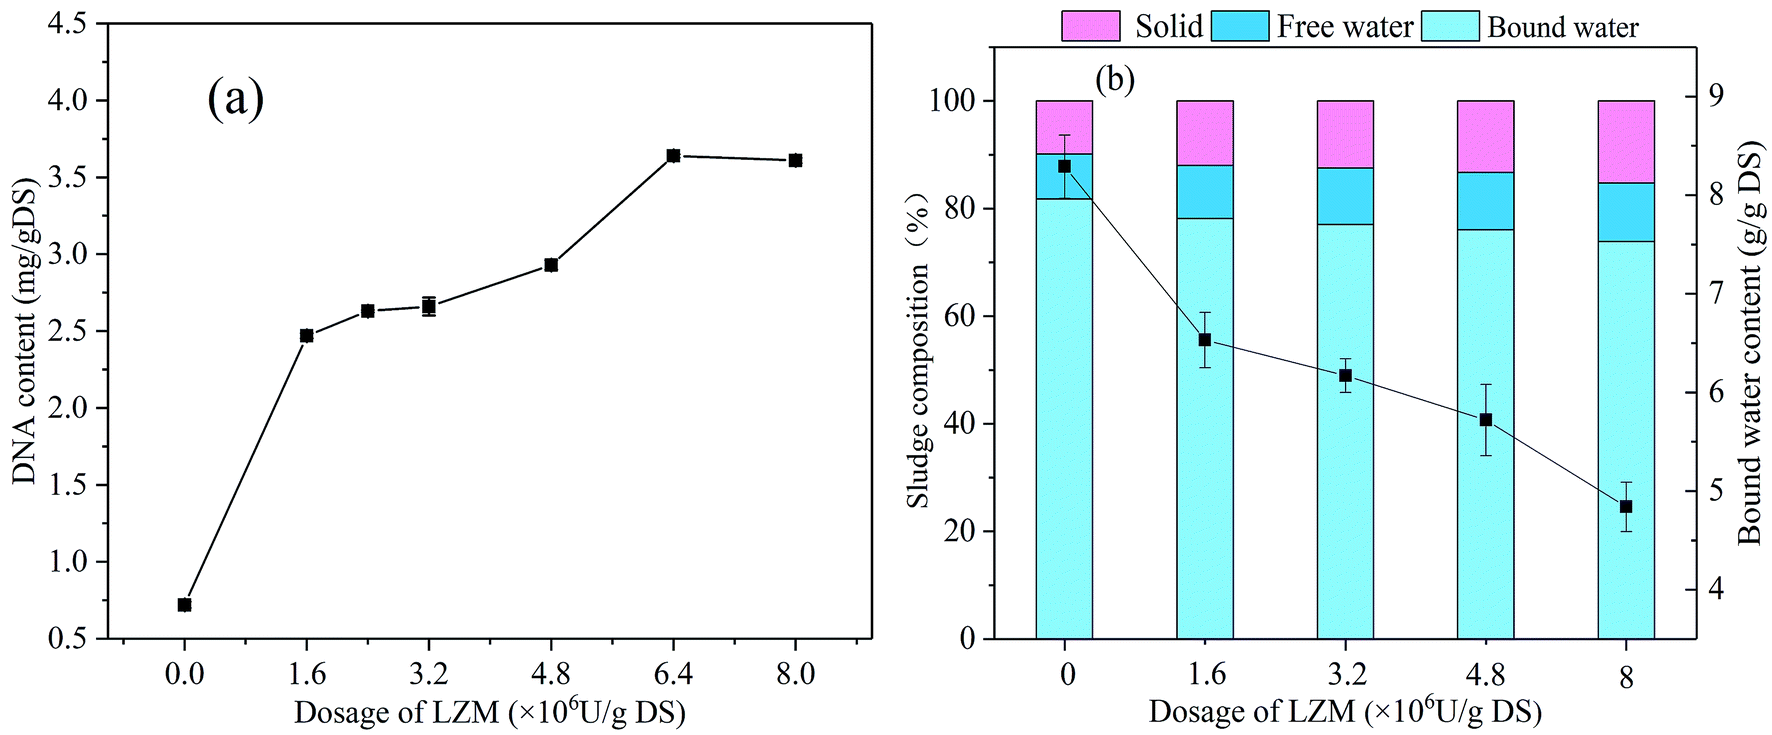 | ||
| Fig. 4 Effects of LZM dosage on sludge (a) DNA and (b) bound water content. | ||
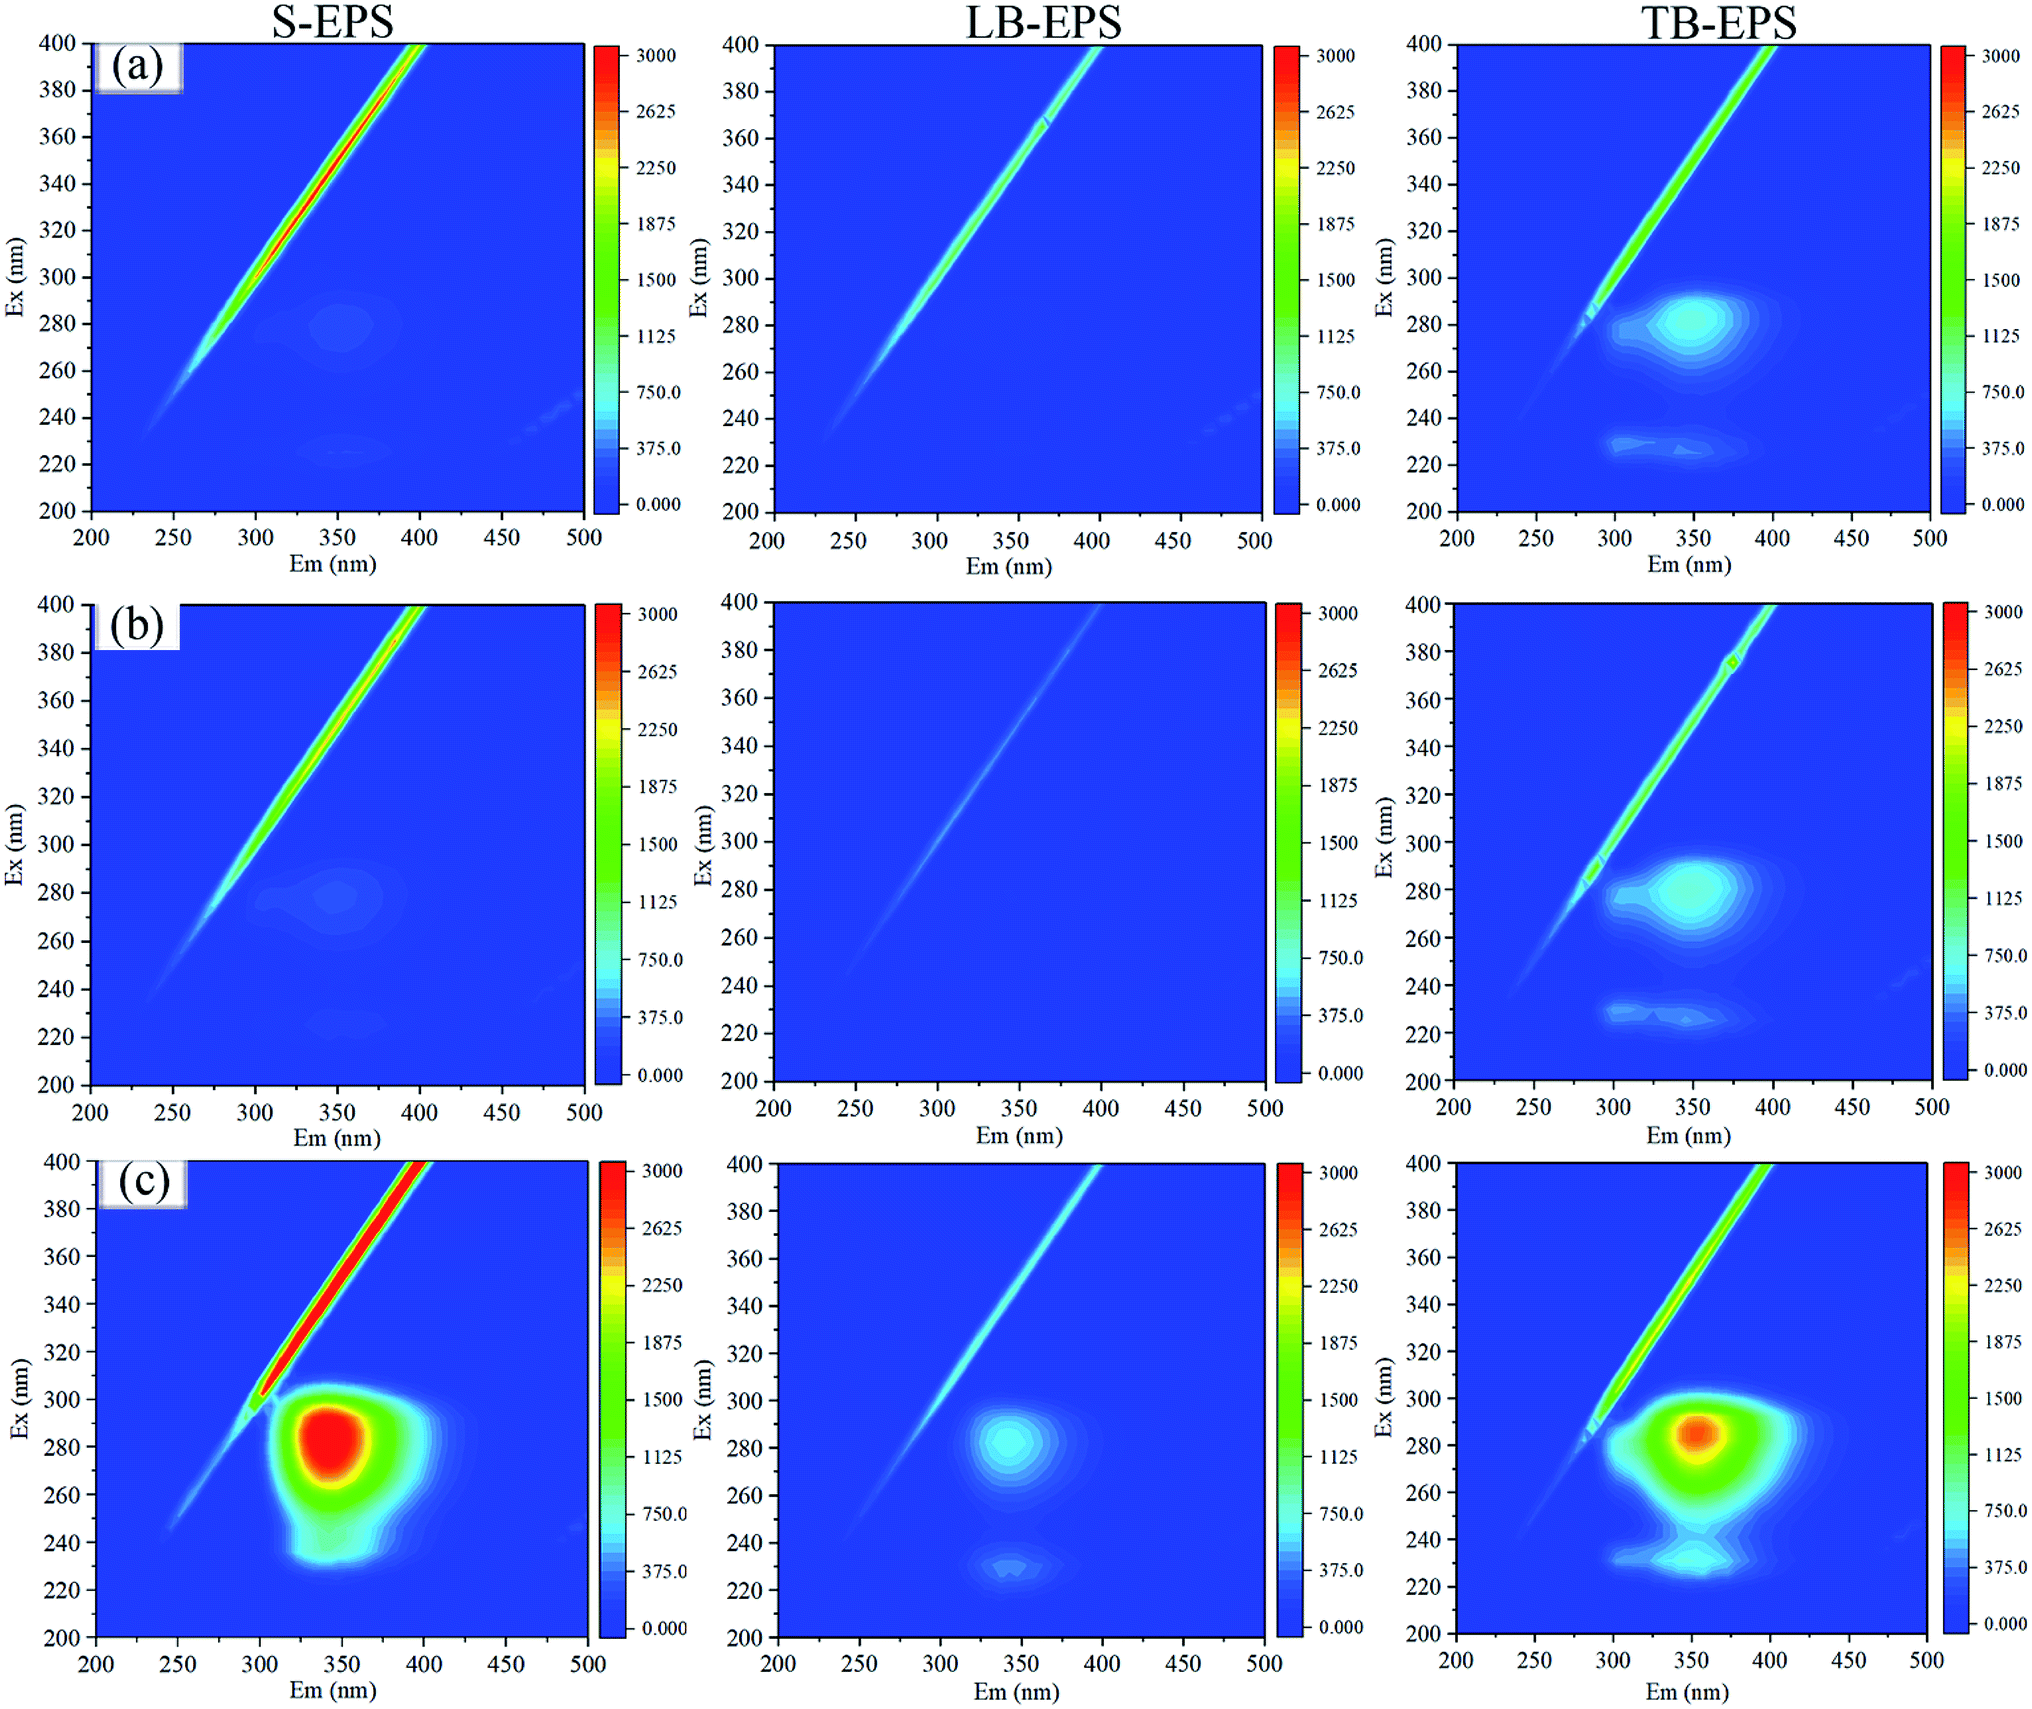 | ||
| Fig. 5 Influence of the different conditioners on EEM profiles of the different fractions of EPS: (a) raw sludge; (b) 15 mg g−1 DS CTSCL; (c) 4.8 × 10⁶ U g−1 DS LZM (with S-EPS, LB-EPS and TB-EPS samples diluted by 20 times). | ||
As shown in Table 1, with the rising dosage of CTSCL, the intensities of tryptophan-like and aromatic proteins in the EPS had few clear changes, corresponding to the almost constant level of the PN concentration in EPS. The intensity of tryptophan-like proteins in S-EPS dramatically rose to 3935.45 from 199.3 after LZM conditioning in Table 2, in comparison to that in LB-EPS and TB-EPS which ascended from 93.05 to 844.25 and 661.9 to 2236.45, respectively. It was noted that the fluorescence intensity of tryptophan-like proteins in the TB-EPS after LZM conditioning was much higher than that after CTSCL conditioning in Fig. 5, while the PN concentration in the TB-EPS were between those of sludge conditioned by LZM and CTSCL in Fig. 3. This is because EPS contained various kinds of PN with the luminophores and non-luminophores, while 3D-EEM can only detect the fluorescent functional groups in EPS and cannot quantitatively analyze and compare them with the total PN concentration.38
| Dosage (mg g−1 DS) | S-EPS | LB-EPS | TB-EPS | |||
|---|---|---|---|---|---|---|
| Tryptophan protein | Aromatic protein | Tryptophan protein | Aromatic protein | Tryptophan protein | Aromatic protein | |
| 0 | 199.30 | 136.00 | 93.05 | 64.19 | 661.90 | 404.50 |
| 2.5 | 211.70 | 176.00 | 68.35 | 44.86 | 613.30 | 395.40 |
| 15 | 251.20 | 169.7 | 60.29 | 23.33 | 707.60 | 414.90 |
| 30 | 260.70 | 176.00 | 72.08 | 38.87 | 790.00 | 484.20 |
| Dosage level (×106 U g−1 DS) | S-EPS | LB-EPS | TB-EPS | |||
|---|---|---|---|---|---|---|
| Tryptophan protein | Aromatic protein | Tryptophan protein | Aromatic protein | Tryptophan protein | Aromatic protein | |
| 0 | 199.30 | 176.00 | 93.05 | 64.19 | 661.90 | 404.50 |
| 1.6 | 208.64 | 166.83 | 91.56 | 58.77 | 1703.76 | 479.23 |
| 4.8 | 3279.26 | 203.31 | 675.56 | 55.41 | 2201.45 | 507.11 |
| 8 | 3935.45 | 225.71 | 844.25 | 62.65 | 2236.45 | 539.21 |
After a comprehensive analysis of Fig. 3c and Table 2, it could be inferred that the breakdown of cell walls after LZM conditioning not only released the bound water, which was beneficial for improving the dewatering performance, but also released organic substances. That is why both the SRF and CST of the sludge conditioned with LZM were higher than those of the sludge conditioned with chemical conditioners, while the water content of the sludge cake reached the lowest value.
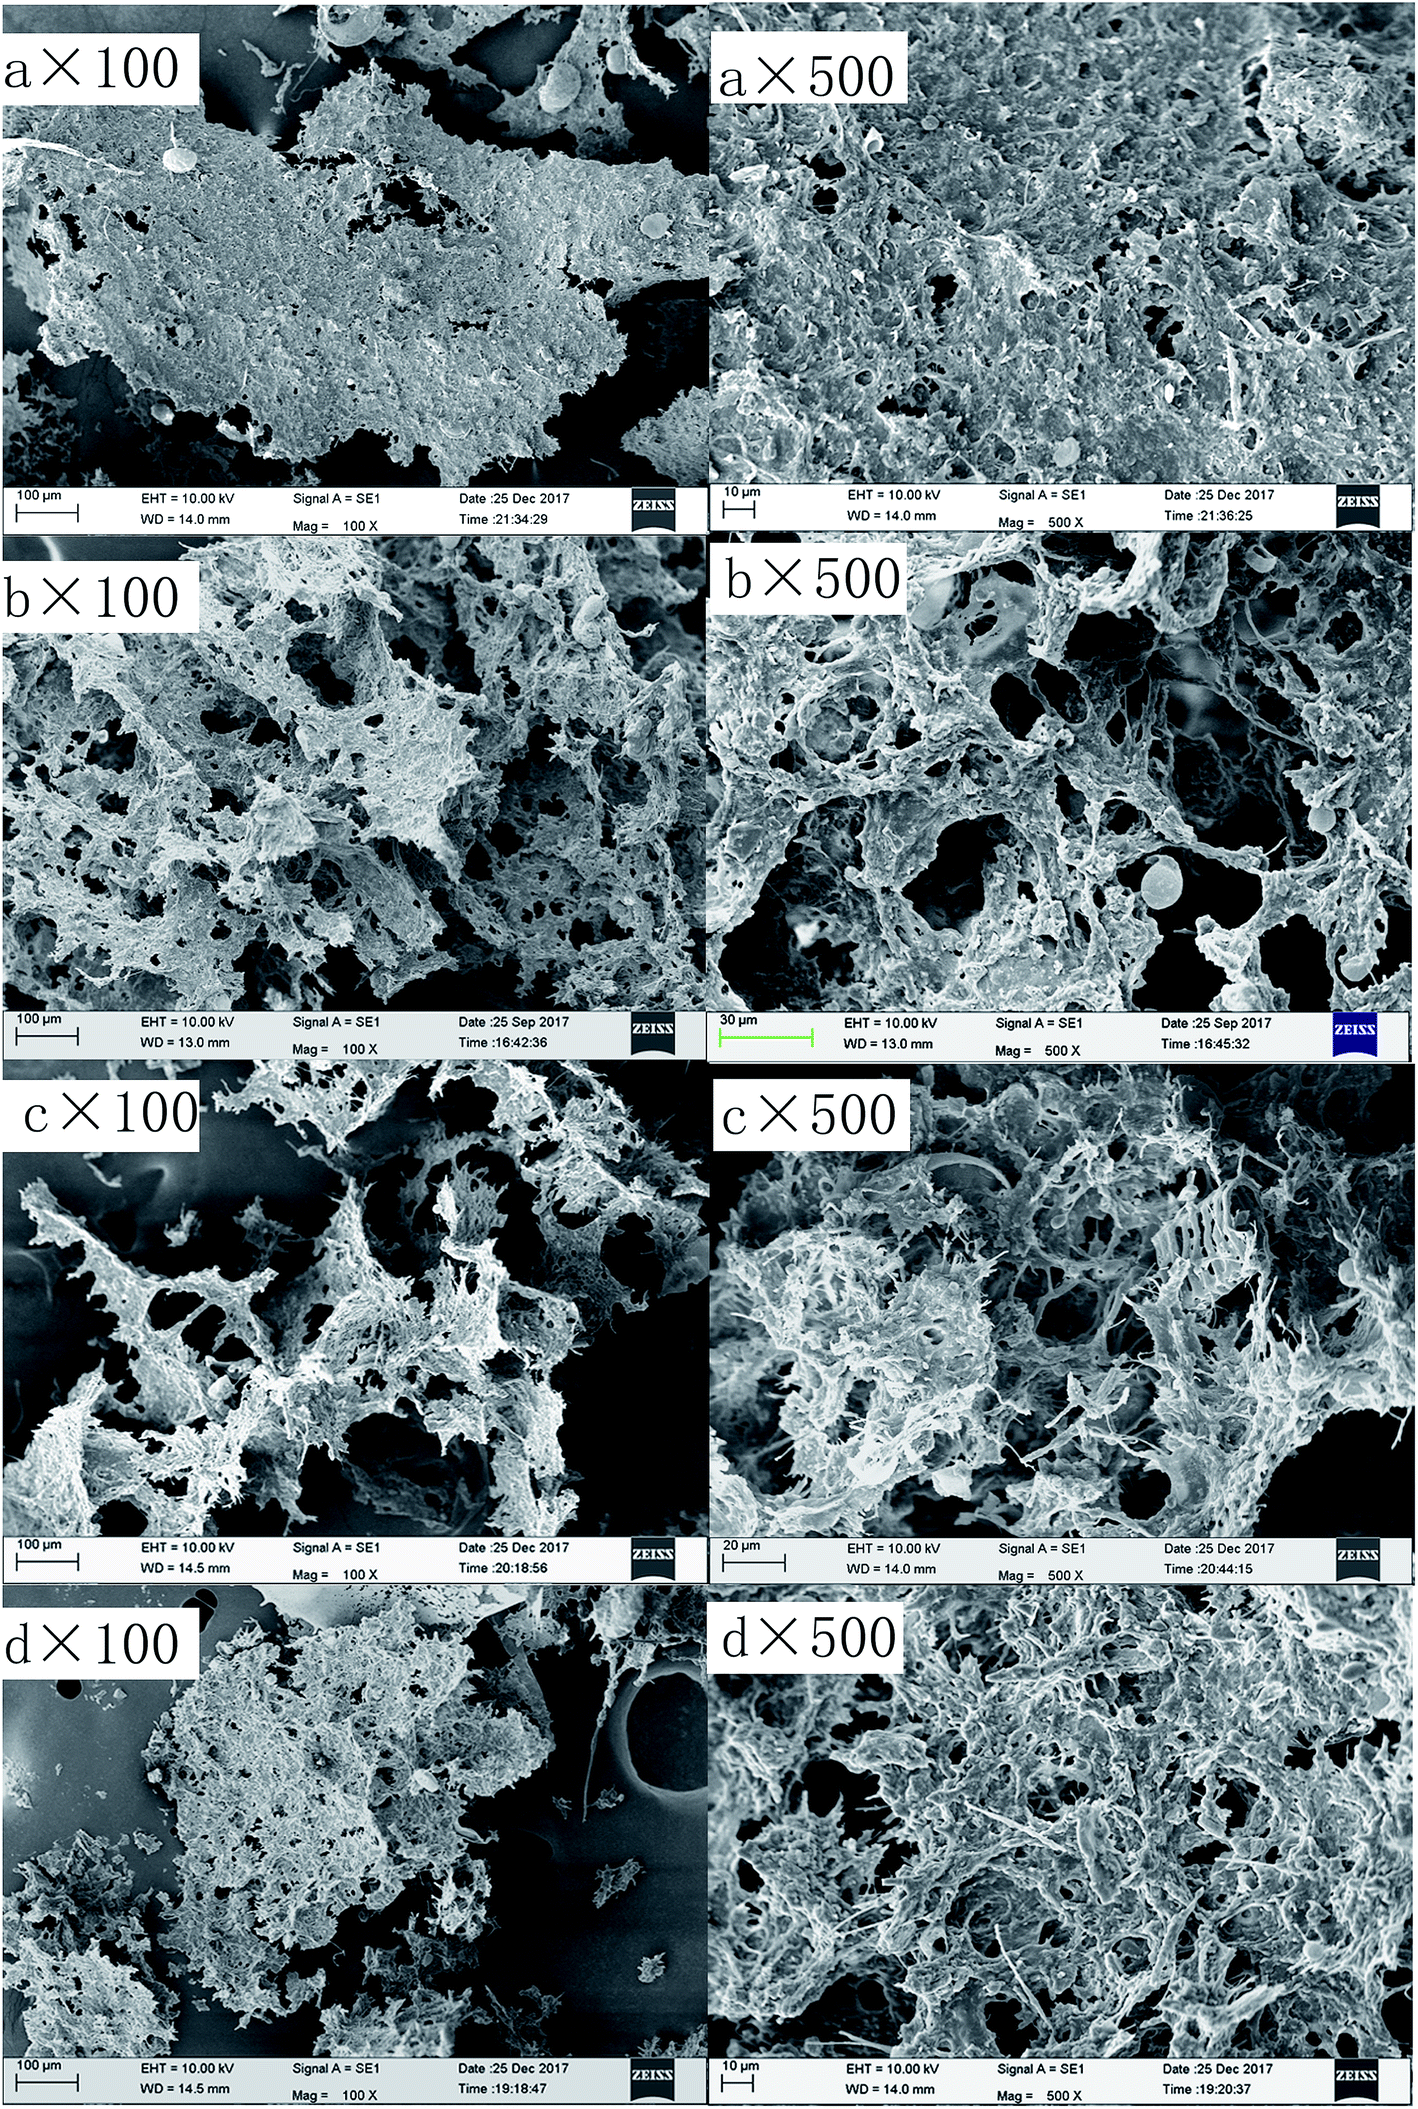 | ||
| Fig. 6 SEM images of the sludge treated in various ways: (a) raw sludge; (b) sludge conditioned with 2.5 mg g−1 DS CPAM; (c) sludge conditioned with 15 mg g−1 DS CTSCL; (d) sludge conditioned with 4.8 × 10⁶ U g−1 DS LZM. | ||
4. Conclusions
CTSCL showed a similar effect on the sludge dewatering performance as CPAM, with CTSCL and CPAM decreasing the water content by 10.84% and 8.5%, respectively, which was mostly due to the bridging mechanism that resulted in the increase of the particle size of the sludge flocs, thus enhancing the filterability and dewaterability. Also, CTSCL demonstrated its potential application in sludge conditioning and could be considered as an ideal substitute for CPAM. LZM exhibited its unique superiority in improving the degree of sludge dewatering that could not be achieved with traditional chemical flocculants, which led to a 19.84% decrease in the water content of dewatered sludge. Unlike the conditioning mechanism of chemical flocculants, LZM conditioning effectively broke down cell walls of the microbial bacteria, and released the bound water beneficial for improving the dewatering performance, while the released organic substances clogged the floc surface and the high proportion of fine particles in the flocs resulted in poorer filtration. All the above results were confirmed by the comparison of the sludge microstructure and microtopography before and after the conditioning.Conflicts of interest
There are no conflicts to declare.Acknowledgements
This study was supported by the Science and Technology Planning Project of Guangdong Province, China (2014B090901038 and 2016A020221011), and the Fundamental Research Funds for the Central Universities (2017MS073).References
- K. K. Xiao, Y. Chen, X. Jiang and Y. Zhou, Chemosphere, 2017, 170, 233–241 CrossRef CAS PubMed.
- G. X. You, P. F. Wang, J. Hou, C. Wang, Y. Xu, L. Z. Miao, B. W. Lv, Y. Y. Yang, Z. L. Liu and F. Zhang, Water Res., 2017, 118, 93–103 CrossRef CAS PubMed.
- J. S. Zhang, Y. G. Xue, N. Eshtiaghi, X. H. Dai, W. Q. Tao and Z. Li, Water Res., 2017, 116, 34–43 CrossRef CAS PubMed.
- Q. Yang, J. Yi, K. Luo, X. L. Jing, X. M. Li, Y. Liu and G. M. Zeng, Process Saf. Environ. Prot., 2013, 91, 521–526 CrossRef CAS.
- Y. Q. Wu, Y. H. Jiang, G. J. Ke and Y. J. Liu, Radiat. Phys. Chem., 2017, 130, 164–170 CrossRef CAS.
- G. X. You, J. Hou, P. F. Wang, Y. Xu, C. Wang, L. Z. Miao, B. W. Lv, Y. Y. Yang and H. Luo, Environ. Res., 2016, 151, 698–705 CrossRef CAS PubMed.
- W. J. Zhang, P. Yang, X. Y. Yang, Z. Chen and D. S. Wang, Bioresour. Technol., 2015, 181, 247–253 CrossRef CAS PubMed.
- W. Chen, X. H. Gao, H. Xu, Y. Cai and J. F. Cui, Chemosphere, 2017, 170, 196–206 CrossRef CAS PubMed.
- B. Y. Xiao, C. Liu, J. X. Liu and X. S. Guo, Bioresour. Technol., 2015, 196, 109–115 CrossRef CAS PubMed.
- C. Colombo, G. Palumbo, J. Z. He, R. Pinton and S. Cesco, J. Soils Sediments, 2014, 14, 538–548 CrossRef CAS.
- R. S. Mo, S. S. Huang, W. C. Dai, J. L. Liang and S. Y. Sun, Chem. Eng. J., 2015, 269, 391–398 CrossRef CAS.
- M. Q. Niu, W. J. Zhang, D. S. Wang, Y. Chen and R. L. Chen, Bioresour. Technol., 2013, 144, 337–343 CrossRef CAS PubMed.
- S. M. Koh and J. B. Dixon, Appl. Clay Sci., 2001, 18, 111–122 CrossRef CAS.
- H. Zemmouri, N. Mameri and H. Lounici, Water Sci. Technol., 2015, 71, 810–816 CrossRef CAS PubMed.
- P. Huang, X. W. Zhao and L. Ye, J. Macromol. Sci., Part B: Phys., 2016, 55, 299–309 CrossRef CAS.
- J. Xiao and Q. Zhou, Natural Polymer Flocculant, Chemical Industry Press, 2005 Search PubMed.
- S. Bratskaya, S. Schwarz and D. Chervonetsky, Water Res., 2004, 38, 2955–2961 CrossRef CAS PubMed.
- Y. Lu, G. Y. Zheng, W. Z. Wu, C. H. Cui and L. X. Zhou, Sep. Purif. Technol., 2017, 176, 243–251 CrossRef CAS.
- J. G. He, X. D. Xin, W. Qiu, J. Zhang, Z. D. Wen and J. Tang, Bioresour. Technol., 2014, 170, 108–114 CrossRef CAS PubMed.
- B. R. Wu, X. L. Chai and Y. C. Zhao, Bioprocess Biosyst. Eng., 2016, 39, 627–639 CrossRef CAS PubMed.
- Z. Chen, W. J. Zhang, D. S. Wang, T. Ma and R. Y. Bai, Water Res., 2015, 83, 367–376 CrossRef CAS PubMed.
- S. Bonilla, H. Tran and D. G. Allen, Water Res., 2015, 68, 692–700 CrossRef CAS PubMed.
- D. M. Chipman and N. Sharon, Science, 1969, 165, 454–465 CrossRef CAS PubMed.
- N. Katsiris and A. Kouzeli-Katsiri, Water Res., 1987, 21, 1319–1327 CrossRef CAS.
- X. S. Guo, J. X. Liu and B. Y. Xiao, J. Biotechnol., 2014, 188, 130–135 CrossRef CAS PubMed.
- M. M. Bradford, Anal. Biochem., 1976, 72, 248–254 CrossRef CAS PubMed.
- K. Raunkjær, T. Hvitved-Jacobsen and P. H. Nielsen, Water Res., 1994, 28, 251–262 CrossRef.
- M. Raynaud, J. Vaxelaire, J. Olivier, E. Dieudéfauvel and J. C. Baudez, Water Res., 2012, 46, 4448–4456 CrossRef CAS PubMed.
- H. F. Wang, H. J. Wang, H. Hu and R. J. Zeng, RSC Adv., 2017, 7, 30274–30282 RSC.
- G. Y. Zhen, X. Q. Lu, B. Y. Wang, Y. C. Zhao, X. L. Chai, D. J. Niu, A. H. Zhao, Y. Y. Li, Y. Song and X. Y. Cao, Bioresour. Technol., 2012, 124, 29–36 CrossRef CAS PubMed.
- R. I. S. Gill and T. M. Herrington, Colloids Surf., 1986, 22, 51–76 CrossRef.
- B. Q. Liao, D. G. Allen, I. G. Droppo, G. G. Leppard and S. N. Liss, Water Res., 2001, 35, 339–350 CrossRef CAS PubMed.
- H. Wei, J. Ren, A. M. Li and H. Yang, Chem. Eng. J., 2018, 349, 737–747 CrossRef CAS.
- L. F. Wang, L. L. Wang, W. W. Li, D. Q. He, H. Jiang, X. D. Ye, H. P. Yuan, N. W. Zhu and H. Q. Yu, Chem. Eng. Sci., 2014, 116, 228–234 CrossRef CAS.
- K. You, W. Di, J. Liu and Y. S. Yuan, Adv. Mater. Res., 2014, 1023, 262–265 CAS.
- Y. Dai, S. Huang, J. Liang, S. Zhang, S. Sun, T. Bing and Q. Xu, Chem. Eng. J., 2017, 321, 123–138 CrossRef CAS.
- R. K. Henderson, A. Baker, K. R. Murphy, A. Hambly, R. M. Stuetz and S. J. Khan, Water Res., 2009, 43, 863–881 CrossRef CAS PubMed.
- M. Muller, D. M. B. P. Milori, S. Deleris, J. P. Steyer and Y. Dudal, Waste Manage., 2011, 31, 1916–1923 CrossRef CAS PubMed.
- Z. Chen, W. J. Zhang, D. S. Wang, T. Ma, R. Y. Bai and D. Z. Yu, Water Res., 2016, 103, 170–181 CrossRef CAS PubMed.
Footnote |
| † Electronic supplementary information (ESI) available. See DOI: 10.1039/c8ra10349f |
| This journal is © The Royal Society of Chemistry 2019 |