 Open Access Article
Formation of nickel–cobalt sulphide@graphene composites with enhanced electrochemical capacitive properties†
Junjie Qiu,
Zhongxiong Bai,
Shucheng Liu and
Yi Liu *
*
School of Physical Sciences, Guizhou University, Guiyang 550025, China. E-mail: yliu9@gzu.edu.cn
First published on 28th February 2019
Abstract
Here, nickel–cobalt sulphide particles embedded in graphene layers (porous Ni–Co–S@G), were successfully prepared by one-step annealing of metallocene/metal–organic framework (MOF) hybrids involving simultaneous carbonization and sulfidation. Benefiting from the porous structure, highly conductive graphene layers and large loading of super-capacitive Ni–Co–S, the obtained Ni–Co–S@G composites exhibited excellent electrochemical performance with a specific capacitance of 1463 F g−1 at a current density of 1 A g−1. A flexible solid-state asymmetric supercapacitor (ASC), assembled with Ni–Co–S@G and active carbon, demonstrated a high energy density of 51.0 W h kg−1 at a power density of 650.3 W kg−1. It is noteworthy that the ASC offered robust flexibility and excellent performance that was maintained when the devices were bent at various angles. The results indicate that the as-prepared materials could potentially be applied in high-performance electrochemical capacitors.
1. Introduction
Supercapacitors have attracted much attention because of their high power densities, long cycling lives, and fast charging/discharging rates.1–4 Recently, owing to their excellent electrical conductivity, thermal stability, and specific capacitance, metal sulphides have emerged as a prominent class of materials for supercapacitors.5–10 In particular, binary nickel–cobalt sulphides are regarded as promising electrode materials for high-performance energy-storage devices. This is because, owing to their relatively small band gap, they offer greater electrochemical activity and capacity than mono-metal sulphides.11–18 To tune the electrical activity and performance of such materials, many researchers have applied numerous synthetic strategies to obtain various morphologies.19–25 Various metal sulphides have been synthesized using hydrothermal, electrodeposition, precipitation, sol–gel, electrospinning, and solution-based methods. The porosity, crystallinity, shape, size, and surface area of these materials strongly influence their electrochemical activity and performance.25–33Owing to their special properties, nickel–cobalt sulphides have been used for various applications; however, it remains challenging to prepare nanostructured composites that are inexpensive and easily handled, with controlled morphologies and excellent cycling stability, that can be used as electrode materials for capacitors. These materials have some disadvantages, which limit their practical application.34 Irreversible structure destruction occurs during cycling, which consequently results in poor rate capability and poor cycling performance. Many researchers have attempted to address this problem. One effective approach involves wrapping the metal sulphides with a carbon layer, which enhances the electrical conductivity of the composite and preserves its structural integrity.11,14,24,26 Layered carbon, which offers electrical conductivity and a large surface area, can be coupled with inorganic materials and utilized as a perfect matrix. This endows the nanohybrids with unique structural characteristics and synergistically enhanced electrochemical properties that are derived from both counterparts. Therefore, to improve the supercapacitive performance of these materials, it is essential to select a metal sulphide that can achieve strong and stable interfacial binding with the carbon surface, without the occurrence of aggregation.
Metal–organic frameworks (MOFs), which are assembled via the coordination of metal ions and organic ligands, are recognized as potential precursors for the synthesis of porous materials.35–38 By carefully controlling the calcination conditions, such as the atmosphere, calcination temperature, and time, the MOFs, which consist of metal-ion clusters that are coordinated to organic linkers, can be converted into metal oxide(metal)/carbon nanocomposites. Compared with porous materials fabricated using conventional precursors, such MOF-derived nanocomposites often exhibit controllable porous architectures, pore volumes, and surface areas. In addition to pure MOFs, ternary metal/metal oxide/carbon composites can also be fabricated via the direct heat treatment of bimetallic MOFs or core–shell MOF composites.39–42 Typically, this method preserves the original structure of the parent MOFs; consequently, larger surface areas and greater porosity levels can be achieved.
In this study, we synthesized nickel–cobalt sulphide nanoparticles encapsulated within a graphene layer, via transformation from a nickelocene/MOFs hybrids, which was achieved through simultaneous sulfurization and carbonization processes (Scheme 1). By a one-step thermal annealing approach, the Co ions in MOFs precursors and Ni ions in nickelocene were reduced to metallic Co and Ni and then sulfurized to Ni–Co–S nanoparticles in sulphur vapour. Meanwhile, the organic ligands were pyrolyzed into highly graphitized carbon layers under the catalysis of Co and Ni nanoparticles. The in situ formed graphene thin layer was fully coated on the surface of Ni–Co–S nanoparticles. Benefiting from the special structure, the obtained Ni–Co–S@graphene material delivers a high specific capacity of 1463 F g−1 at a current density of 1 A g−1. The resultant flexible ASC devices exhibit high energy densities of 51.0 and 21.1 W h kg−1 at power densities of 650.3 and 7099.0 W kg−1, respectively.
2. Experimental section
All the reagents used in the experiment are of analytical grade without further purification.2.1 Preparation of Co-MOFs
A methanolic and ethanolic solutions (160 mL) of cobalt nitrate (1455 mg) and 2-methylimidazole (1642 mg) were mixed under stirring. Then the mixture was kept reaction at room temperature for 24 h. The precipitate was collected by centrifugation, washed with ethanol for several times, and dried at 80 °C.2.2 Preparation of nickelocene/MOFs hybrids
The as-prepared Co-MOFs powders (150 mg) and nickelocene powders (300 mg) were placed separately in a container. Then the container was placed in an oven and was kept at 70 °C for 72 h under vacuum.2.3 Preparation of Ni–Co–S@G
The carbonization and sulfidation process was performed in a tubular furnace. 500 mg of sulphur powders was put in the upstream side, 100 mg of nickelocene/MOFs powders were placed next to the sulphur at a downstream side. The tubular furnace temperature was first increased to 600 °C, and then kept for 2 h at this temperature under an Ar flow to yield the final products.2.4 Preparation of the electrodes for electrochemical measurements
A mixture of Ni–Co–S@G, acetylene black, and polytetrafluoroethylene (with the mass ration of 8![[thin space (1/6-em)]](https://www.rsc.org/images/entities/char_2009.gif) :
:![[thin space (1/6-em)]](https://www.rsc.org/images/entities/char_2009.gif) 1
1![[thin space (1/6-em)]](https://www.rsc.org/images/entities/char_2009.gif) :
:![[thin space (1/6-em)]](https://www.rsc.org/images/entities/char_2009.gif) 1) was prepared by milling to produce a homogeneous paste. Then it was coated onto one side of nickel foam (1.0 cm × 2.0 cm), pressed at 8.0 MPa. The mass loading of an electrode is about 1 mg cm−2 and dried under vacuum at 80 °C for 10 h.
1) was prepared by milling to produce a homogeneous paste. Then it was coated onto one side of nickel foam (1.0 cm × 2.0 cm), pressed at 8.0 MPa. The mass loading of an electrode is about 1 mg cm−2 and dried under vacuum at 80 °C for 10 h.
2.5 Fabrication of the asymmetric supercapacitor (ASC)
ASC was fabricated by assembling Ni–Co–S@G positive electrode and active carbon negative electrode with one piece of porous filter paper as the separator. The gel electrolyte was prepared by mixing 1 g of PVA and 1 g of KOH in 10 mL of distilled water at 80 °C with stirring until forming a transparent solution. The gel electrolyte was then deposited on a Ni–Co–S@G composite electrode, which was fabricated by coating a slurry of Ni–Co–S@G, acetylene black, and polyvinylidene difluoride (weight ratio is 8![[thin space (1/6-em)]](https://www.rsc.org/images/entities/char_2009.gif) :
:![[thin space (1/6-em)]](https://www.rsc.org/images/entities/char_2009.gif) 1
1![[thin space (1/6-em)]](https://www.rsc.org/images/entities/char_2009.gif) :
:![[thin space (1/6-em)]](https://www.rsc.org/images/entities/char_2009.gif) 1) on a flexible Ni film. After that, another active carbon electrode was placed on the top of the formed gel electrolyte film and an all solid-state supercapacitor was obtained. The mass ratio of positive electrode to negative electrode was decided according to the charge balance equation:
1) on a flexible Ni film. After that, another active carbon electrode was placed on the top of the formed gel electrolyte film and an all solid-state supercapacitor was obtained. The mass ratio of positive electrode to negative electrode was decided according to the charge balance equation:| m+/m− = (C− × ΔV−)/(C+ × ΔV+) | (1) |
2.6 Characterization
PXRD patterns were recorded on a PANalytical X'Pert Powder diffractometer using CuKα radiation. TEM images were obtained on a Tecnai G2 F20 transmission electron microscope with acceleration voltage of 200 kV. Nitrogen sorption isotherms were measured at 77 K on 3H-2000PS1 analyze. The specific surface area was calculated from the N2 adsorption isotherm using the BET equation. The pore size distribution was determined by Barrett–Joyner–Halenda (BJH) modeling. X-ray photoelectron spectroscopy (XPS) analysis was performed on a Thermo ESCALAB 250Xi device with an Al Kα excitation source.The electrochemical tests were carried out in both three-electrode and two-electrode configurations. The electrochemical performance was tested on an electrochemical workstation (CHI660E, CHI Instrument In, Shanghai) by the techniques of electrochemical impedance spectroscopy (EIS), cyclic voltammetry (CV), and galvanostatic charge–discharge (GCD). In the three-electrode measurements, the Ni–Co–S@G particles on Ni foam electrode were used as the working electrode, a Pt plate as the counter electrode, and Ag/AgCl as the reference electrode. 6 M KOH solutions served as the electrolyte electrochemical measurements. In the two-electrode measurements, the asymmetric supercapacitors were assembled with Ni–Co–S@G acting as the positive electrode and active carbon (AC) as the negative electrode. KOH–PVA gel served as the electrolyte for electrochemical measurements. The voltage window is from 0 to 0.3 V vs. Ag/AgCl for the positive Ni–Co–S@G electrode, and 0 to 1.3 V for the asymmetric Ni–Co–S@G//AC supercapacitors.
The specific capacitance was calculated from the galvanostatic charge–discharge curves according to the following equations:
| C = (I × Δt)/(m × ΔV) | (2) |
The energy density E (W h kg−1) was calculated from the equation:
| E = (0.5CV2)/3.6 | (3) |
The power density P (W kg−1) was calculated as:
| P = (3600 × E)/t | (4) |
3. Results and discussion
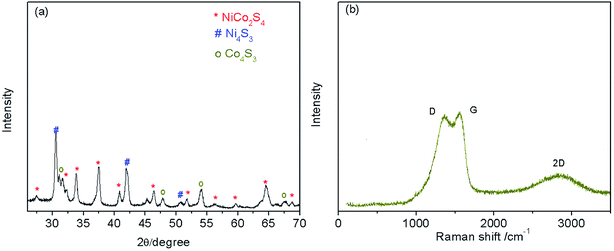
The XRD results (Fig. 1a) show that the Ni–Co–S@G is highly crystalline; the diffraction peaks can be indexed to NiCo2S4 (JCPDS: PDF#24-0334), Ni4S3 (JCPDS: PDF#52-1027), and Co4S3 (JCPDS: PDF#02-1338), respectively. The Raman spectra of the Ni–Co–S@G samples are shown in Fig. 1b. The carbon exhibits a typical D band at 1363.5 cm−1, G band at 1556.9 cm−1, and 2D band at 2840.7 cm−1, which can be ascribed to structural disorder, the E2g vibration mode of the graphite-type sp2 carbons, and the numerous carbon layers,26,43,44 respectively. Furthermore, it was determined that the IG/ID ratios were more than 1, indicating a high graphitization degree of the carbon layers in Ni–Co–S@G.45 When nickelocene/MOFs hybrid was used as a starting precursor, the inorganic constituents Co in MOFs and Ni in nickelocene can act as catalysts to improve the graphitic content of the carbon samples.X-ray photoelectron spectroscopy (XPS) measurements were performed on the Ni–Co–S@G to analyse its surface elemental composition and the chemical valence states of the various elements present. Fig. 2a–d show the typical Ni 2p, Co 2p, C 1s, and S 2p narrow-scan results obtained for the Ni–Co–S@G sample. The Ni 2p and Co 2p spectra, obtained via XPS, are characteristic of Ni2+/Ni3+ and Co2+/Co3+, respectively, and can be well fitted with two spin–orbit splitting. As shown in Fig. 2a, the binding energies of the Ni 2p peaks located at 852.9 and 870.5 eV indicate the existence of Ni2+, while the binding energies at 855.6 and 874.5 eV can be assigned to Ni3+.24,26 Similarly, in the case of the Co 2p XPS spectrum, shown in Fig. 3b, the spin–orbit doublets situated at 778.5 and 793.9 eV can be ascribed to Co2+, while the binding energies at 779.1 and 798.4 eV correspond to the spin–orbit splitting of Co3+.24,26 In the case of the C 1s XPS spectrum, shown in Fig. 3c, the spectrum can be fitted and divided into four types of carbon bonds; these are aromatic-linked carbon (C![[double bond, length as m-dash]](https://www.rsc.org/images/entities/char_e001.gif) C, 284.5 eV); carbon in the oxygen single-bonded carbon bonds (C–O, 284.9 eV); carbonyl carbon (C
C, 284.5 eV); carbon in the oxygen single-bonded carbon bonds (C–O, 284.9 eV); carbonyl carbon (C![[double bond, length as m-dash]](https://www.rsc.org/images/entities/char_e001.gif) O, 285.9 eV), and carboxylate carbon (O–C
O, 285.9 eV), and carboxylate carbon (O–C![[double bond, length as m-dash]](https://www.rsc.org/images/entities/char_e001.gif) O, 288.6 eV).24 The S 2p narrow scan is shown in Fig. 3d, which can be divided into two peaks at 162.6 and 163.8 eV, which correspond to S 2p3/2 and S 2p1/2, respectively.29,31 Based on the results of the XPS analysis, it can be determined that the near-surface of the Ni–Co–S@G sample contains Ni2+, Ni3+, Co2+, Co3+, S2−, and S4−, which will enhance the electrochemical performance of the electrode materials. The atomic ratio of Ni, Co, and S is approximately 3.27
O, 288.6 eV).24 The S 2p narrow scan is shown in Fig. 3d, which can be divided into two peaks at 162.6 and 163.8 eV, which correspond to S 2p3/2 and S 2p1/2, respectively.29,31 Based on the results of the XPS analysis, it can be determined that the near-surface of the Ni–Co–S@G sample contains Ni2+, Ni3+, Co2+, Co3+, S2−, and S4−, which will enhance the electrochemical performance of the electrode materials. The atomic ratio of Ni, Co, and S is approximately 3.27![[thin space (1/6-em)]](https://www.rsc.org/images/entities/char_2009.gif) :
:![[thin space (1/6-em)]](https://www.rsc.org/images/entities/char_2009.gif) 4.14
4.14![[thin space (1/6-em)]](https://www.rsc.org/images/entities/char_2009.gif) :
:![[thin space (1/6-em)]](https://www.rsc.org/images/entities/char_2009.gif) 19.1 based on the XPS analysis. In addition, N2 physical adsorption measurements were performed to study the porosity of the samples; the adsorption/desorption isotherms and corresponding pore-size distributions are presented in Fig. 2e and f, respectively. The sample displays irreversible type IV isotherms confirming its mesoporous nature. The measured Brunauer–Emmett–Teller (BET) surface area of the Ni–Co–S@G sample is 42.5 m2 g−1. In addition, as depicted in Fig. 2f, the mesoporous Ni–Co–S@G sample exhibits a sharp pore-size distribution centred at 3.9 nm and the mean pore size is approximately 11 nm. It is well known that mesoporous structures with relatively large specific surface areas and suitable mesopores can significantly enrich electro-active sites, and shorten the diffusion paths for charge transport, which will consequently enhance the electrochemical performance.
19.1 based on the XPS analysis. In addition, N2 physical adsorption measurements were performed to study the porosity of the samples; the adsorption/desorption isotherms and corresponding pore-size distributions are presented in Fig. 2e and f, respectively. The sample displays irreversible type IV isotherms confirming its mesoporous nature. The measured Brunauer–Emmett–Teller (BET) surface area of the Ni–Co–S@G sample is 42.5 m2 g−1. In addition, as depicted in Fig. 2f, the mesoporous Ni–Co–S@G sample exhibits a sharp pore-size distribution centred at 3.9 nm and the mean pore size is approximately 11 nm. It is well known that mesoporous structures with relatively large specific surface areas and suitable mesopores can significantly enrich electro-active sites, and shorten the diffusion paths for charge transport, which will consequently enhance the electrochemical performance.
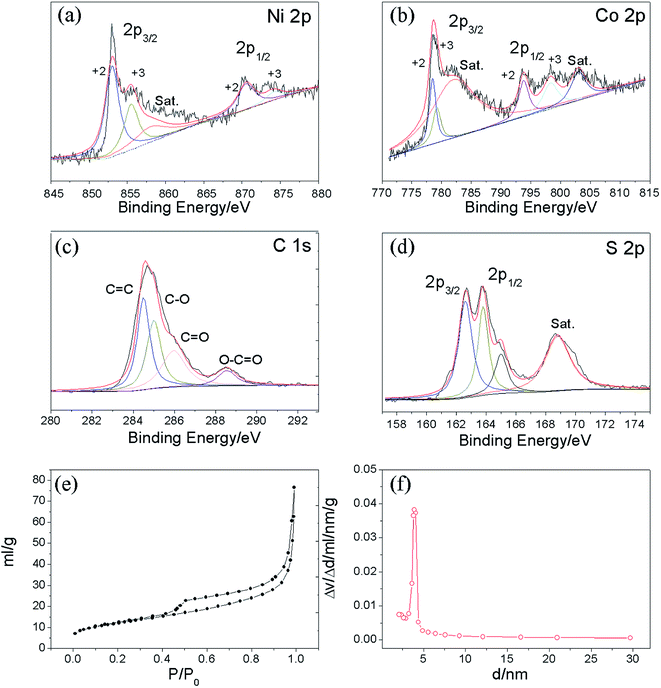 | ||
| Fig. 2 XPS spectra of the Ni–Co–S@graphene: (a) Ni 2p, (b) Co 2p, (c) C 1s, (d) S 2p; (e) nitrogen adsorption–desorption isotherms and (f) pore size distributions of Ni–Co–S@graphene. | ||
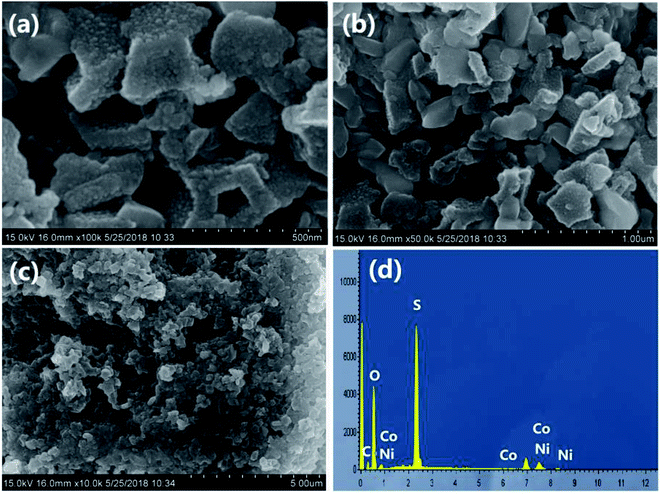
The surface morphology of the Ni–Co–S@G sample was analysed using scanning electron microscopy (SEM). As shown in Fig. 3a–c, the Ni–Co–S@G sample possesses a polyhedral morphology with good uniformity. The as-formed Ni–Co–S@G particles are interconnected, generating an open framework; this promotes electrolyte wetting, resulting in enhanced penetration. The EDS results (Fig. 3d) confirm that Ni, Co, and S exist within the sample and the atomic ratio of the Ni, Co, and S is approximately 4.69![[thin space (1/6-em)]](https://www.rsc.org/images/entities/char_2009.gif) :
:![[thin space (1/6-em)]](https://www.rsc.org/images/entities/char_2009.gif) 5.87
5.87![[thin space (1/6-em)]](https://www.rsc.org/images/entities/char_2009.gif) :
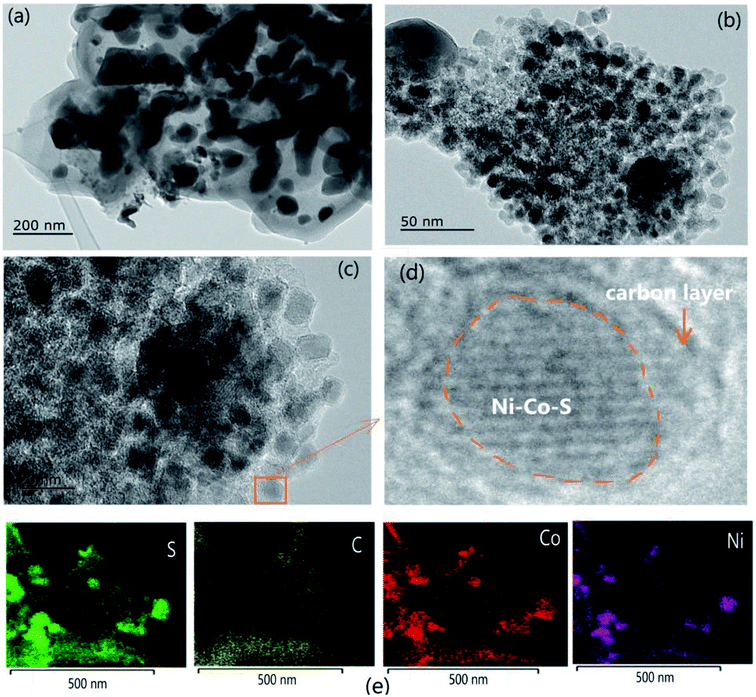
:![[thin space (1/6-em)]](https://www.rsc.org/images/entities/char_2009.gif) 22.12, which correlates with the aforementioned XPS results. The TEM images show that the prepared Ni–Co–S@G is composed of highly uniform nanoparticles (Fig. 4a–c). Each nanoparticle is encapsulated within a thin carbon shell, which prevents aggregation and acts as an electronic network for individual particles. The high-magnification transmission electron microscopy (TEM) images indicate that the composites contain crystalline nanoparticles with an average diameter of 5–10 nm and a carbon coating with 3–5 graphene layers. The element mapping, obtained via EDS, indicates that the elements (Ni, Co, S, and C) are distributed homogeneously over the nanoparticles (Fig. 4d); this further verifies that the Ni–Co–S@G has a uniform core–shell structure. In comparison with nanoparticle on-sheet materials, owing to their high degree of thermodynamic stability and protective layered structure, core-shell-structured composites have many advantages when used in supercapacitors.11,15 It is believed that superior supercapacitive performance can be achieved via the well-controlled growth of ultra-dispersed Ni–Co–S nanoparticles on a carbon matrix. In addition, as shown by the TEM image in Fig. 4c, several narrow pores exist within the Ni–Co–S@G sample, which is consistent with the BET analysis results. The Ni–Co–S@G, which contains mesopores, can provide more effective channels for the electrolyte ions within the electrodes, promoting fast redox reactions. Meanwhile, the mesoporous core–shell structure possesses a large specific surface area and abundant pore networks. These features could shorten the ion-transport pathways, increase the electrode–electrolyte interfacial area, and alleviate any volume change; these factors are favourable for rapid charge–discharge processes.
22.12, which correlates with the aforementioned XPS results. The TEM images show that the prepared Ni–Co–S@G is composed of highly uniform nanoparticles (Fig. 4a–c). Each nanoparticle is encapsulated within a thin carbon shell, which prevents aggregation and acts as an electronic network for individual particles. The high-magnification transmission electron microscopy (TEM) images indicate that the composites contain crystalline nanoparticles with an average diameter of 5–10 nm and a carbon coating with 3–5 graphene layers. The element mapping, obtained via EDS, indicates that the elements (Ni, Co, S, and C) are distributed homogeneously over the nanoparticles (Fig. 4d); this further verifies that the Ni–Co–S@G has a uniform core–shell structure. In comparison with nanoparticle on-sheet materials, owing to their high degree of thermodynamic stability and protective layered structure, core-shell-structured composites have many advantages when used in supercapacitors.11,15 It is believed that superior supercapacitive performance can be achieved via the well-controlled growth of ultra-dispersed Ni–Co–S nanoparticles on a carbon matrix. In addition, as shown by the TEM image in Fig. 4c, several narrow pores exist within the Ni–Co–S@G sample, which is consistent with the BET analysis results. The Ni–Co–S@G, which contains mesopores, can provide more effective channels for the electrolyte ions within the electrodes, promoting fast redox reactions. Meanwhile, the mesoporous core–shell structure possesses a large specific surface area and abundant pore networks. These features could shorten the ion-transport pathways, increase the electrode–electrolyte interfacial area, and alleviate any volume change; these factors are favourable for rapid charge–discharge processes.
To evaluate the electrochemical performance of the sample, a standard three-electrode system was used (Fig. 5). Capacitance–voltage (CV) measurements were performed from 0 to 0.3 V, as shown in Fig. 5c. In the case of the Ni–Co–S@G sample, the CV cycle shows two broad oxidation and reduction peaks at 0.24 and 0.15 V at scanning rate of 10 mV s−1, as the scanning rate was increased, the oxidation peak shifted positively while the reduction peak shifted negatively; this indicates that a reversible faradaic redox reaction occurred.46 Considering the composite sample, the charge storage can be explained via the synergistic behaviours of the two components: the electrostatic double-layer capacitor (EDLC) behaviour of the carbon material, and the pseudocapacitive behaviour of the Ni–Co–S:24,29,47
| CoS + OH− ⇔ CoSOH + e− | (5) |
| CoSOH + OH− ⇔ CoSO + H2O + e− | (6) |
| NiS + OH− ⇔ NiSOH + e− | (7) |
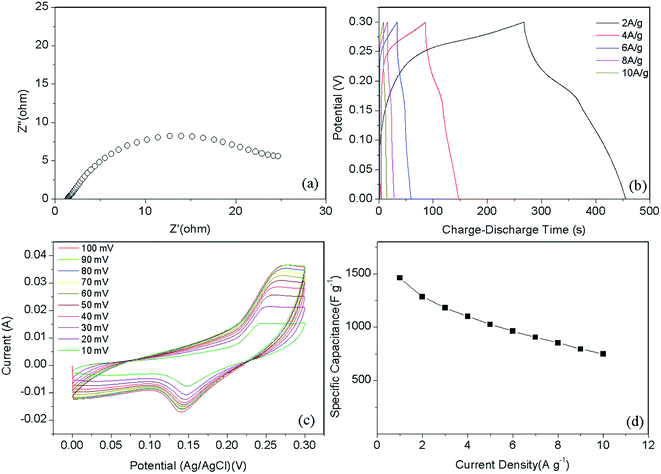 | ||
| Fig. 5 (a) Nyquist plots, (b) galvanostatic charge–discharge curves, (c) cyclic voltammetry curves, and (d) specific capacitance at different current density of Ni–Co–S@graphene. | ||
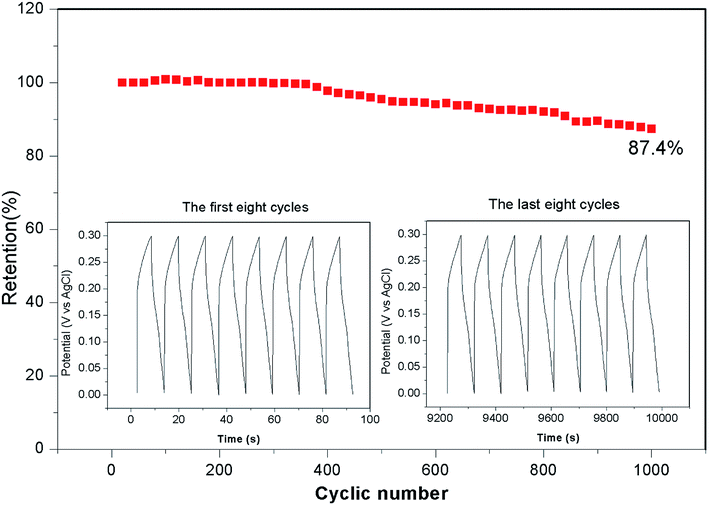
Fig. 5b presents the galvanostatic charge–discharge curves of the Ni–Co–S@G electrode under various current densities, ranging from 2 to 10 A g−1. Consistent with the CV results, the defined voltage plateaus of the charge–discharge curves suggest that pseudocapacitive behaviour occurred along with some faradaic processes. The specific capacitance of the electrode as a function of the current density, determined using the discharge curves, is shown in Fig. 5d. The maximum specific capacitance is 1463 F g−1, which was measured at a discharge current density of 1 A g−1. As the current density increases, the specific capacitance of the Ni–Co–S@G electrode gradually decreases and maintains a high value of 750 F g−1 at 10 A g−1. In the case of the Ni–Co–S@G sample, approximately 51.2% of the capacitance is retained when the current density increases from 1 to 10 A g−1. The cycling performance of the electrode was evaluated via repeated charge–discharge tests at a current density of 17 A g−1. Compared with that of the first charge–discharge process, the specific capacitance of the electrode exhibits a 12.6% loss after 1000 cycles (Fig. 6). This indicates the good stability of the Ni–Co–S@G electrode. To further evaluate the ion diffusion that occurs within the electrodes, electrochemical impedance spectroscopy (EIS) measurements were conducted under frequencies of 100 MHz to 0.01 kHz. At high frequencies, the intercept of the x-axis indicates the series resistance (Rs), which is the sum of the electrolyte resistance, and the contact resistances between the electrode materials and the current collector, and electrolyte, respectively. The Ni–Co–S@G electrode material has a small Rs of about 1.2 Ω, indicating that it has relatively good electrical conductivity.
To further evaluate the electrode for practical application, an asymmetric supercapacitor (ASC) device was fabricated using the Ni–Co–S@G electrode as the anode and active carbon as the cathode, and KOH–PVA gel as electrolyte. Fig. 7a presents typical CV curves of the Ni–Co–S@G//AC ASC device at various scan rates between 0 and 1.3 V. Clearly, the current density increases with the increasing scan rate and all CV curves exhibit a similar shape. There is no obvious distortion in the CV curves even at a high scan rate of 100 mV s−1, indicating excellent fast charge/discharge properties of the device.29 Galvanostatic charge/discharge (GCD) curves of the ASC at various current densities are shown in Fig. 7b. The specific capacitance of the ASC is 217.8 F g−1 at the current density of 1 A g−1, and it still retains 101.6 F g−1 at a very high current density of 10 A g−1 (Fig. 7c). It is noteworthy that the specific capacitances of the Ni–Co–S@G//AC are retained at about 46.6% of the initial capacitances. These results indicate the good rate capability of the ASC. We have further evaluated the energy and power densities of the Ni–Co–S@G//AC ASC. As shown in the Ragone plot (Fig. 7d), the ASC displays a high energy density of 51.0 W h kg−1 at a power density of 650.3 W kg−1. Even at a high-power density of 7099 W kg−1, the ASC still delivers an energy density of 21.1 W h kg−1. Table S1† shows the detailed electrochemical performance parameters for Ni–Co–S@G//AC ASC. Overall, the performance of this Ni–Co–S@G//AC ASC is superior to that of many other metal sulfide-based supercapacitors, such as NiCo2S4@graphene//porous carbon ASC (43.4 W h kg−1 at 254.3 W kg−1),11 NiCo2S4 nanosheets//AC ASC (45.5 W h kg−1 at 512 W kg−1),18 NiCo2S4//NiCo2S4 SSC (35.17 W h kg−1 at 555.6 W kg−1),28 NiCo2S4 nano-petals//AC ASC (35.6 W h kg−1 at 819.5 W kg−1),29 NiCo2S4 nanotube//RGO ASC (16.6 W h kg−1 at 2348.5 W kg−1),30 core–shell NiCo2S4//C (10.6 W h kg−1 at 2470 W kg−1),31 and NiCo2S4 nanotube//AC ASC (21 W h kg−1 at 4725 W kg−1).32 The resulting electrochemical performance is comparable or superior to that of most of the nanostructured Ni–Co–S materials reported previously (see Table S2† for a detailed comparison).
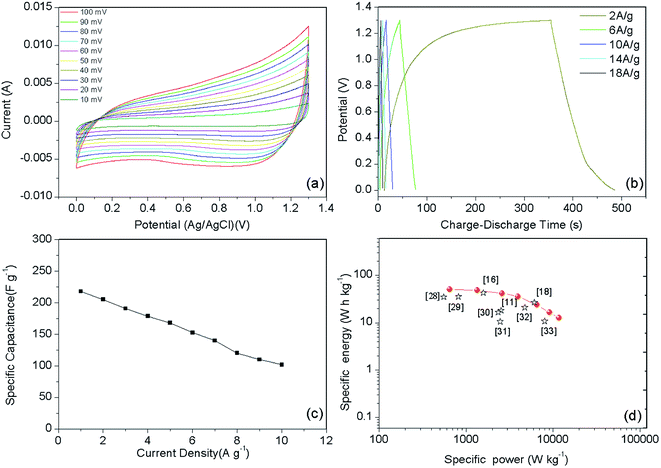 | ||
| Fig. 7 (a) Cyclic voltammetry curves, (b) galvanostatic charge–discharge curves, (c) specific capacitance at different current density, and (d) Ragone plots of the ASC. | ||
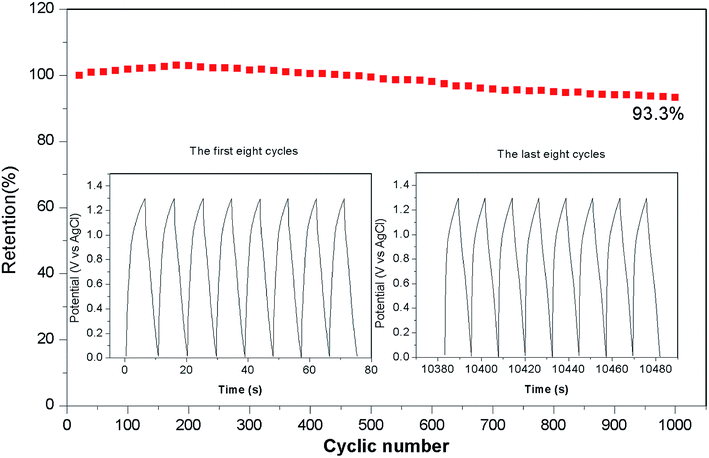
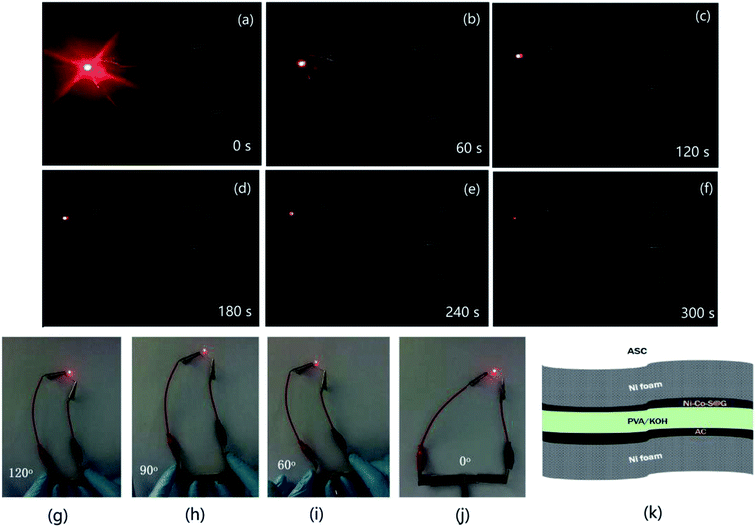
Fig. 8 shows the long-term cycling performance of the ASC at a current density of 17 A g−1. Remarkably, the ASC demonstrates excellent cycling stability, and delivers 93.3% of its initial capacitance even after 1000 cycles. The Ni–Co–S nanoparticles are well wrapped by the carbon layer, which can help to alleviate the volume change of the Ni–Co–S crystalline nanoparticles during cycling, and suppress the loss of active material.48 Therefore, the charge and discharge capacities of the Ni–Co–S@G remained relatively stable over the first 400 cycles. A red light-emitting diode (LED) was successfully lit for more than 300 s by two series-connected devices (Fig. 9); this demonstrates the potential of the Ni–Co–S@G/AC supercapacitor. To evaluate their mechanical flexibility, the ASC cells were bent at different angles while the LED was illuminated. When the ASC devices were bent at various angles (60°, 90°, and 120°), there were no apparent changes in the brightness of the LED. The outstanding electrochemical performance of the Ni–Co–S@G hybrid was attributed to several factors. The first factor is that the carbonization and sulfurization processes are performed simultaneously during the preparation, which promotes intimate anchoring of the Ni–Co–S species to the carbon, and enhances the structural stability of the hybrid electrodes. The Ni–Co–S can offer richer electrochemical reactions because of the contributions of the Ni and Co ions. The second factor refers to the porous core–shell structure of the hybrid, which can improve the penetration of the electrolyte, and shorten the diffusion distance of the electrons/ions. It can also relieve mechanical stress and maintain structural integrity during the charge–discharge cycles. Moreover, the graphene layers could effectively improve the electrical conductivity of the hybrid material by enhancing the electron-transfer rate.
4. Conclusions
In summary, Ni–Co–S particles embedded in graphene layers were fabricated through a one-step annealing of nickelocene/MOFs hybrids involving simultaneous carbonization and sulfidation. The as-prepared Ni–Co–S@graphene core/shell structures exhibited a high specific capacity of 1463 F g−1 at 1 A g−1. Following 1000 test cycles at 17 A g−1, the material retained 87.4% of its initial capacity. We also assembled a solid-state ASC based on Ni–Co–S@graphene and active carbon (AC). The Ni–Co–S@graphene//AC ASC delivered an outstanding energy density (51.0 W h kg−1) at a power density of 650.3 W kg−1. They also exhibited good cycling stability and retained 93.3% of their initial capacity following 1000 cycles at 17 A g−1. The ASC were subjected to tests, where an LED was powered for around 300 seconds. No obvious changes in the brightness of the LED were observed when the cells were bent from 60° to 120°, indicating that these ASC offer great potential for practical applications.Conflicts of interest
There are no conflicts to declare.Acknowledgements
This work is supported by the National Natural Science Foundation of China (No. 21261006).References
- J. R. Miller and P. Simon, Science, 2008, 321, 651 CrossRef CAS PubMed.
- P. Simon and Y. Gogotsi, Nat. Mater., 2008, 7, 845 CrossRef CAS PubMed.
- F. X. Wang, X. W. Wu, X. H. Yuan, Z. C. Liu, Y. Zhang, L. J. Fu, Y. S. Zhu, Q. M. Zhou, Y. P. Wu and W. Huang, Chem. Soc. Rev., 2017, 46, 6816 RSC.
- N. Choudhary, C. Li, J. Moore, N. Nagaiah, L. Zhai, Y. Jung and J. Thomas, Adv. Mater., 2017, 29, 1605336 CrossRef PubMed.
- P. Kulkarni, S. K. Nataraj, R. G. Balakrishna, D. H. Nagaraju and M. V. Reddy, J. Mater. Chem. A, 2017, 5, 22040 RSC.
- X. Rui, H. Tan and Q. Yan, Nanoscale, 2014, 6, 9889 RSC.
- B. Wang, J. Park, D. Su, C. Wang, H. Ahn and G. Wang, J. Mater. Chem., 2012, 22, 15750 RSC.
- W. Zhou, X. Cao, Z. Zeng, W. Shi, Y. Zhu, Q. Yan, H. Liu, J. Wang and H. Zhang, Energy Environ. Sci., 2013, 6, 2216 RSC.
- J. Yang, X. Duan, W. Guo, D. Li, H. Zhang and W. Zheng, Nano Energy, 2014, 5, 74 CrossRef CAS.
- S. Zhang, B. Yin, H. Jiang, F. Qu, A. Umar and X. Wu, Dalton Trans., 2015, 44, 2409 RSC.
- F. Yu, Z. Chang, X. H. Yuan, F. X. Wang, Y. S. Zhu, L. j. Fu, Y. H. Chen, H. X. Wang, Y. P. Wu and W. S. Li, J. Mater. Chem. A, 2018, 2, 1039 Search PubMed.
- Y. Li, L. Cao, L. Qiao, M. Zhou, Y. Yang, P. Xiao and Y. Zhang, J. Mater. Chem. A, 2014, 2, 6540 RSC.
- J. Yang, M. Ma, C. Sun, Y. Zhang, W. Huang and X. Dong, J. Mater. Chem. A, 2015, 3, 1258 RSC.
- L. Q. Li, Z. Y. Dai, Y. F. Zhang, J. Yang, W. Huang and X. C. Dong, RSC Adv., 2015, 5, 83408 RSC.
- L. Shen, L. Yu, H. B. Wu, X. Y. Yu, X. Zhang and X. W. Lou, Nat. Commun., 2015, 6, 6694 CrossRef CAS PubMed.
- B. Y. Guan, L. Yu, X. Wang, S. Y. Song and X. W. David Lou, Adv. Mater., 2017, 2, 1605051 CrossRef PubMed.
- X. H. Xiong, G. Waller, D. Ding, D. Chen, B. Rainwater, B. Zhao, Z. Wang and M. Liu, Nano Energy, 2015, 16, 71 CrossRef CAS.
- L. F. Shen, J. Wang, G. Y. Xu, H. S. Li, H. Dou and X. Zhang, Adv. Energy Mater., 2015, 5, 1400977 CrossRef.
- H. Chen, J. Jiang, Y. Zhao, L. Zhang, D. Guo and D. Xia, J. Mater. Chem. A, 2015, 3, 428 RSC.
- Y. R. Zhu, Z. B. Wu, M. J. Jing, X. M. Yang, W. X. Song and X. B. Ji, J. Power Sources, 2015, 273, 584 CrossRef CAS.
- H. C. Chen, J. J. Jiang, L. Zhang, H. Z. Wan, T. Qia and D. D. Xia, Nanoscale, 2013, 5, 8879 RSC.
- C. Xia and H. N. Alshareef, Chem. Mater., 2015, 27, 4661 CrossRef CAS.
- Y. Tang, T. Chen, S. Yu, Y. Qiao, S. Mu, S. Zhang, Y. Zhao, L. Hou, W. Huang and F. Gao, J. Power Sources, 2015, 295, 314 CrossRef CAS.
- J. Yang, C. Yu, X. Fan, S. Liang, S. Li, H. Huang, Z. Ling, C. Hao and J. Qiu, Energy Environ. Sci., 2016, 9, 1299 RSC.
- K. Tao, X. Han, Q. X. Ma and L. Han, Dalton Trans., 2018, 47, 3496 RSC.
- T. Q. Peng, H. Yi, P. Sun, Y. T. Jing, R. J. Wang, H. W. Wang and X. F. Wang, J. Mater. Chem. A, 2016, 4, 8888 RSC.
- C. Chen, M. K. Wu, K. Tao, J. J. Zhou, Y. L. Li, X. Han and L. Han, Dalton Trans., 2018, 47, 5639 RSC.
- L. Y. Lin, J. L. Liu, T. M. Liu, J. H. Hao, K. M. Ji, R. Sun, W. Zeng and Z. C. Wang, J. Mater. Chem. A, 2015, 3, 17652 RSC.
- Y. X. Wen, S. L. Peng, Z. L. Wang, J. X. Hao, T. F. Qin, S. Q. Lu, J. C. Zhang, D. Y. He, X. Y. Fan and G. Z. Cao, J. Mater. Chem. A, 2017, 5, 7144 RSC.
- H. C. Chen, J. J. Jiang, L. Zhang, D. D. Xia, Y. D. Zhao, D. Q. Guo, T. Qi and H. Z. Wan, J. Power Sources, 2014, 254, 249 CrossRef CAS.
- W. Kong, C. C. Lu, W. Zhang, J. Pu and Z. H. Wang, J. Mater. Chem. A, 2015, 3, 12452 RSC.
- L. Hao, L. Shen, J. Wang, Y. Xu and X. Zhang, RSC Adv., 2016, 6, 9950 RSC.
- Z. B. Wu, X. L. Pu, X. B. Ji, Y. R. Zhu, M. J. Jing, Q. Y. Chen and F. P. Jiao, Electrochim. Acta, 2015, 174, 238 CrossRef CAS.
- P. Kulkarni, S. K. Nataraj, R. G. Balakrishna, D. H. Nagaraju and M. V. Reddy, J. Mater. Chem. A, 2017, 5, 22040 RSC.
- H. Li, M. Eddaoudi and M. O'Keeff, Nature, 1999, 402, 276 CrossRef CAS.
- K. L. Mulfort and J. T. Hupp, J. Am. Chem. Soc., 2007, 129, 9604 CrossRef CAS PubMed.
- B. Sareeya, H. Satoshi and H. Masakazu, Nat. Mater., 2009, 8, 831 CrossRef PubMed.
- B. Liu, H. Shioyama and T. Akita, J. Am. Chem. Soc., 2008, 130, 5390 CrossRef CAS PubMed.
- R. R. Salunkhe, Y. V. Kaneti and Y. Yamauchi, ACS Nano, 2017, 11, 5293 CrossRef CAS PubMed.
- R. P. Antony, A. K. Satpati, K. Bhattacharyya and B. N. Jagatap, Adv. Mater. Interfaces, 2016, 3, 1600632 CrossRef.
- C. Young, R. R. Salunkhe, S. M. Alshehri, T. Ahamad, Z. G. Huang, J. Henzie and Y. Yamauchi, J. Mater. Chem. A, 2017, 5, 11834 RSC.
- Y. Pan, K. Sun, S. J. Liu, X. Cao, K. L. Wu, W. C. Cheong, Z. Chen, Y. Wang, Y. Li, Y. Q. Liu, D. S. Wang, Q. Peng, C. Chen and Y. D. Li, J. Am. Chem. Soc., 2018, 140, 2610 CrossRef CAS PubMed.
- Y. Hsu, Y. Chen, Y. Lin, L. Chen and K. Chen, J. Mater. Chem., 2012, 22, 3383 RSC.
- F. Leroux, E. Raymundo-Pinero, J. Nedelec and F. Beguin, J. Mater. Chem., 2006, 16, 2074 RSC.
- R. R. Salunkhe, Y. V. Kaneti, J. Kim, J. H. Kim and Y. Yamauchi, Acc. Chem. Res., 2016, 49, 2796 CrossRef CAS PubMed.
- T. Brousse, D. Bélanger and J. W. Long, J. Electrochem. Soc., 2015, 162, A5185 CrossRef CAS.
- W. Chen, C. Xia and H. N. Alshareef, ACS Nano, 2014, 8, 9531 CrossRef CAS PubMed.
- D. X. Yuan, G. Huang, D. M. Yin, X. X. Wang, C. L. Wang and L. M. Wang, ACS Appl. Mater. Interfaces, 2017, 9, 18178 CrossRef CAS PubMed.
Footnote |
| † Electronic supplementary information (ESI) available. See DOI: 10.1039/c8ra06906a |
| This journal is © The Royal Society of Chemistry 2019 |


