 Open Access Article
Preparation and spectral characteristics of Tm3+/Ho3+ co-doped TeO2–B2O3–BaO glass
Qingbo Wang ,
Junying Zhang,
Weimin Dong,
Lintao Liu,
Hang Wen
 ,
Qian Yao,
Jing Li* and
Jiyang Wang
State Key Lab of Crystal Materials, Shandong University, Jinan 250100, China. E-mail: jingli@sdu.edu.cn
First published on 1st March 2019
Abstract
TeO–B2O3–BaO glasses with different compositions were prepared by the conventional melt-quenching technique. The spectral properties of Tm3+/Ho3+ co-doped TeO–B2O3–BaO glasses with different doping concentrations were studied. In order to analyze the spectroscopic properties in detail, the Judd–Ofelt intensity parameters, spontaneous radiative probabilities, branching ratios, absorption and emission cross-sections, and gain coefficient spectra were calculated using Judd–Ofelt and McCumber theory based on the absorption and emission spectra. Meanwhile, the optimal doping concentration was determined as Tm2O3: 1.0 mol% and Ho2O3: 1.0 mol%. The results show that Tm3+/Ho3+ co-doped TeO–B2O3–BaO glass is an ideal mid-infrared laser gain medium.
Introduction
In recent years, infrared lasers working around 2 μm have attracted widespread attention because of their wide range of uses, such as in eye-safe lidar systems, laser remote sensing, biomedical uses.1,2 It is well-known that lasers at around 2 μm can be obtained from the Ho3+:5I7 → 5I8 or Tm3+:3F4 → 3H6 transition processes. Ho3+ ions have a wide radiation bandwidth and long fluorescence lifetime, and the stimulated emission cross-section is larger than that of Tm3+ ions.3–5 However, due to the lack of a corresponding absorption band, Ho3+-doped lasers cannot be directly pumped by commercially available 808 nm or 980 nm LD pump sources. Other rare-earth ions such as Yb3+, Er3+, and Tm3+ have an absorption band at 808 nm or 980 nm and can be introduced as a sensitizer co-doped with Ho3+. Among them, Tm3+ has a strong absorption band at 808 nm and can be directly pumped by an 808 nm LD, which has attracted widespread interest.6–8 In order to obtain a strong laser output at around 2 μm, a series of laser glasses have been developed. Compared with other matrix materials such as silicate glass, germanate glass, and halide and sulfide glass, tellurate glass has good thermal stability, low thermal expansion coefficient and good solubility of rare-earth ions.9 It is generally believed that tellurium ions in tellurate glass are mainly in the form of trigonal bipyramid [TeO4], deformed trigonal bipyramid [TeO3+1] and trigonal pyramid [TeO3]. These structural groups are linked to each other at a certain angle to form a long chain or a ring chain.10 BaO exists in glass as a network modifier and does not participate in network construction. With the addition of BaO, the trigonal bipyramid [TeO4] transforms into the deformed trigonal bipyramid [TeO3+1] and trigonal pyramid [TeO3].11,12 Furthermore, more BaO enters the gap between these long chains or ring chains in the form of [BaO6] and [BaO7] polyhedra, making the network of glass more compact, which improves the mechanical strength and thermal stability of the glass.13 The introduction of B2O3 improves the thermal stability and contributes to the formation of glass.Here, Tm3+/Ho3+ co-doped tellurate glasses with different compositions of TeO2–B2O3–BaO were prepared, and an emission peak at around 2.0 μm was obtained under the excitation of an 808 nm LD. We investigate the appropriate co-doping concentrations of Tm3+ and Ho3+ that can output an intense ultra-broad fluorescence emission band at around 2.0 μm. Meanwhile, the energy transfer mechanism between Tm3+ and Ho3+ was systematically analyzed. In addition, quantitative research was conducted based on Judd–Ofelt theory in order to evaluate the radiation performance of Tm3+ and Ho3+. After that, the absorption and emission cross-sections and gain coefficient spectra were calculated and discussed on the basis of the absorption and emission spectra.
Experimental
Material synthesis
Undoped TeO2–B2O3–BaO glasses with different compositions and Tm3+/Ho3+ co-doped TeO2–B2O3–BaO glasses with different doping concentrations were prepared by the traditional melt-quenching method. 10 g of powders of TeO2, BaCO3, H3BO3, Tm2O3 and Ho2O3 were weighed exactly according to the ratio, mixed well and poured into a platinum crucible, and kept at 450 °C for one hour to remove gas and moisture. Then, the temperature was raised to 850 °C, and the mixture was melted for 30 minutes and stirred. The purpose of the stirring is to uniformly mix the raw materials and remove the bubbles in the glass to homogenize the molten glass. The molten glass was poured onto a preheated stencil and quickly transferred to a preheated resistance furnace (the furnace temperature is near the transition temperature of the glass sample) to anneal the sample and eliminate stress in the glass. The temperature was kept near the glass transition temperature for 4 hours and then the sample was naturally cooled to room temperature. The annealed glass samples were processed into a certain size and shape according to the relevant test requirements, and were polished for related tests such as infrared transmission, absorption and fluorescence spectroscopy.Measurements
Thermal performance analysis of powder samples crushed down from the samples was achieved by a Diamond TG/DTA from Perkin Elmer, USA. The test temperature range was 200–550 °C, the heating rate was 10 °C min−1, and the analysis was performed in an air atmosphere. The Raman and infrared transmission spectra of the glass samples were measured by a NEXUS 670 Fourier transform infrared-Raman (FT-IR & Raman) spectrometer from Thermo Nicolet, USA. The test ranges were 250–1800 cm−1 and 400–4000 cm−1, respectively. The transmission spectrum of the undoped TeO2–B2O3–BaO glass samples and the absorption spectrum of the Tm3+/Ho3+ co-doped TeO2–B2O3–BaO glass samples were, respectively, measured using a U-3500 IR/VIS/UV spectrophotometer manufactured by Hitachi. Fluorescence spectra and lifetimes were measured using an FLSP 980 time-resolved steady-state/transient spectrometer from Edinburgh Instruments. The excitation sources were 980 nm and 808 nm LDs, respectively. All of the measurements were carried out at room temperature.Results and discussion
Glass samples
In this work, TeO2–B2O3–BaO glass substrates with glass compositions as follows: 33%TeO2–34%B2O3–33%BaO (TBB1), 60%TeO2–20%B2O3–20%BaO (TBB2), 67%TeO2–17%B2O3–16%BaO (TBB3), 70%TeO2–10%B2O3–20%BaO (TBB4) and 50%TeO2–30%B2O3–20%BaO (TBB5), were prepared. Glass samples with the compositions 1Tm2O3–xHo2O3–(99 − x)(TeO2–B2O3–BaO) (x = 0, 0.6, 1.0, 1.5, 2.0, 3.0 mol%) and xTm2O3–1Ho2O3–(99 − x)(TeO2–B2O3–BaO) (x = 0, 0.2, 0.5, 1.0, 1.5 mol%) were also prepared, and de-noted as TBBTH0, TBBTH0.6, TBBTH1.0, TBBTH1.5, TBBTH2.0, TBBTH3.0, and TBBHT0, TBBHT0.2, TBBHT0.5, and TBBTH1.0, TBBHT1.5, respectively. Pictures of these samples are shown in Fig. 1.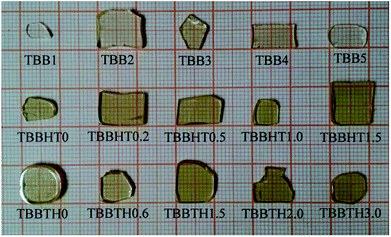 | ||
| Fig. 1 TeO2–B2O3–BaO glass substrates with different glass compositions and glass samples with different doping concentrations. | ||
Raman spectra
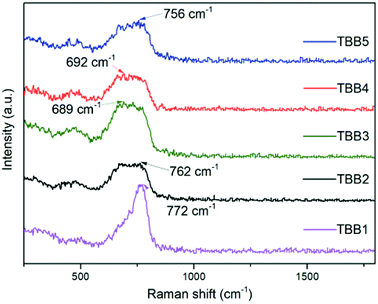
Raman spectroscopy can reflect the condition of the internal structure of the glass, which has an important influence on its thermal properties, spectral properties, etc. Fig. 2 presents the Raman spectra of the glass samples with a test range of 250–1800 cm−1. In these Raman spectra, the spectral band appearing at 160–190 cm−1 corresponds to the vibration of Ba2+. The peak at 450–475 cm−1 corresponds to the Te–O–Te or O–Te–O bending vibration. The peak at 550–560 cm−1 corresponds to the vibration of [BO4−], and the peak at 670–680 cm−1 corresponds to the asymmetric stretching vibration of the Te–O bond in [TeO4]. The Raman band at 750–770 cm−1 corresponds to the symmetric stretching vibration of Te–O in [TeO3] and [TeO3+1].14,15The peak with the largest wave number in the Raman spectrum represents the phonon energy of the matrix. The higher the phonon energy of the glass matrix, the greater the multi-phonon relaxation rate, which affects the radiation transition in the mid-infrared region, making fluorescence quenching more likely to occur in the glass. As can be seen from Fig. 2, the phonon energies of the glass substrates are 772 cm−1, 762 cm−1, 689 cm−1, 692 cm−1 and 756 cm−1, respectively, and are smaller than those of other glass substrates such as silicate (∼1100 cm−1), germanate (∼900 cm−1), etc. This indicates that the TeO2–B2O3–BaO glass system has the conditions required for use as a mid-infrared laser gain medium.
OH− group content
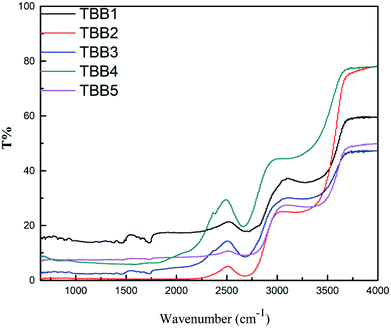
The strong vibration of each group in the glass network has a great influence on the intrinsic absorption.16 In the matrix material, an increase in the OH− content weakens the glass network structure, which in turn affects its absorption of infrared light. For mid-infrared laser glass materials, OH− can greatly reduce the fluorescence intensity and affect the fluorescence output in the mid-infrared band through the multi-phonon quenching mechanism. The infrared transmission spectrum of each glass sample is shown in Fig. 3. From the spectrum and the following formula:where I0 is the maximum transmittance of the glass, I is the transmittance near 3000 nm and l is the thickness of the glass sample, the absorption coefficient (α) of the hydroxyl groups in the sample can be determined. The calculated hydroxyl absorption coefficients in each sample are listed in Table 1. It is deduced that the hydroxyl content of TBB3 is relatively small.
| Glass | TBB1 | TBB2 | TBB3 | TBB4 | TBB5 |
|---|---|---|---|---|---|
| α (cm−1) | 4.769 | 7.324 | 4.49 | 5.59 | 5.77 |
Thermal stability
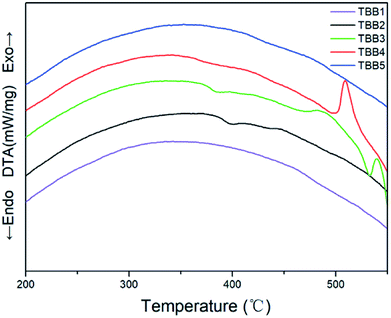
Thermal stability is one of the important parameters for measuring the properties of glass. Generally, ΔT (=Tx − Tg) is used to characterize the thermal stability of a glass. A large value of ΔT means that inhibition of crystallization and nucleation is strong, and the thermal stability is good. As can be seen in Fig. 4, the glass transition temperature (Tg) and crystallization temperature (Tx) increase with increasing B2O3 content. TBB1 and TBB5 did not observe significant crystallization peaks within the test range. The transition temperature of TBB3 is 375 °C and the crystallization temperature is 481 °C. Among the TBB2, TBB3 and TBB4 glass samples, only the ΔT of the TBB3 glass sample was larger than 100 °C (ΔT = 106 °C), indicating that the TBB3 glass has good thermal stability.A comprehensive comparison of the properties of the prepared undoped glass samples was carried out, and the TBB3 glass with less phonon energy, lower relative hydroxyl content and better thermal stability was selected as the matrix material for subsequent Tm3+/Ho3+ doping.
Absorption spectrum and Judd–Ofelt analysis
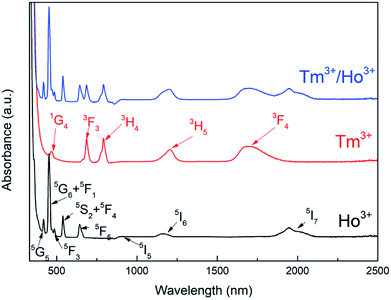
Fig. 5 displays the measured absorption spectra of Tm3+ and Ho3+ single-doped and Tm3+/Ho3+ co-doped TeO2–B2O3–BaO glass at 300–2500 nm. For the Ho3+ single-doped sample, the absorption spectrum was found to contain absorption bands centered at wavelengths of 420 nm, 452 nm, 486 nm, 538 nm, 644 nm, 902 nm, 1158 nm, and 1946 nm, which in turn correspond to the transitions from the ground state 5I8 to the excited states 5G5, 5G6 + 5F1, 5F3, 5S2 + 5F4, 5F5, 5I5, 5I6, and 5I7. For the Tm3+ single-doped sample, the absorption spectrum has five absorption bands at 466 nm, 686 nm, 792 nm, 1208 nm, and 1695 nm, which are attributed to the transition from the ground state 3H6 to the excited states 1G4, 3F3, 3H4, 3H5 and 3F4, respectively. In the Ho3+/Tm3+ co-doped sample, the absorption spectrum shows a superposition of Ho3+ and Tm3+ ion absorption peaks, and the positions of the respective absorption peaks did not change substantially.The measured absorption spectrum can be analyzed by J–O theory for the radiation transition characteristics in the 4fN structure of rare-earth ions.17,18 Based on J–O theory, the experimental oscillator strength (fexp) can be obtained using the following formula:
![[small lambda, Greek, macron]](https://www.rsc.org/images/entities/i_char_e0cc.gif) is the mean wavelength and OD (λ) is the optical density.
is the mean wavelength and OD (λ) is the optical density.
The theoretical oscillator strength can be obtained using the following equation:
| fcal = fed + fmd |
where h is Planck's constant, J is the total angular momentum quantum number, χed and χmd are the correction factors for the electric- and magnetic-dipole absorption transitions, and Sed and Smd are the electric- and magnetic-dipole transition line intensities of the transition from the S L J level to S′ L′ J′ level, respectively.
The Judd–Ofelt parameters and related spectral performance parameters of the Ho3+ ions in the TBBTH1.0 samples were calculated. Table 2 shows the experimental and theoretical oscillator strength of the Ho3+ in the glass sample. The root mean square error δ = 0.81 × 10⁻⁶, indicating that the calculation results are credible. The corresponding Judd–Ofelt intensity parameter Ωt was obtained by fitting. Table 3 shows the Ωt values of Ho3+ ions in TBB3 and other usual glass matrixes. Ω2 is closely related to the symmetry and order of the coordination field. The smaller the Ω2, the weaker the covalency of the bond between the rare-earth atom and the oxygen atom. It can be seen from the table that the Ω2 value of TeO2–B2O3–BaO glass is larger than that of other glass substrates such as fluoride, silicate and phosphate glass. This may be due to the presence of multiple polyhedral structural units in the glass. The value of Ω6 is related to the spontaneous radiation probability (Arad), which becomes larger as the value of Ω6 increases, and the large Arad is favorable for obtaining luminescence in the 2 μm band. In the TeO2–B2O3–BaO glass system, the value of Ω6 is larger than that in fluoride glass, phosphate glass and sulfide glass, and slightly smaller than that in germanate glass, indicating that the TeO2–B2O3–BaO glass system has better radiation transition properties.
| Final state | λ | fexp (×10−6) | fcal (×10−6) |
|---|---|---|---|
| a Ω2 = 5.62 × 10⁻²⁰, Ω4 = 2.46 × 10⁻²⁰, Ω6 = 1.72 × 10⁻²⁰, δ = 0.81 × 10⁻⁶. | |||
| 5G5 | 418 | 3.99 | 3.91 |
| 5F1 + 5G6 | 452 | 30.9 | 30.4 |
| 5F4 + 5S2 | 538 | 6.19 | 5.12 |
| 5F5 | 644 | 3.75 | 3.93 |
| 5I6 | 1154 | 1.06 | 1.45 |
According to the Ωt value calculated in Table 3, the main spectral parameters of the Ho3+ transitions at different energy levels in glass sample were further calculated, such as the spontaneous radiation probability (Arad), the branching ratio (β) and the radiation lifetime (τ), using the following formulae:
where h, e, J,
![[small lambda, Greek, macron]](https://www.rsc.org/images/entities/i_char_e0cc.gif) , Sed and Smd have the same meanings as above. n is the sample refractive index. The calculation results are shown in Table 4. It can be seen from Table 4 that the spontaneous radiation probability of Ho3+:4I7 → 5I8 in the glass sample that produces a 2 μm fluorescence band is 185.85 s−1, which is higher than that in other matrix materials such as germanate glass (94.5 s−1), fluoride glass (73.04 s−1) and silicate glass (71.64 s−1).24–26 The larger the value of Arad, the greater the probability of laser generation, and the more favorable it is for the output of the 2 μm laser.27
, Sed and Smd have the same meanings as above. n is the sample refractive index. The calculation results are shown in Table 4. It can be seen from Table 4 that the spontaneous radiation probability of Ho3+:4I7 → 5I8 in the glass sample that produces a 2 μm fluorescence band is 185.85 s−1, which is higher than that in other matrix materials such as germanate glass (94.5 s−1), fluoride glass (73.04 s−1) and silicate glass (71.64 s−1).24–26 The larger the value of Arad, the greater the probability of laser generation, and the more favorable it is for the output of the 2 μm laser.27
| Aed | Amd | Arad/s−1 | β/% | τ/ms | |
|---|---|---|---|---|---|
| 5I7 → 5I8 | 142.11 | 43.74 | 185.85 | 100 | 5.38 |
| 5I6 → 5I7 | 26.14 | 28.76 | 280.33 | 80.4 | 3.57 |
| 5I8 | 225.43 | ||||
| 5I5 → 5I6 | 9.715 | 13.066 | 207.301 | 38.1 | 4.82 |
| 5I7 | 105.48 | ||||
| 5I8 | 79.04 | ||||
| 5F5 → 5I5 | 10.49 | 3366.57 | 76.7 | 0.30 | |
| 5I6 | 134.08 | ||||
| 5I7 | 641.30 | ||||
| 5I8 | 2580.70 | ||||
| 5F4 → 5F5 | 15.96 | 8.215 | 5834.97 | 79.2 | 0.17 |
| 5I5 | 191.59 | ||||
| 5I6 | 392.80 | ||||
| 5I7 | 603.56 | ||||
| 5I8 | 4622.84 |
Fluorescence spectroscopy and concentration optimization
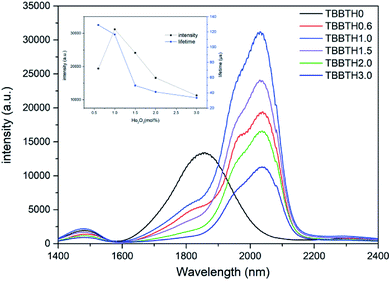
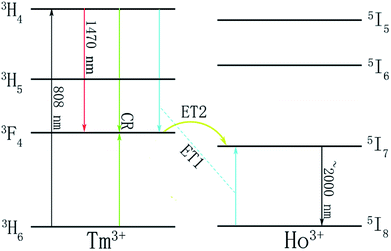
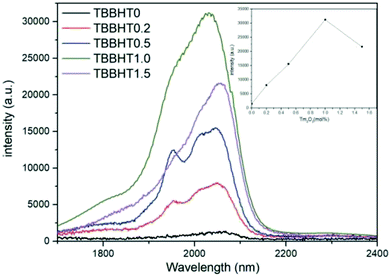
Fig. 6 shows the fluorescence spectrum in the mid-infrared range of Tm3+/Ho3+ co-doped glass with different Ho3+ doping concentrations under 808 nm excitation. The inset is a plot of the change in fluorescence intensity and fluorescence lifetime in glass samples with different Ho2O3 concentrations. There are mainly two luminescence peaks in Fig. 6, wherein the fluorescence peak of the Tm3+ single-doped sample is located near 1.8 μm, corresponding to the radiation transition of Tm3+:3F4 → 3H6. In the Tm3+/Ho3+ co-doped sample, the fluorescence peak appeared at around 2.0 μm, corresponding to the Ho3+:5I7 → 5I8 radiation transition. As the concentration of Ho3+ ions increases, the 1.8 μm luminescence peak gradually decreases, and due to the fluorescence quenching phenomenon caused by the high concentration of Ho3+, the fluorescence intensity at around 2 μm increases first and then decreases. Though the fluorescence lifetime suddenly decreases from TBBTH1.5 glass, there is no great difference between TBBTH0.6 and TBBTH1.0 and the intensity of the luminescence peak near 2.0 μm is the largest when the doping concentration of Ho2O3 is 1 mol%. It can be seen from the absorption spectrum in Fig. 5 that Ho3+ has no absorption peak near 808 nm, which indicates that there is an energy transfer process between Tm3+ and Ho3+. The energy level diagrams and energy transfer processes of Tm3+ and Ho3+ are shown in Fig. 7. Tm3+ ions first transition from the 3H6 level to the 3H4 level under excitation of 808 nm, and then they transfer to the 3F4 level manifold quickly in three ways. The first approach is that the Tm3+ ions in the excited state radiatively transfer to the 3F4 level and emit photons at 1.47 μm, the second is the cross-relaxation process between the Tm3+:3H4 state and Tm3+:3H6 state (3H4 + 3H6 → 3F4 + 3F4), and the last one is ET1 in Fig. 7, which is indicated as: 3H4(Tm) + 5I8(Ho) → 3F4(Tm) + 5I7(Ho), but it is so weak that we usually ignore it. Because the Tm3+:3F4 state and the Ho3+:5I7 state are very close, Tm3+ ions in the 3F4 state transfer their energy to the Ho3+:5I7 in the metastable state via 3F4 + 5I8 → 3H6 + 5I7 (ET2). Finally, Ho3+ produces fluorescence at around 2.0 μm by the transition from 5I7 to 5I8.In addition, in order to further analyze the influence of different concentrations of Tm3+ ions on the optical properties of the glass and to explore the optimal doping concentration, the doping concentration of Ho2O3 was fixed at 1 mol%, and the doping concentration of Tm2O3 was set as 0, 0.2, 0.5, 1.0 and 1.5 mol%, respectively. Fig. 8 is the fluorescence spectra of the Tm3+/Ho3+ co-doped glass samples with different concentrations of Tm3+ excited by an 808 nm laser. The inset shows the trend in fluorescence intensity of the glass samples with different Tm2O3 concentrations. When the concentration of Tm3+ increases from 0.2 mol% to 1 mol%, the fluorescence intensity near 2.0 μm gradually increases, and when the concentration continues to increase, the fluorescence intensity decreases. Therefore, it can be considered that a suitable concentration of Tm3+/Ho3+ co-doping in the glass system is Tm2O3: 1.0 mol% and Ho2O3: 1.0 mol%.
Emission cross-section and gain characteristics
The sample with a doping concentration of Tm2O3: 1.0 mol% and Ho2O3: 1.0 mol%, which is the optimum doping concentration, was selected to calculate the absorption and emission cross-sections from its absorption spectrum using the McCumber theory. The absorption cross-section (σabs) of the ground state energy level to the excited state energy level can be calculated from the absorption spectrum using the following formula:where N, l, I0, I and OD(λ), respectively, represent the doping concentration of rare-earth ions, the sample thickness, the input and transmit intensity, and the optical density.
The stimulated emission cross-section is an important parameter for evaluating the performance of laser glass. The stimulated emission cross-section of rare-earth ions can be calculated by McCumber theory.28 The formula is:
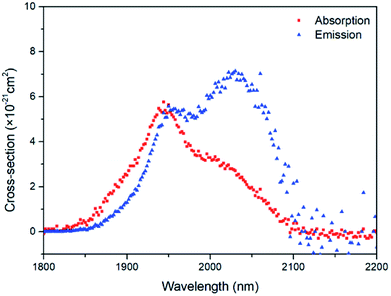
The coordination of Ho3+ in a variety of hosts is nearly the same, so Zl/Zu can be taken as 0.91, as reported in ref. 29. Fig. 9 shows the absorption and emission cross-sections of the Ho3+:5I7 → 5I8 transition. The maximum absorption cross-section of Ho3+ at 1944 nm is 5.76 × 10⁻²¹ cm2, and the maximum emission cross-section at 2030 nm is 7.13 × 10⁻²¹ cm2. The emission cross-section is larger than that of fluoride glass and germanate glass, indicating that the gain medium is more conducive to laser output at around 2.0 μm.
σem × τrad is an important indicator for measuring the performance of the gain medium. The larger the value, the better the performance of the gain matrix material. Table 5 presents a comparison of σem × τrad of this sample with other glass systems doped with Ho3+ ions. The value of σem × τrad in this glass system is 38.36 × 10⁻²¹ cm2 ms, which is larger than that of other glasses, indicating that this glass system has excellent gain performance.
The gain coefficient is also one of the important indicators for evaluating the gain performance of a laser gain medium. The gain coefficient of the laser medium can be deduced using the following formula:31
| G(λ) = N × [P × σem − (1 − P) × σabs] |
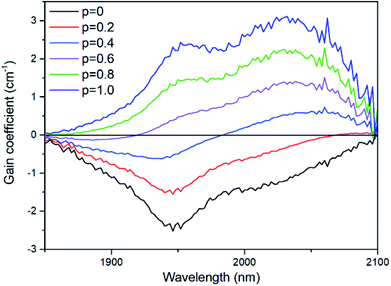
where ρ, M, M(Re3+) and NA, respectively, represent the sample density, the sum of the average molecular weights of the components in the sample, the molar percentage concentration of rare-earth ions and Avogadro's constant. The gain coefficient of the TBBTH1.0 glass that we calculated is shown in Fig. 10. The maximum gain coefficient of Ho3+ ions in the glass sample is 3.1 cm−1, which is larger than that of germanate glass (0.47 cm−1), lanthanum–tungsten–tellurite glass (1.2 cm−1) and fluorophosphate glass (0.66 cm−1).32–34 When the number of inverted ions increases to P = 0.3, the gain coefficient at 2000–2100 nm is already positive, indicating that the glass has excellent laser gain performance and a lower pumping threshold.
Conclusions
The TBB3 (67%TeO2–17%B2O3–16%BaO) glass substrate, which has less phonon energy, a lower relative hydroxyl content, better thermal stability and good anti-crystallization properties, was selected as the matrix material by analyzing the Raman spectrum, infrared transmission spectrum and DTA curve.A series of Tm3+/Ho3+ co-doped TeO2–B2O3–BaO glasses with different doping concentrations were prepared by the traditional melt-quenching technique. Through the analysis of the absorption spectra, the J–O parameters were calculated. The spontaneous radiative probability of Ho3+:5I7 → 5I8 was as high as 185.85 s−1. Under the pumping of an 808 nm laser diode, the optimum doping concentration for an emission peak at around 2.0 μm is Tm2O3: 1.0 mol% and Ho2O3: 1.0 mol%. For the TBBTH1.0 glass, the absorption cross-section at 1944 nm and the emission cross-section at 2030 nm of the Ho3+:5I7 → 5I8 transition reach 5.76 × 10⁻²¹ cm2 and 7.13 × 10⁻²¹ cm2, respectively. Furthermore, the value of σem × τrad of Ho3+ in TeO2–B2O3–BaO glass is also up to 38.36 × 10⁻²¹ cm2 ms. In addition, TBBTH1.0 has a lower pumping threshold and the gain coefficient of Ho3+ in it reaches 3.1 cm−1. All of these results indicate that the prepared Tm3+/Ho3+ co-doped TeO2–B2O3–BaO glass is an ideal mid-infrared laser gain medium.
Conflicts of interest
The authors declare no conflicts of interest.Acknowledgements
This work was supported by the National Natural Science Foundation of China (Grant No. 51772171).References
- G. J. Koch, M. Petros, J. Yu and U. N. Singh, Appl. Opt., 2002, 41, 1718–1721 CrossRef CAS PubMed.
- K. Scholle, E. Heumann and G. Huber, Laser Phys. Lett., 2004, 1, 285–290 CrossRef CAS.
- S. D. Jackson, F. Bugge and G. Erbert, Opt. Lett., 2007, 32, 2873–2875 CrossRef CAS PubMed.
- S. D. Jackson, Laser Photonics Rev., 2009, 3, 466–482 CrossRef CAS.
- R. Xu, J. Pan, L. Hu and J. Zhang, J. Appl. Phys., 2010, 108, 043522 CrossRef.
- G. Gao, L. Hu, H. Fan, G. Wang, K. Li, S. Feng, S. Fan, H. Chen, J. Pan and J. Zhang, Opt. Mater., 2009, 32, 402–405 CrossRef CAS.
- M. Wang, L. Yi, G. Wang, L. Hu and J. Zhang, Solid State Commun., 2009, 149, 1216–1220 CrossRef CAS.
- B. Zhou, E. Y. B. Pun, H. Lin, D. Yang and L. Huang, J. Appl. Phys., 2009, 106, 103–105 Search PubMed.
- L. D. D. Vila, L. Gomes, C. R. Eyzaguirre, E. Rodriguez, C. L. Cesar and L. C. Barbosa, Opt. Mater., 2005, 27, 1333–1339 CrossRef.
- W. Dong, Q. Yao, J. Zhang, L. Liu, J. Li and J. Wang, Cryst. Growth Des., 2018, 18, 5919–5926 CrossRef CAS.
- J. C. Sabadel, P. Armand, D. Cachau-Herreillat, P. Baldeck, O. Doclot, A. Ibanez and E. Philippot, J. Solid State Chem., 1997, 132, 411–419 CrossRef CAS.
- J. C. Sabadel, P. Armand, P. E. Lippens, D. Cachau-Herreillat and E. Philippot, J. Non-Cryst. Solids, 1999, 244, 143–150 CrossRef CAS.
- N. Manikandan, A. Ryasnyanskiy and J. Toulouse, J. Non-Cryst. Solids, 2012, 358, 947–951 CrossRef CAS.
- V. Nazabal, S. Todoroki, A. Nukui, T. Matsumoto, S. Suehara, T. Hondo, T. Araki, S. Inoue, C. Rivero and T. Cardinal, J. Non-Cryst. Solids, 2003, 325, 85–102 CrossRef CAS.
- S. Q. Man, E. Y. B. Pun and P. S. Chung, Opt. Commun., 1999, 168, 369–373 CrossRef CAS.
- J. Lucas, Curr. Opin. Solid State Mater. Sci., 1999, 4, 181–187 CrossRef CAS.
- B. R. Judd, Phys. Rev., 1962, 127, 750–761 CrossRef CAS.
- G. S. Ofelt, J. Chem. Phys., 1962, 37, 511–520 CrossRef CAS.
- F. Huang, X. Li, X. Liu, J. Zhang, L. Hu and D. Chen, Opt. Mater., 2014, 36, 921–925 CrossRef CAS.
- H. Chen, F. Chen, T. Wei, Q. Liu, R. Shen and Y. Tian, Opt. Commun., 2014, 321, 183–188 CrossRef CAS.
- X. Liu, M. Li, X. Wang, F. Huang, Y. Ma, J. Zhang, L. Hu and D. Chen, J. Lumin., 2014, 150, 40–45 CrossRef CAS.
- K. Kadono, M. Shojiya, M. Takahashi, H. Higuchi and Y. Kawamoto, J. Non-Cryst. Solids, 1999, 259, 39–44 CrossRef CAS.
- Q. Zhang, J. Ding, Y. Shen, G. Zhang, G. Lin, J. Qiu and D. Chen, J. Opt. Soc. Am. B, 2010, 27, 975–980 CrossRef CAS.
- X. Fan, P. Kuan, K. Li, L. Zhang, D. Li and L. Hu, Opt. Mater. Express, 2015, 5, 1356–1365 CrossRef.
- Y. Tian, X. Jing and S. Xu, Spectrochim. Acta, Part A, 2013, 115, 33–38 CrossRef CAS PubMed.
- M. Li, Y. Guo, G. Bai, Y. Tian, L. Hu and J. Zhang, J. Quant. Spectrosc. Radiat. Transfer, 2013, 127, 70–77 CrossRef CAS.
- J. Heo, Y. B. Shin and J. N. Jang, Appl. Opt., 1995, 34, 4284–4289 CrossRef CAS PubMed.
- D. E. McCumber, Phys. Rev., 1964, 134, A299 CrossRef.
- B. Zhou, E. Y. Pun, H. Lin, D. Yang and L. Huang, J. Appl. Phys., 2009, 106, 103105 CrossRef.
- Y. B. Shin, J. N. Jang and J. Heo, Opt. Quantum Electron., 1995, 27, 379–386 CrossRef CAS.
- V. K. Tikhomirov, J. Méndez-Ramos, V. D. Rodríguez, D. Furniss and A. B. Seddon, J. Alloys Compd., 2007, 436, 216–220 CrossRef CAS.
- J. Fan, Y. Fan, Y. Yang, D. Chen, L. Calveza, X. Zhang and L. Zhang, J. Non-Cryst. Solids, 2011, 357, 2431–2434 CrossRef CAS.
- K. Li, Q. Zhang, S. Fan, L. Zhang, J. Zhang and L. Hu, Opt. Mater., 2010, 33, 31–35 CrossRef CAS.
- Y. Tian, L. Zhang, S. Feng, R. Xu, L. Hu and J. Zhang, Opt. Mater., 2010, 32, 1508–1513 CrossRef CAS.
| This journal is © The Royal Society of Chemistry 2019 |

