 Open Access Article
Corrosion inhibition of carboxylate inhibitors with different alkylene chain lengths on carbon steel in an alkaline solution
Bing Lin and
Yu Zuo *
*
Beijing Key Laboratory of Electrochemical Process and Technology for Materials, College of Materials Science and Engineering, Beijing University of Chemical Technology, Beijing 100029, China. E-mail: zuoy@mail.buct.edu.cn
First published on 1st March 2019
Abstract
The inhibition effects of five organic carboxylate compounds with different alkylene chain lengths on Q235 steel in a simulated carbonation concrete pore solution (pH 11.5) were studied using quantum chemical calculations, electrochemical measurement and surface analysis. The results show that the adsorption capacity of the inhibitors increases with increasing distance between the C![[double bond, length as m-dash]](https://www.rsc.org/images/entities/char_e001.gif) C bond and COO– group. As the alkylene chain length increases, the absolute surface charge value increases and the inhibition effectiveness tends to increase. C11 shows the best inhibition. The carboxylate inhibitors adsorb on a steel surface by forming Fe–OOC–Cx compounds and the C
C bond and COO– group. As the alkylene chain length increases, the absolute surface charge value increases and the inhibition effectiveness tends to increase. C11 shows the best inhibition. The carboxylate inhibitors adsorb on a steel surface by forming Fe–OOC–Cx compounds and the C![[double bond, length as m-dash]](https://www.rsc.org/images/entities/char_e001.gif) C bonds could enhance the adsorption process.
C bonds could enhance the adsorption process.
1. Introduction
Corrosion leads to the degradation of materials due to the chemical or electrochemical interaction between the materials and the surrounding environments.1 The corrosion of reinforcing steel in concretes is the major cause of degradation of concrete structures. Normally, reinforcing steels are protected by the passivation film formed on the surface due to the alkaline environment in concretes.2 However, the passive film may be broken by the carbonation of concretes3,4 and the presence of chlorides.5,6 Pitting corrosion, initiated by the partial breakdown of the passive film,7,8 can accelerate the mechanical failure of structural components by perforation or forming crack nucleation sites.7–9 The economic aspect combined with security and environmental concerns have provided continuous motivation for the research community to develop new methods to reduce the impact of corrosion.1Corrosion inhibitors are very attractive due to their high efficiency and low costs.2 Unfortunately, there are drawbacks for traditional inhibitors such as toxicity and risky effects when the inhibitors are added in poor dosage. The researches on green corrosion inhibitors have been addressed towards cheap and effective molecules with negligible or no environmental impact.1–3,9–11 In recent decades, the research on new type organic corrosion inhibitors and the inhibition mechanism has been paid much attention. Marco et al.10 studied 80 kinds of organic inhibitors for preventing chloride-induced corrosion, the results show that carboxylate substances, especially poly-carboxylates, showed very good inhibition effectiveness. Carboxylates adsorbed on steel surface through the delocalized electrical charge on the two oxygen atoms of the carboxylic group, and the alkyl carbon chain could form a hydrophobic layer covered on the passive film.10,11 The adsorption of carboxylate inhibitors depends on the physico-chemical properties of the functional groups and electron density at the donor atom.13–16 The study by Hefter et al.11 revealed that the inhibition performance of mono-carboxylates inhibitors in neutral solution are critically dependent upon their chain length. Marco10 studied the influence of carbon-chain length for poly-carboxylates of the series −OOC–(CH2)n–COO− (n in the range of 0–7) and pointed out the existence of an optimal chain length for the inhibition effect. The pitting potential (Epit) increases first then decreases with the increase of the intermediate chain length, and the Epit reaches the maximum for an intermediate chain length (n = 3). Several researchers12,15,17 have studied the effect of carbon chain length of inhibitors in acid solution. They got the same results that the inhibition efficiency increased with the augment of the alkyl chain length attached to imidazolium ring for the inhibitors, which was attributed to the electron-donating effect of alkyl groups. For the past a few years, there was a lot of interests in studying new compounds to inhibit corrosion, as well as in understanding the inhibition mechanism.10 Thus, it is important to further understand the effect of carbon chain length on the corrosion inhibition in various environments, particularly in alkaline environments on which there were few previous reports.
This work aims to assess the corrosion inhibition effect as well as the inhibition mechanism of five kinds of organic olefine acid with different carbon chain lengths on Q235 carbon steel in a simulated concrete pore solution. Quantum chemical calculations have been used to predict the anticorrosive capability of the examined inhibitors. The roles and the effects of alkylenel chain length in these inhibitors on corrosion inhibition have been investigated by using different electrochemical measurements and surface techniques.
2. Experiment methods
2.1 Materials and solutions
Q235 carbon steel was studied with following chemical composition (wt%): C 0.11, Si 0.13, Mn 0.74, S 0.028, P 0.012, O 0.01 and Fe balance. The size of the electrochemical test sample was 8 mm × 8 mm × 10 mm. The working electrode was covered with epoxy resin, leaving a 0.64 cm2 area exposed to the test solution. The working surface for all samples was polished by grit papers from 240# to 1000#, and cleaned with de-ionized water and ethanol.The testing solution was 0.0021 mol L−1 NaOH, 0.0042 mol L−1 KOH and 0.02 mol L−1 NaCl, which was intended to present the pore solution within a carbonated concrete environment.18 The examined inhibitors are listed in Table 1. All the inhibitors used in the experiment were analytical grade chemicals. The pH value of the testing solution was adjusted to 11.5 ± 0.2 by using 0.01 M NaOH and 0.01 M HCl, and all tests were carried out at room temperature.
| Lable | Inhibitor | Molecular structure |
|---|---|---|
| C3 | Acrylic acid | CH2![[double bond, length as m-dash]](https://www.rsc.org/images/entities/char_e001.gif) CH–COO− CH–COO− |
| C5 | Allylacetic acid | CH2![[double bond, length as m-dash]](https://www.rsc.org/images/entities/char_e001.gif) CH–(CH2)2–COO− CH–(CH2)2–COO− |
| C7 | 6-Heptenoic acid | CH2![[double bond, length as m-dash]](https://www.rsc.org/images/entities/char_e001.gif) CH–(CH2)4–COO− CH–(CH2)4–COO− |
| C11 | Undecylenic acid | CH2![[double bond, length as m-dash]](https://www.rsc.org/images/entities/char_e001.gif) CH–(CH2)8–COO− CH–(CH2)8–COO− |
| C18 | Oleic acid | CH3–(CH2)7–CH![[double bond, length as m-dash]](https://www.rsc.org/images/entities/char_e001.gif) CH–(CH2)7–COO− CH–(CH2)7–COO− |
2.2 Quantum chemical calculation
Quantum chemical calculation was performed using Materials Studio 7.0 software.19–21 The Density Functional Theory (DFT) method, B3LYP, combined with the 6-311G(d,p) basis22–24 set was used in this study. Full geometry optimizations were carried out on carboxylate ions due to the alkaline environment. Quantum chemical parameters were computed including the energy of the highest occupied molecular orbital (EHOMO), the energy of the lowest unoccupied molecular orbital (ELUMO), energy band gap (ΔE), chemical potential (μ), electronegativity (X), chemical hardness (η), electrophilicity (ω) and nucleophilicity (ε).19–26 The quantum chemical reactivity indices were derived from the frontier molecular orbital energies (EHOMO and ELUMO) using appropriate relations (eqn (1)–(5)) as previously reported in literature.18–24| ΔE = ELUMO − EHOMO | (1) |
| X = −μ = −(ELUMO + EHOMO)/2 | (2) |
| η = −ΔE/2 | (3) |
| ω = X2/2η | (4) |
| ε = 1/ω | (5) |
2.3 Electrochemical measurements
Linear polarization was used to measure the polarization resistance (Rp) by potential scanning at the rate of 0.1667 mV s−1 in the range Ecorr ± 10 mV, and the results was fitted by CVIEW2 software. The cyclic potentiodynamic polarization (CPP) curves and impedance measurements were tested in the test solution with a CS350 electrochemical workstation (Correst, Wuhan, China). The CPP tests were measured after 1 h immersion with a 0.1667 mV s−1 scan rate from −300 mV below the open circuit potential in the anodic direction until the current density increased up to 0.02 mA cm−2, then the potential scanning was reversed at the same scanning rate until the test ended. Impedance measurements, in order to calculate the potential of zero charge (PZC) of steel,27,28 were carried out using AC signals of a 15 mV potential perturbation and the scanning frequency range was 100 kHz to 0.01 Hz. The impedance data were fitted by ZSimpWin software. A three-electrode system was used in the electrochemical tests. A platinum electrode functioned as counter electrode, the steel specimen worked as the working electrode and the reference electrode was a saturated calomel reference electrode (SCE). Six tests were run under each experimental condition, and the electrochemical data form the parallel tests were statistically analyzed.2.4 Concrete environment
To further confirm the inhibition effect of tested inhibitors for steel in concrete environment, the corrosion rate of Q235 steel in concrete was measured. Reinforced concrete specimens were prepared with 425# Portland cement, dried fine river sand and distilled water with the ratio of 1![[thin space (1/6-em)]](https://www.rsc.org/images/entities/char_2009.gif) :
:![[thin space (1/6-em)]](https://www.rsc.org/images/entities/char_2009.gif) 3
3![[thin space (1/6-em)]](https://www.rsc.org/images/entities/char_2009.gif) :
:![[thin space (1/6-em)]](https://www.rsc.org/images/entities/char_2009.gif) 0.7 (wt%).28,29 The studied inhibitors were added into the distilled water (0.1% of the total weight of concrete) and the pH value of the water was adjusted to 7. The steel sample was positioned in order to have a concrete cover of 20 mm thick. The concrete specimens were dried at room temperature for three days and then immersed in 3.5% (wt%) NaCl solution (pH 7). The corrosion rate of Q235 carbon steel was measured by linear polarization test with a three-electrode system as mentioned above, up to 20 days.
0.7 (wt%).28,29 The studied inhibitors were added into the distilled water (0.1% of the total weight of concrete) and the pH value of the water was adjusted to 7. The steel sample was positioned in order to have a concrete cover of 20 mm thick. The concrete specimens were dried at room temperature for three days and then immersed in 3.5% (wt%) NaCl solution (pH 7). The corrosion rate of Q235 carbon steel was measured by linear polarization test with a three-electrode system as mentioned above, up to 20 days.
2.5 Weight loss measurements
Samples with size of 50 mm × 25 mm × 2 mm were immersed in 500 mL test solution without or with various concentrations of inhibitors at room temperature (25 ± 1 °C) for 7 days. Three parallel samples were used for each condition. After immersion, the corrosion products were removed by 17% HCl solution with 3.5 g L−1 hexamethylene tetramine (HMTA) for 10 min, and the samples were cleaned with de-ionized water and ethanol, then were weighted. The corrosion rate (CR) and inhibition efficiency (IE%) were calculated according the weight loss results.2.6 Surface observation and characterization
A 4 mm × 4 mm × 3 mm carbon steel sample was polished to 1000# grit, rinsed with de-ionized water and ethanol. After immersion in test solution without and with 500 ppm inhibitors for 24 h. The steel coupons were rinsed with de-ionized water, then dried in hot air.Scanning electron microscopy (SEM) was used to observe the surface morphology of the samples with a Quanta 650 instrument (FEI, USA). Electrochemical scanning tunneling microscope (EC-STM) was used to detect the 3D morphology and surface roughness of the steel samples, and the tunneling current was 50 nA and the scanning range was 2000 nm. Six parallel scans were performed on each sample.
Raman spectrum was obtained using a Raman Renishaw microscopy (system 3000) coupled to an Olympus optical microscope and a CCD (600 × 400 pixels) detector. X-ray photoelectron spectroscopy (XPS) test was performed to analyze the surface composition on a Thermo Fisher ESCALAB 250 spectrometer. The binding energy values of the peaks were calibrated by C 1s peak at 248.8 eV.
3. Results and discussion
3.1 Quantum chemical calculation
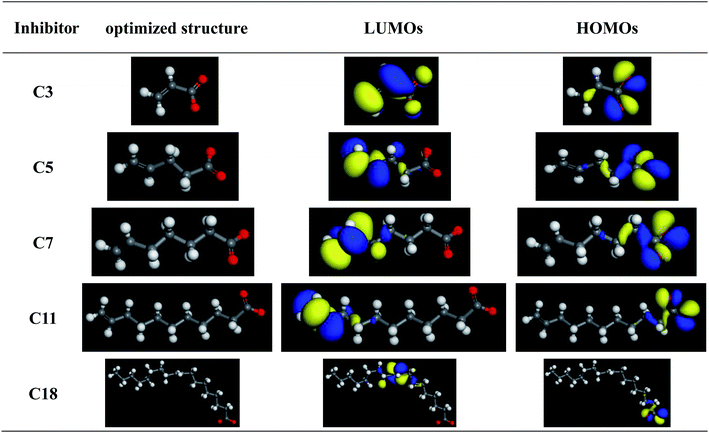
Quantum chemical calculation was used to investigate the interaction between the inhibitors and the steel surface. Adsorption is well known to be the key mechanism of organic inhibitor action, which suggests that the inhibitor molecules are adhered on the metal surface area where the cathodic and anodic reactions take place.25 The optimized molecular structures, highest occupied molecular orbital (HOMO) and lowest unoccupied molecular orbital (LUMO) electronic density distributions are shown Fig. 1. Obviously, HOMO is distributed around the oxygen atom of the carboxylate radical while LUMO is located near the C![[double bond, length as m-dash]](https://www.rsc.org/images/entities/char_e001.gif) C double bond of the inhibitors. Hence the studied compounds can donate electrons via carboxylic group but majorly host accepted electrons through the C
C double bond of the inhibitors. Hence the studied compounds can donate electrons via carboxylic group but majorly host accepted electrons through the C![[double bond, length as m-dash]](https://www.rsc.org/images/entities/char_e001.gif) C bonds.
C bonds.
As we know, quantum chemical calculation is a very important tool to establish a useful correlation between molecular structure and corrosion inhibition efficiency.16,24 In consistent with Fukui theory,26 HOMO and LUMO of reacting species could affect the transition of electrons during the adsorption process. EHOMO is normally used to describe the electron-donating ability of a compound. Generally, molecules which have higher EHOMO are more easily to donate electrons to the unfilled molecular orbital of suitable acceptor molecules with low energy.21 Previous studies showed that the inhibition efficiency increases with the increasing EHOMO values.23,26 In contrast, the ELUMO value is related to the capability of a molecule to accept electrons. Molecules with a lower ELUMO are more easily to accept electron and accommodate the redundant charge of the metal surface.21 In addition, it was shown that the inhibitor not only donates electron to the unoccupied d orbital of the metal surface but also accepts electron from the d orbital of the metal leading to the formation of a feedback bond.23,26 The calculated quantum chemical parameters are listed in Table 2. As the carbon chain length increases the EHOMO slightly increase, and the ELUMO decreases as the carbon chain length increases except for the sodium oleate (C18), which may be due to that the distance between the C![[double bond, length as m-dash]](https://www.rsc.org/images/entities/char_e001.gif) C bond and –COO− is smaller than that in 10-undecylenic acid (C11). The ELUMO decreases as the distance between the C
C bond and –COO− is smaller than that in 10-undecylenic acid (C11). The ELUMO decreases as the distance between the C![[double bond, length as m-dash]](https://www.rsc.org/images/entities/char_e001.gif) C bond and –COO− increases. ΔE is an important parameter as a function of reactivity of the inhibitor molecule towards the adsorption on the metallic surface. As the energy gap (ΔE) decreases the adsorption energy between the inhibitors and iron surface would increase.22,30 Bereket et al.31 showed that the excellent corrosion inhibitors are usually organic compounds which not only offer electrons to unoccupied orbital of the metal but also accept free electrons from the metal. The results indicate that the energy gap decreases as the distance between the C
C bond and –COO− increases. ΔE is an important parameter as a function of reactivity of the inhibitor molecule towards the adsorption on the metallic surface. As the energy gap (ΔE) decreases the adsorption energy between the inhibitors and iron surface would increase.22,30 Bereket et al.31 showed that the excellent corrosion inhibitors are usually organic compounds which not only offer electrons to unoccupied orbital of the metal but also accept free electrons from the metal. The results indicate that the energy gap decreases as the distance between the C![[double bond, length as m-dash]](https://www.rsc.org/images/entities/char_e001.gif) C bond and –COO− increases. C11 that shows the lowest ΔE may have the best inhibition effect.
C bond and –COO− increases. C11 that shows the lowest ΔE may have the best inhibition effect.
| EHOMO | ELUMO | ΔE | μ | X | η | ΔU | |
|---|---|---|---|---|---|---|---|
| C3 | −0.575 | 4.555 | 5.13 | 1.99 | −1.99 | 2.565 | 1.752 |
| C5 | −0.696 | 3.947 | 4.643 | 1.626 | −1.626 | 2.325 | 1.858 |
| C7 | −0.581 | 3.035 | 3.161 | 1.227 | −1.227 | 1.808 | 2.275 |
| C11 | −0.519 | 2.161 | 2.68 | 0.821 | −0.821 | 1.34 | 2.918 |
| C18 | −0.523 | 2.408 | 2.931 | 0.943 | −0.943 | 1.466 | 2.710 |
The obtained results in Table 2 show that the electronegativity increases as the carbon chain length increases, in consistent with the decrease of the chemical potential. As it is known, the absolute hardness and softness are important properties to measure the molecular stability and reactivity. Chemical hardness (η) fundamentally signifies the resistance to deformation or polarization of the electron clouds of the atoms, ions or molecules under small perturbation of chemical reaction.26,30 Whereas, a hard molecule has a large energy gap and a soft molecule has a small energy gap. Our result shows that the η value decreases with the increase of the distance between the C![[double bond, length as m-dash]](https://www.rsc.org/images/entities/char_e001.gif) C bond and –COO−.
C bond and –COO−.
The fraction of electrons transferred from the inhibitor to metallic surface (ΔN) is calculated by eqn (6):22–24,26
 | (6) |
![[double bond, length as m-dash]](https://www.rsc.org/images/entities/char_e001.gif) C bond and –COO−.
C bond and –COO−.
From the quantum chemical calculation results, the inhibition effect was influenced by the distance between the C![[double bond, length as m-dash]](https://www.rsc.org/images/entities/char_e001.gif) C bond and –COO−, and the inhibition effect increases as the distance increases. C11 is the best inhibitor in this study.
C bond and –COO−, and the inhibition effect increases as the distance increases. C11 is the best inhibitor in this study.
3.2 Electrochemical measurements
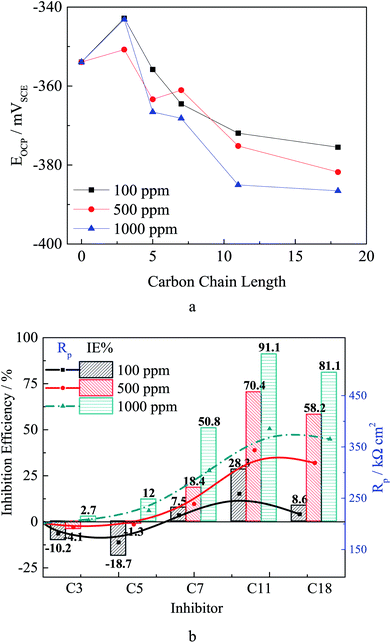
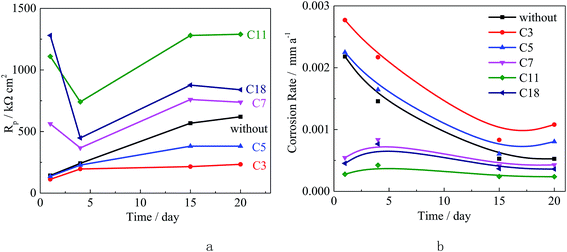
Fig. 2 shows the open circuit potential (OCP) and the Rp results. The OCP for the uninhibited is about −355 mV, and the OCP slightly increases after adding test inhibitors. As the compounds carbon chain length increases, the OCP values decreases. This result is the same to the literature,11 indicating the olefin carboxylate compounds act as mix-type inhibitor in the test system.10,11 In addition, as the inhibitor concentration increases the OCP slightly decreases, which might be attributed to the increased adsorption quantity and the surface coverage.
As the carbon chain length increases, the Rp value shows an increasing tendency, which is due to the stero-hindrance effect of the carbon chain. The adsorbed inhibitor could form a hydrophobic barrier on the steel surface, and repress the corrosion reaction.10–12 The Rp value increases as the inhibitor concentration increases, especially for the inhibitors with more carbon atoms. According to the inhibition efficiency (IE%) calculated from the Rp, in Fig. 2, the short chain length compounds are either slightly corrosive (low concentration for C3 and C5) or as weak inhibitors (high concentration for C3 and C5 and low concentration for other inhibitors) for carbon steel. The inhibition effectiveness increases as the carbon chain length increases, especially for the high concentration inhibitors, and the highest IE% was obtained in solution with 1000 ppm C11. These results confirm the results of the quantum chemical calculation.
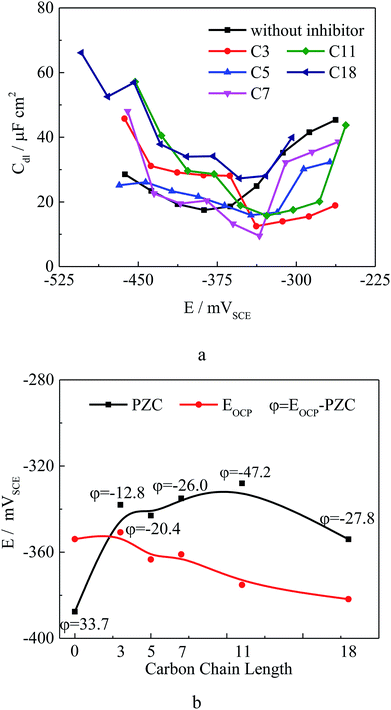
In order to further understand the inhibition mechanism, the potential of zero charge (PZC) was measured for Q235 carbon steel in test solution with 500 ppm different inhibitors. The PZC plays a very important role in the electrostatic adsorption process.27,33–35 Fig. 3a shows the variation of Cdl with the applied potential and Fig. 3b shows the measured PZC and the open circuit potential (OCP) values in test solution with different inhibitors. The surface charge of carbon steel may be obtained at OCP using the equation φ = EOCP − EPZC.27,33 For the un-inhibited situation, at OCP carbon steel surface carries excess positive charge in test solution. This result is similar to the literature,27,33–35 which favors the adsorption of the negatively charged Cl− and OH− onto the carbon steel surface. After adding 500 ppm different compounds, the PZC increases and the φ value changed to negative, which is attributed to the adsorption of the inhibitors on carbon steel. The absolute φ value increases as the carbon chain length of compounds increases, showing the same tendency of the quantum chemical calculation results. The inhibitor could be attracted to the steel surface by static electricity (physical adsorption),36 and the adsorption can directly occur through sharing lone electron pair of the oxygen in –COO− with the unoccupied d orbital of iron atoms to form coordinate covalent bond (chemical adsorption).37 Moreover, the double bond in the compounds allows back donation of iron d-electrons to form feedback bond in turn since the existence of various orientations of iron's d orbital.35,36
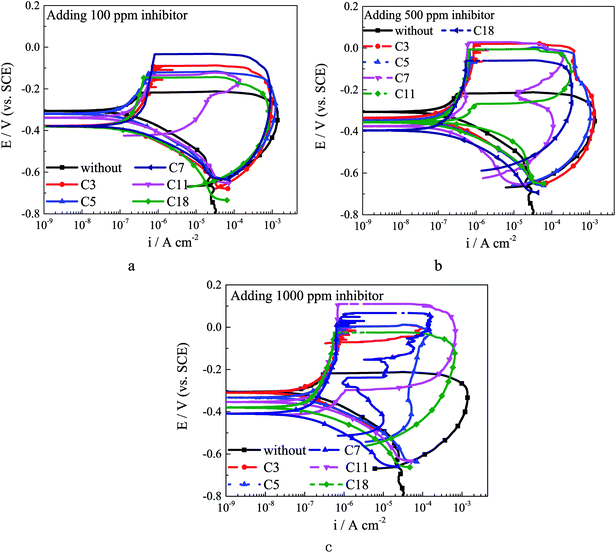 | ||
| Fig. 4 The CPP curves for Q235 carbon steel in test solution with different inhibitors: (a) 100 ppm inhibitor; (b) 500 ppm inhibitor; (c) 1000 ppm inhibitor. | ||
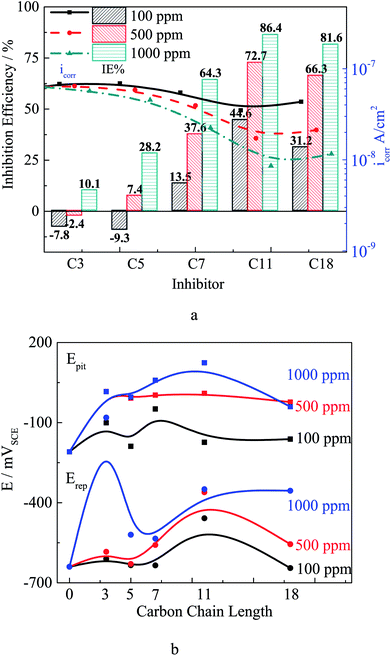
Pitting potential (Epit) is the potential at which the anodic current increases rapidly,10,39 and localized corrosion starts above this potential. As shown in Fig. 5, after adding 100 ppm different inhibitors the Epit slightly increases, and the alkylene chain length has barely effect on Epit at this concentration. The Epit value increases obviously as the inhibitor concentration increases, which might be attributed to the selective adsorption of inhibitor ions in competition with chloride ions at the active sites on the steel surface in early stage of immersion. The selective adsorption will lead to a heterogeneous adsorption which will effectively reduce the susceptibility to pitting corrosion. In addition, carboxylate reaches the metal surface before chloride ions in a competition.38 Self-aggregation of carboxylates at steel/electrolyte interface could form a new protective film on passivation film, and the protection ability of the hydrophobic film would be affected by the alkylene chain length. The repassivation potential (Erep) is the intersection potential of the forward and reverse scans, and the steel potential must be above Erep for existing pits to propagate.40 The addition of inhibitor leads the increasing of Erep as the inhibitor concentration increases. The dramatical increase of Erep for C3 treated steel might be attributed to that the adsorption process is affected by the combination of inductive effect and resonance effect on the electron density of the molecule.10 The inductive effect depends on the electronegativity of the substituent group10 and the short alkylene chain of C3 leads the electron cloud migration. The Erep increases as the alkylene chain length increases. The carboxylate inhibitor could affect the repassivation process by a chelate effect to form complexes with iron ions,38 which could precipitate on the bottom of pits to form protective film. The results of polarization curves indicate that the carboxylate inhibitor could enhance the corrosion resistance of both general corrosion and localized corrosion.
3.3 Adsorption isotherm
Table 3 shows the corrosion rate (CR) and inhibition efficiency (IE%) values obtained from weight loss method at different concentrations of carboxylate compounds after 7 days at room temperature (25 °C). The corrosion rate decreases gradually and the corrosion efficiency increases along with the increase of the alkylene chain length. The IE% values obtained by weight loss are consist with the results of electrochemical measurements and the maximum IE% is 90.2% at 1000 ppm C11. The IE% increases with the increasing inhibitor concentration, which reveals that the inhibitor ions may compete with chloride ions and the adsorption could take place via electrostatic attraction between the cations and ions from inhibitor and the steel surface.41,42| Inhibitor | C3 | C5 | C7 | C11 | C18 | |
|---|---|---|---|---|---|---|
| Without | CR | 0.1107 | ||||
| 100 ppm | CR | 0.1189 | 0.1240 | 0.0980 | 0.0726 | 0.0931 |
| IE% | −7.35% | −12% | 11.5% | 34.4% | 15.9% | |
| 300 ppm | CR | 0.1126 | 0.1153 | 0.0896 | 0.0434 | 0.0584 |
| IE% | −1.7% | −4.1% | 19.1% | 60.8% | 47.3% | |
| 500 ppm | CR | 0.1072 | 0.1075 | 0.0825 | 0.0309 | 0.0425 |
| IE% | 3.2% | 2.9% | 25.5% | 72.1% | 61.6% | |
| 750 ppm | CR | 0.1062 | 0.0981 | 0.0617 | 0.0161 | 0.0251 |
| IE% | 4.1% | 11.4% | 44.3% | 85.5% | 77.3% | |
| 1000 ppm | CR | 0.1053 | 0.0901 | 0.0492 | 0.0109 | 0.0179 |
| IE% | 4.9% | 18.6% | 55.6% | 90.2% | 83.8% | |
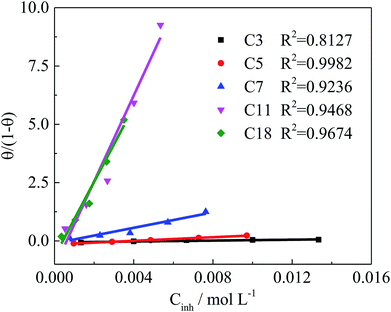
The adsorption type of inhibitors on the steel surface, such as physisorption or chemisorption, can provide more information about the properties of the inhibition effect.21,25 The surface coverage (θ), calculated by the weight loss results, are used to find the best adsorption isotherm.25 In the present study, the θ value is calculated by the weight loss method (θ = 0.01 × IE% (ref. 21 and 25)). The general equations for the Langmuir isotherm models is:21,25,28
 | (7) |
The change of Gibbs free energy of adsorption (ΔGads) is calculated by following equation:21,25,28
| ΔGads = −RT × ln(55.5 × Kads) | (8) |
![[double bond, length as m-dash]](https://www.rsc.org/images/entities/char_e001.gif) C bonds in the carbon chain. The above results indicate that the effect of the carbon chain length on inhibition efficiency is closely related to the environmental parameters, such as pH and the species in the solution, which would obviously affect the adsorption and film forming processes of the inhibitor on the surface.
C bonds in the carbon chain. The above results indicate that the effect of the carbon chain length on inhibition efficiency is closely related to the environmental parameters, such as pH and the species in the solution, which would obviously affect the adsorption and film forming processes of the inhibitor on the surface.
| Inhibitor | C3 | C5 | C7 | C11 | C18 |
|---|---|---|---|---|---|
| Kads | 9.63 | 38.6 | 166.1 | 1842.1 | 1603.3 |
| ΔGads (kJ mol−1) | −15.56 | −19.00 | −22.62 | −28.58 | −28.23 |
3.4 Surface analysis
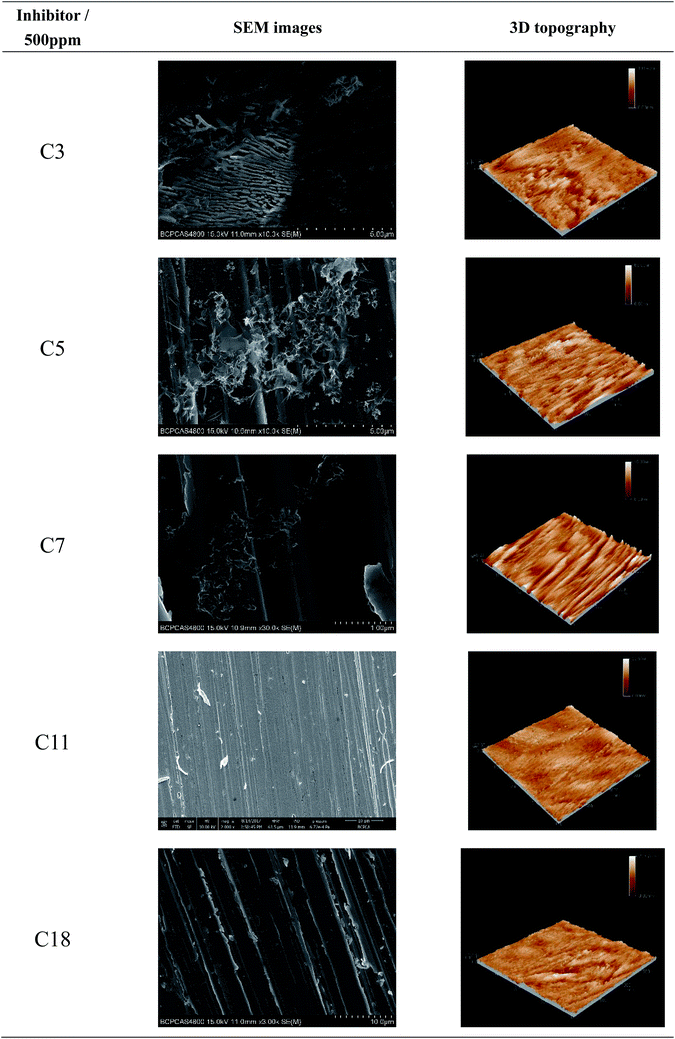 | ||
| Fig. 8 SEM images and 3D topography of the steel specimens after 24 h exposure to the test solution with different inhibitors. | ||
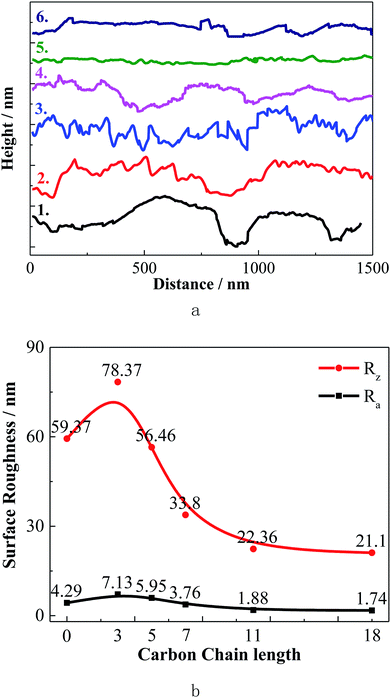
The overall 3D topography of the steel specimens under experimental condition was provided by EC-STM. The roughness values provide important information about the inhibition efficiency46 and the corresponding height profile graph is shown in Fig. 9. Compared with the sample immersed in the solution without inhibitor, after adding C3 and C5, corrosion of the carbon steel was enhanced. The surface roughness of the steel decreases obviously as the alkylene chain length increases. These 3D topographies and average roughness values reveal that the corrosion inhibitive ability of C11 and C18 are much better than the other inhibitors. The results of surface morphology are consistent with the electrochemical test and weight loss test data.
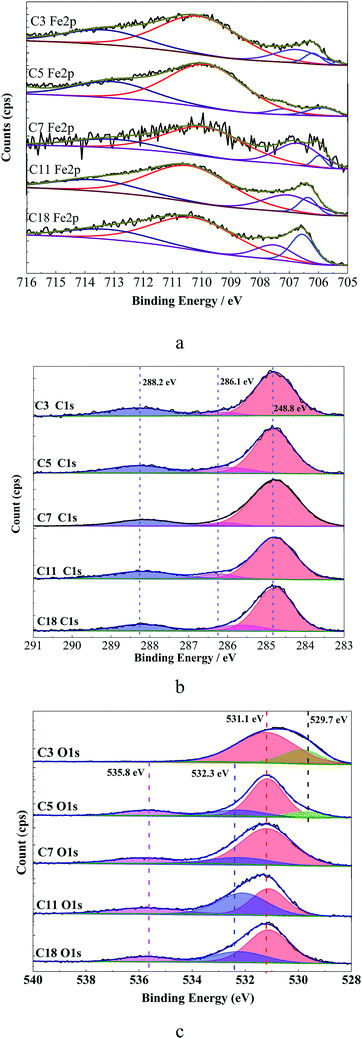 | ||
| Fig. 10 XPS spectra for Q235 steel surface immersed in test solution with different inhibitors for 24 h, (a) Fe 2p3/2, (b) C 1s, (c) O 1s. | ||
As shown in Fig. 10a, the first peak at 706.7 ± 0.2 eV (ref. 47) is attributable to metallic iron on the sample surface. The peak at 707.6 ± 0.3 eV is assigned to FeO, and the peak at 710.7 ± 0.3 eV is assigned to Fe3+ on the steel surface or a certain degree of oxidation of Fe (Fe2O3/Fe3O4).22 Both the preparation process or corrosion reactions during immersion process could result in iron atoms of different valences.22,48 The peak at 713.5 ± 0.4 eV can be ascribed to the satellite of Fe3+ which is probably related to the presence of FeCl3 from the testing environment.49 The C 1s spectrum for immersed steel surface shows three peaks, as shown in Fig. 10b. The first largest peak is attributed to the C–C and C–H aliphatic bonds with binding energy of 284.8 ± 0.02 eV,50,51 the second is attributed to the C![[double bond, length as m-dash]](https://www.rsc.org/images/entities/char_e001.gif) C bonds with a binding energy of 286 ± 0.25 eV,52 and the third peak may be assigned to the carbon atom of the C–O and C
C bonds with a binding energy of 286 ± 0.25 eV,52 and the third peak may be assigned to the carbon atom of the C–O and C![[double bond, length as m-dash]](https://www.rsc.org/images/entities/char_e001.gif) O bonds in carboxylate radical with binding energy of 288.3 ± 0.15 eV.51,52 The C 1s spectrum consists with the carboxylate chemical structure and confirms the adsorption of inhibitors. The C
O bonds in carboxylate radical with binding energy of 288.3 ± 0.15 eV.51,52 The C 1s spectrum consists with the carboxylate chemical structure and confirms the adsorption of inhibitors. The C![[double bond, length as m-dash]](https://www.rsc.org/images/entities/char_e001.gif) C bonds of C18 shifts to negative, indicating that the C
C bonds of C18 shifts to negative, indicating that the C![[double bond, length as m-dash]](https://www.rsc.org/images/entities/char_e001.gif) C bonds accept the feedback electrons from Fe atoms52 which might lead to decrease of the inhibition effect. The O 1s spectra for different inhibitors treated steel surface are shown in Fig. 10c. The first peak at 529.7 ± 0.1 eV is ascribed to O2− which is related to the oxygen atoms bonded to Fe in Fe2O3 and/or Fe3O4 oxides.51,52 The peaks at 531.1 eV of C
C bonds accept the feedback electrons from Fe atoms52 which might lead to decrease of the inhibition effect. The O 1s spectra for different inhibitors treated steel surface are shown in Fig. 10c. The first peak at 529.7 ± 0.1 eV is ascribed to O2− which is related to the oxygen atoms bonded to Fe in Fe2O3 and/or Fe3O4 oxides.51,52 The peaks at 531.1 eV of C![[double bond, length as m-dash]](https://www.rsc.org/images/entities/char_e001.gif) O and 532.3 eV of –C–O group show that the inhibitor adsorbed on the steel surface via the –COO− group.22 The last peak at 535.8 eV might be attributed to oxygen in the adsorbed water.41 These results confirm the adsorption of organic inhibitors on steel surface, and the hydrophobic film formed on steel surface could further make a contribution to reduce corrosion. The compositions of the protective films formed on carbon steel surface in the alkaline environment with studied inhibitors have no distinct difference. The carboxylate inhibitors adsorbed on the passivation film via the carboxylic group, and the alkylene tail would form a hydrophobic film to protect the steel from corrosion.
O and 532.3 eV of –C–O group show that the inhibitor adsorbed on the steel surface via the –COO− group.22 The last peak at 535.8 eV might be attributed to oxygen in the adsorbed water.41 These results confirm the adsorption of organic inhibitors on steel surface, and the hydrophobic film formed on steel surface could further make a contribution to reduce corrosion. The compositions of the protective films formed on carbon steel surface in the alkaline environment with studied inhibitors have no distinct difference. The carboxylate inhibitors adsorbed on the passivation film via the carboxylic group, and the alkylene tail would form a hydrophobic film to protect the steel from corrosion.
The surface analysis performed by Raman spectroscopy show that the corrosion inhibition of tested inhibitors is due to the formation of a chemisorption film on the steel surface. Raman spectrum of the deposited layer on the steel surface is shown in Fig. 11. The peaks at 221 cm−1, 283 cm−1 and 405 cm−1 might be attributed to the iron oxide or hydroxide, such as FeOOH or Fe3O4 on the steel surface.53 The peaks at about 600–700 cm−1 might be assigned to C![[double bond, length as m-dash]](https://www.rsc.org/images/entities/char_e001.gif) O bending absorption,54 and the peak position slightly shift to negative as the alkylene chain length increases. The peaks at about 1292 cm−1 and 1589 cm−1 are attributed to the C–H bending and the alkylene stretching, respectively.37 The Raman results reveal the presence of a complex film formed on the steel surface which consists of iron oxide or hydroxide and carboxylate inhibitor. The formation of a complex with carboxylate inhibitor depends on the electrode potential, the solution pH value and inhibitor concentration. In the pH 11.5 solution, the deprotonated inhibitor forming Cx–COO−, and then form a complex film Fe–OOC–Cx. The peaks at about 600 cm−1 shift to negative as the alkylene chain length increases, which reveals that the COO–Fe bond becomes stronger.55 The differences in solubility of different iron–carboxylate compounds lead to different inhibition effects. After the complex film formed, the alkylene chain in the inhibitor would form a hydrophobic film which could enhance the protection of the steel from the corrosion. In addition, the chloride ions may possibly take part in the complex composition as [Fe–Cl–OOC–Cx] in the film,37 and the adsorption of chloride ions might occur by coordination of the pairs of free electrons form oxygen atoms with iron.
O bending absorption,54 and the peak position slightly shift to negative as the alkylene chain length increases. The peaks at about 1292 cm−1 and 1589 cm−1 are attributed to the C–H bending and the alkylene stretching, respectively.37 The Raman results reveal the presence of a complex film formed on the steel surface which consists of iron oxide or hydroxide and carboxylate inhibitor. The formation of a complex with carboxylate inhibitor depends on the electrode potential, the solution pH value and inhibitor concentration. In the pH 11.5 solution, the deprotonated inhibitor forming Cx–COO−, and then form a complex film Fe–OOC–Cx. The peaks at about 600 cm−1 shift to negative as the alkylene chain length increases, which reveals that the COO–Fe bond becomes stronger.55 The differences in solubility of different iron–carboxylate compounds lead to different inhibition effects. After the complex film formed, the alkylene chain in the inhibitor would form a hydrophobic film which could enhance the protection of the steel from the corrosion. In addition, the chloride ions may possibly take part in the complex composition as [Fe–Cl–OOC–Cx] in the film,37 and the adsorption of chloride ions might occur by coordination of the pairs of free electrons form oxygen atoms with iron.
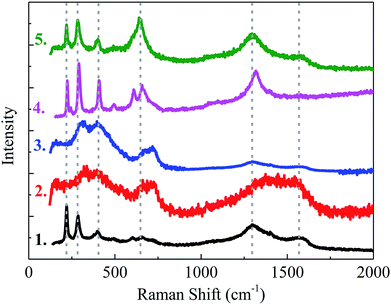 | ||
| Fig. 11 Raman spectroscopy on the steel specimen after 24 h exposure to the test solution with different inhibitors, (1) C3, (2) C5, (3) C7, (4) C11, (5) C18. | ||
In short, the inhibition mechanism of carboxylate inhibitors for Q235 carbon steel in carbonated concrete pore solution is as follows: firstly, the carboxylate ions produced by the inhibitor hydrolysis may compete with Cl− during adsorption to protect the matrix. In the second place, the adsorption of inhibitor via electrostatic attraction and donor–acceptor interactions could form a complex film. The C![[double bond, length as m-dash]](https://www.rsc.org/images/entities/char_e001.gif) C bonds accept feedback electrons from Fe to enhance the adsorption. And the alkylenel tail in the carboxylate could form a hydrophobic film to enhance the protection of the steel. In addition, the inhibition effect of carboxylate inhibitors is related to the solubility of compounds, hence a longer carbon chain would have bigger hydrophobicity and a lower water solubility. At last, the carboxylate ions could get into the corrosion pits and form a deposition film to facilitate the repassivation process. As the alkylene chain length of the inhibitors increase, the inhibitor is much easier to adsorb on the steel surface, and the adsorption film shows more effective corrosion inhibition characteristic.
C bonds accept feedback electrons from Fe to enhance the adsorption. And the alkylenel tail in the carboxylate could form a hydrophobic film to enhance the protection of the steel. In addition, the inhibition effect of carboxylate inhibitors is related to the solubility of compounds, hence a longer carbon chain would have bigger hydrophobicity and a lower water solubility. At last, the carboxylate ions could get into the corrosion pits and form a deposition film to facilitate the repassivation process. As the alkylene chain length of the inhibitors increase, the inhibitor is much easier to adsorb on the steel surface, and the adsorption film shows more effective corrosion inhibition characteristic.
4. Conclusions
In this work, the corrosion inhibition efficiency of five kinds of carboxylate with different alkylene chain lengths on Q235 carbon steel in a simulated carbonated concrete pore solution (pH 11.5) with 0.01 M Cl− was studied, and the following conclusions can be drawn:(1) The quantum chemical calculation results indicate that the HOMO is distributed over the carboxylic group, and the LUMO is distributed near the C![[double bond, length as m-dash]](https://www.rsc.org/images/entities/char_e001.gif) C bonds. The adsorption of the studied compounds via the donate electrons from the –COO−, and the C
C bonds. The adsorption of the studied compounds via the donate electrons from the –COO−, and the C![[double bond, length as m-dash]](https://www.rsc.org/images/entities/char_e001.gif) C bonds could accept the feedback electrons from steel. The adsorption capacity of inhibitor increases with the increasing distance between the C
C bonds could accept the feedback electrons from steel. The adsorption capacity of inhibitor increases with the increasing distance between the C![[double bond, length as m-dash]](https://www.rsc.org/images/entities/char_e001.gif) C bond and the COO−.
C bond and the COO−.
(2) The electrochemical test results consist with the quantum chemical calculation results. The results reveal that the carboxylate inhibitors act as mix-type inhibitor. The adsorption of inhibitors lead the surface charge of steel changed to negative, and as the alkylene chain length increases, the absolute surface charge value increases.
(3) As the carbon chain length increases, the inhibition effectiveness tends to increase. The inhibitor concentration also shows important effect on the inhibition efficiency. For general corrosion, C7, C11 and C18 show inhibition effect and the IE increases with the concentration, while C3 and C5 show no inhibition. For pitting corrosion, all the tested inhibitors show inhibition effect and the IE also increases with the inhibitor concentration. Both for general corrosion and pitting, the highest IE% is obtained in the test solution with 1000 ppm C11.
(4) The adsorption of carboxylate compounds follows the Langmuir adsorption isotherm and the C7, C11 and C18 adsorb on steel surface via both physisorption and chemisorption. C11 and C18 can effectively reduce the surface roughness after 24 h expose. The surface composition results reveal that the protective films formed on carbon steel by different inhibitors have no distinct difference. The carboxylate inhibitor adsorb on steel surface by forming Fe–OOC–Cx compounds and the C![[double bond, length as m-dash]](https://www.rsc.org/images/entities/char_e001.gif) C bonds could enhance the adsorption process. The alkylene tail in the inhibitors could form a hydrophobic film to protect the steel.
C bonds could enhance the adsorption process. The alkylene tail in the inhibitors could form a hydrophobic film to protect the steel.
Conflicts of interest
There are no conflicts to declare.Acknowledgements
The authors would like to thank the National Natural Science Foundation of China (Contract 51210001) for support to this work.References
- K. Xhanari and M. Finšgar, RSC Adv., 2016, 6(67), 62833–62857 RSC.
- M. V. Diamanti, E. A. P. Rosales, G. Raffaini, F. Ganazzoli, A. Brenna, M. Pedeferri and M. Omellese, Corros. Sci., 2015, 100, 231–241 CrossRef CAS.
- Y. Cao, S. Dong, D. Zheng, J. Wang, X. Zhang, R. Du, G. Song and C. Lin, Corros. Sci., 2017, 126, 166–179 CrossRef CAS.
- F. Cao, J. Wei, J. Dong and W. Ke, Corros. Sci., 2015, 100, 365–376 CrossRef CAS.
- Z. Yang, H. Fischer and R. Polder, Mater. Corros., 2013, 64(12), 1066–1074 CrossRef CAS.
- M. Jin, J. Xu, L. Jiang, Y. Xu and H. Chu, Ionics, 2015, 21(10), 2981–2992 CrossRef CAS.
- W. Mai, S. Soghrati and R. G. Buchheit, Corros. Sci., 2016, 110, 157–166 CrossRef CAS.
- G. S. Frankel, ChemInform, 1998, 29(32), 2186–2197 Search PubMed.
- K. K. Sankaran, R. Perez and K. V. Jata, J. Mater. Sci. Eng. A, 2001, 297(1), 223–229 CrossRef.
- M. Ormellese, L. Lazzari, S. Goidanich, G. Fumagalli and A. Brenna, Corros. Sci., 2009, 51(12), 2959–2968 CrossRef CAS.
- G. T. Hefter, N. A. North and S. H. Tan, Corrosion, 1997, 53(8), 657–667 CrossRef CAS.
- G. Vastag, A. Shaban, M. Vraneš, A. Tot, S. Belića and S. Gadžurić, J. Mol. Liq., 2018, 264(15), 526–533 CrossRef CAS.
- O. Olivares, N. V. Likhanova, B. Gómez, J. Navarrete, M. E. Llanos-Serrano, E. Arce and J. M. Hallen, Appl. Surf. Sci., 2006, 252(8), 2894–2909 CrossRef CAS.
- E. Khamis, Corrosion, 2012, 46(6), 476 CrossRef.
- F. A. Azeez, O. A. Al-Rashed and A. A. Nazeer, J. Mol. Liq., 2018, 265(1), 654–663 CrossRef CAS.
- A. A. Nazeer, N. K. Allam, G. I. Youssef and E. A. Ashour, Ind. Eng. Chem. Res., 2011, 50(14), 8796–8802 CrossRef.
- F. Li, S. Zhang, Y. Qiang, S. Xu, B. Tan and S. Chen, Mater. Chem. Phys., 2018, 215(15), 229–241 Search PubMed.
- H. Yu, K. T. K. Chiang and L. Yang, Constr. Build. Mater., 2012, 26(1), 723–729 CrossRef.
- F. E. Heakal, S. A. Rizk and A. E. Elkholy, J. Mol. Struct., 2018, 1152(15), 328–336 CrossRef.
- F. E. Heakal, S. K. Attia, S. A. Rizk, M. A. Abou Essa and A. E. Elkholy, J. Mol. Struct., 2017, 1147(5), 714–724 CrossRef.
- H. U. Nwankwo, L. O. Olasunkanmi and E. E. Ebenso, Sci. Rep., 2017, 7(1), 2436 CrossRef PubMed.
- Z. Zhang, N. Tian, W. Zhang, X. Huang, L. Ruan and L. Wu, Corros. Sci., 2016, 111, 675–689 CrossRef CAS.
- Ş. Erdoğan, S. Z. Safi, S. Kaya, D. ÖzbakırIşın, L. Guo and C. Kaya, J. Mol. Struct., 2017, 1134(15), 751–761 CrossRef.
- F. Zhang, Y. Tang, Z. Cao, W. Jing, Z. Wu and Y. Chen, Corros. Sci., 2012, 61(8), 1–9 CrossRef CAS.
- E. Honarmand, H. Mostaanzadeh, M. H. Motaghedifard, M. Hadi and M. Khayadkashani, Prot. Met. Phys. Chem. Surf., 2017, 53(3), 560–572 CrossRef CAS.
- L. H. Madkour, S. Kaya, L. Guo and C. Kaya, J. Mol. Struct., 2018, 1163, 397–417 CrossRef CAS.
- S. Rameshkumar, I. Danaee, M. Rashvandavei and M. Vijayan, J. Mol. Liq., 2015, 212, 168–186 CrossRef CAS.
- Y. wang, Y. Zuo, X. Zhao and S. Zha, Appl. Surf. Sci., 2016, 379, 98–110 CrossRef CAS.
- T. Bellezze, D. Timofeeva, G. Giuliani and G. Roventi, Cem. Concr. Res., 2018, 107, 1–10 CrossRef CAS.
- I. B. Obot and N. O. Obi-Egbedi, Corros. Sci., 2010, 52(1), 198–204 CrossRef CAS.
- G. Bereket, E. Hür and C. Öğretir, J. Mol. Struct.: THEOCHEM, 2002, 578(1), 79–88 CrossRef CAS.
- H. M. A. El-Lateef, Res. Chem. Intermed., 2016, 42(4), 3219–3240 CrossRef.
- A. Popova, E. Sokolova, S. Raicheva and M. Christov, Corros. Sci., 2003, 45(1), 33–58 CrossRef.
- R. Solmaz, G. Kardaş, M. Çulha, B. Yazici and M. Erbil, Electrochim. Acta, 2008, 53(20), 5941–5952 CrossRef CAS.
- M. A. Amin, S. S. A. El-Rehim, E. E. F. El-Sherbini and R. S. Bayoumi, Electrochim. Acta, 2007, 52(11), 3588–3600 CrossRef CAS.
- N. Dinodi and A. N. Shetty, Corros. Sci., 2014, 85(4), 411–427 CrossRef CAS.
- M. M. Mennucci, E. P. Banczek, R. P. R. Rodrigues and I. Costa, Cem. Concr. Compos., 2009, 31(6), 418–424 CrossRef CAS.
- A. S. Fazayel, M. Khorasani and A. A. Sarabi, Appl. Surf. Sci., 2018, 441, 895–913 CrossRef CAS.
- ASTM G61-86, ASTM International, United States, 2009, pp. 19428–22959 Search PubMed.
- F. Blin, P. Koutsouko, P. Klepetsianis and M. Forsyth, Electrochim. Acta, 2007, 52(21), 6212–6220 CrossRef CAS.
- M. Bouanis, M. Tourabi, A. Nyassi, A. Zarrouk, C. Jama and F. Bentiss, Appl. Surf. Sci., 2016, 389(15), 952–966 CrossRef CAS.
- M. Lagrenée, B. Mernari, N. Chaibi, M. Traisnel, H. Vezin and F. Bentiss, Corros. Sci., 2001, 43(5), 951–962 CrossRef.
- A. M. Al-Sabagh, H. M. Abd-El-Bary, R. A. El-Ghazawy, M. R. Mishrif and B. M. Hussein, Egypt. J. Pet., 2011, 20(2), 33–45 CrossRef CAS.
- S. A. Ali, M. T. Saeed and S. U. Rahman, Corros. Sci., 2003, 45(2), 253–266 CrossRef.
- M. A. Quraishi and R. Sardar, Mater. Chem. Phys., 2003, 78(2), 425–431 CrossRef CAS.
- B. Tan, S. Zhang, Y. Qiang, L. Guo, L. Feng, C. Liao, Y. Xu and S. Chen, J. Colloid Interface Sci., 2018, 526(15), 268–280 CrossRef CAS PubMed.
- R. Dudric, A. Vladescu, V. Rednic, M. Neumann, I. G. Deac and R. Tetean, J. Mol. Struct., 2014, 1073(5), 66–70 CrossRef CAS.
- N. Nakayama and A. Obuchi, Corros. Sci., 2003, 45(9), 2075–2092 CrossRef CAS.
- A. Galtayries, R. Warocquier-Clérout, M. D. Nagel and P. Marcus, Surf. Interface Anal., 2006, 38(4), 186–190 CrossRef CAS.
- S. P. Trasatti, Corros. Rev., 2015, 33(6), 373–393 Search PubMed.
- I. Frateur, A. Carnot, S. Zanna and P. Marcus, Appl. Surf. Sci., 2006, 252(8), 2757–2769 CrossRef CAS.
- X. Pang, X. Ran, F. Kuang, J. Xie and B. hou, Chin. J. Chem. Eng., 2010, 18(2), 337–345 CrossRef CAS.
- N. Gartner, T. Kosec and A. Lega, Mater. Chem. Phys., 2016, 184, 31–40 CrossRef CAS.
- J. A. Calderón, F. A. Vásquez and J. A. Carreño, Mater. Chem. Phys., 2017, 185, 218–226 CrossRef.
- S. T. Selvi, V. Raman and N. Rajendran, J. Appl. Electrochem., 2003, 33(12), 1175–1182 CrossRef.
| This journal is © The Royal Society of Chemistry 2019 |

