 Open Access Article
Identification and characterization of a T-2 toxin-producing Fusarium poae strain and the anti-tumor effect of the T-2 toxin on human hepatoma cell line SMMC-7721†
Wenhe Zhu‡
 ,
Lei Liu‡,
Yuan Dong,
Guixian Meng,
Lu Tang,
Yan Li,
Jianhui Cai* and
Huiyan Wang*
Jilin Medical University, Jilin 132013, China. E-mail: jlmpcwhy@163.com; Fax: +86-0432-64560460; Tel: +86-0432-64560460
First published on 21st March 2019
Abstract
T-2 toxin, produced by Fusarium moulds, is a type A trichothecene mycotoxin which is known to inhibit protein synthesis and also reported to induce DNA lesions, potentially causing DNA fragmentation. T-2 toxin is a very potent cytotoxic toxin, which displays anti-tumor properties. Nevertheless, more studies are still needed to explore its antitumor mechanisms as well as its clinical application in cancer treatment. Here, we report the identification and characterization of a T-2 toxin produced by a Fusarium poae isolated from Jilin, Northeast China. 17 strains of Fusarium poae were screened for T-2 toxin-production and one strain with the highest yield was selected further studies. T-2 toxin produced by the selected Fusarium poae was isolated and purified by HPLC. Anticancer properties of the purified T-2 toxin were evaluated with human hepatoma cell SMMC-7721. The purified T-2 toxin inhibits the proliferation of SMMC-7721 cells and induces cell apoptosis. The mitochondrial membrane potential decreased and the intracellular ROS was up-regulated after T-2 treatment of the cells. Further studies revealed that T-2 treatment activates the intrinsic mitochondrial and MAPKs pathway. Our data provide insight into the promising application of the T-2 toxin in cancer treatment.
1. Introduction
Trichothecenes, a family of toxic sesquiterpenoid metabolites produced by Fusarium, Stachybotrys and other fungi, cause a spectrum of adverse effects in experimental animals that include food refusal, growth suppression, emesis, neuroendocrine changes, and immunotoxicity.1–3 T-2 toxin and HT-2 toxin are type A trichothecene mycotoxins produced by Fusarium moulds. Previous work has shown that different grains including maize, oat, barley, wheat, rice and soya beans, may be contaminated with the T-2 toxin.4 Studies have shown that the T-2 toxin was rapidly metabolized to the HT-2 toxin in vivo and in vitro. In view of the great harm to the health of humans and livestock, the toxicological effects of T-2 toxin were reported in the Joint Food and Agriculture Organization/World Health Organization (FAO/WHO) Expert Committee on Food Additives.5The T-2 toxin is a very potent cytotoxic and immunosuppressive toxin, which can cause acute intoxication and chronic diseases in both humans and animals.6 T-2 toxin is known to inhibit protein synthesis by binding peptidyl-transferase and was also reported to induce DNA lesions, potentially causing DNA fragmentation. T-2 toxin was described as an inhibitor of eukaryotic protein biosynthesis and as pro-apoptotic. T-2 toxin mainly acts on exuberant proliferation cells or tissues, such as thymus, lymph, bone marrow and displays the potential application value in cancer therapy.7,8 Huang et al. reported that 10 nM T-2 toxin affected U937 cell viability, induced nuclear and DNA fragmentation and caspase-3 activation.9 Zhuang et al. reported that T-2 toxin could induce the HeLa and Bel-7402 cell apoptosis by the mitochondrial pathway and Jun D is down-regulated in T-2 toxin induced cell apoptosis.10
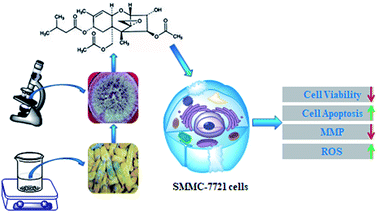
T-2 toxin is often produced by different Fusarium species, including F. sporotrichioides, F. poae, and F. acumimatum, which may grow on a variety of cereal gains, especially in cold climate regions or during wet storage conditions.11 Currently, there are few studies on the toxin producing condition of Fusarium. The overall strategy and mechanism was displayed in Scheme 1. In this study, we reported to isolate and characterization of a F. poae strain with high-production of T-2 toxin from Jilin, Northeast China. T-2 toxin from the established strain was purified and its anticancer properties were evaluated with human liver cancer cell.
2. Materials and methods
2.1 Materials
Silica gel, acetone, acetonitrile and methanol were purchased from Sinopharm Chemical Reagent Co., Ltd. T-2 toxin standards were purchased from Sigma Chemical Co. Ltd., (St. Louis, US). SMMC-7721 human hepatoma cell line was provided by the Institute of Biochemistry and Cell Biology, Chinese Academy of Sciences (Shanghai, China). Dulbecco's Modified Eagle's Medium (DMEM) was obtained from Gibco® (USA). Dimethyl sulfoxide (DMSO, analytical grade) was purchased from Beijing Chemical Reagent Factory (Beijing, China). SOD and MDA diagnostic kits were purchased from Jiancheng Bioengineering Institute (Jiancheng Bioengineering Institute, Nanjing, China). The antibodies against Bcl-2, Bax and cleaved caspase-3, cleaved caspase-9, cleaved PARP and Cyto C were purchased from Santa Cruz Biotechnology (Santa Cruz, USA). ERK, p-ERK, p38, p-p38 and β-actin were purchased from Sigma-Aldrich Company (St. Louis, MO, USA). All other chemicals were of analytical grade.2.2 Isolation of Fusarium poae from corn
The mouldy corn seeds were soaked in 70% ethanol for 3–5 s, and then put into the 1% sodium hypochlorite to sterilize for 8–10 min. Cleaned the surface for three time with sterile water and placed it in the PDA plate (200 g potato, 20 g glucose, 15 g agar, dissolved in 1000 mL distilled water. It was previously autoclaved for 20 minutes at 121 °C). Each plate placed 3 corn seeds and incubated in the dark at 25 °C for 7 days and examined at regular intervals, and the dominant were fungi isolated in pure culture. When the mycelia appeared, picked mycelium to a new PDA plate.2.3 Screening of T-2 toxin-producing strains
The Fusarium strains (17 strains) which were preliminarily identified according to their morphological characteristics were amplified on PDA plate at 25 °C for 7 days. Then, it was inoculated into mung bean broth medium (Mung bean 50 g, dissolved in 1000 mL distilled water, boiled for 3 minutes, filtrated. It was previously autoclaved for 20 minutes at 121 °C) and shaked culture at 25 °C for 7 days. Then the spore suspension was inoculated into corn granule medium (corn 50 g, placed in a triangular flask, add 500 mL distilled water for 12 h, filter out water. Corn 50 g, placed in a triangular flask, add 500 mL distilled water for 12 hours, and filter out water. It was previously autoclaved for 20 minutes at 121 °C). After incubating at 12 °C for 30 days in artificial climate box for producing of toxin. Then harvested the culture material, dried in a forced draught oven at 50 °C for 12 h, and stored at 4 °C until used. Ethyl acetate is added to soak the culture and filtered. The extract was concentrated and dissolved in acetone. Then the seed germination inhibition test was proceeded. T-2 toxin was analyzed by HPLC. The HPLC condition is as followed: C3 column, grain size: 5 μm specification: 4.6 × 250 mm, sample size: 10 μL, temperature: 25 °C, mobile phase: methanol/water (80![[thin space (1/6-em)]](https://www.rsc.org/images/entities/char_2009.gif) :
:![[thin space (1/6-em)]](https://www.rsc.org/images/entities/char_2009.gif) 20, volume ratio); flow rate: 1 mL min−1; ultraviolet detector: UV = 208 nm.
20, volume ratio); flow rate: 1 mL min−1; ultraviolet detector: UV = 208 nm.
2.4 Isolation and purification of T-2 toxin by HPLC
20 g harvested culture was dissolved in 80% ethanol at 25 °C for 2 h and filtered. Filtrate was concentrated and extracted by n-hexane. The combined extraction solution was dried at 40 °C and dissolved in 3 mL methanol. The T-2 toxin was purified by silica gel chromatography firstly. A glass column (30 cm × 6 cm i.d.) was packed with 300 g silica gel. After cleaning with one column volume (Vc = 500 mL) of petroleum ether, the column was equilibrated. Then, 10 g of extraction solution was added to the top of the column, elution was performed with a petroleum ether-ethyl acetate gradient (2![[thin space (1/6-em)]](https://www.rsc.org/images/entities/char_2009.gif) :
:![[thin space (1/6-em)]](https://www.rsc.org/images/entities/char_2009.gif) 1, v/v). Fractions were collected (80 mL) and analyzed by TLC. Fractions of the same compounds were pooled. TLC analyses were performed on GF254 silica gel plates at room temperature, using petroleum ether-ethyl acetate (5
1, v/v). Fractions were collected (80 mL) and analyzed by TLC. Fractions of the same compounds were pooled. TLC analyses were performed on GF254 silica gel plates at room temperature, using petroleum ether-ethyl acetate (5![[thin space (1/6-em)]](https://www.rsc.org/images/entities/char_2009.gif) :
:![[thin space (1/6-em)]](https://www.rsc.org/images/entities/char_2009.gif) 5, v/v) as eluent. Spots were visualized under an ultraviolet lamp at 365 nm.
5, v/v) as eluent. Spots were visualized under an ultraviolet lamp at 365 nm.
After purification with the silica gel chromatography, the harvested T-2 toxin was entered into the rotary evaporator for evaporation crystallization. The crystallization was dissolved in methanol and then purified by HPLC. In order to obtain T-2 toxin product with high purity, the preparative HPLC purification method was optimized. C3 column (grain size: 5 μm specification: 20 × 150 mm, sample size: 1000 μL) was selected. Fixing the flow rate (10 mL min−1), T-2 toxin was purified by using different methanol solutions (from 40% to 60% methanol in ultra-pure water) as the mobile phase. Using the optimized mobile phase, 50 mg of the T-2 extract was purified at different flow rates (from 6 to 19 mL min−1). Then, using the optimized mobile phase at the optimized flow rate, varying quantities of the T-2 toxin were purified in the experiment. The detection wavelength was 208 nm for monitoring T-2 toxin and the sample solution was injected into the preparative HPLC column through a sample port (10 mL). The peak fraction of T-2 toxin was collected manually according to the preparative HPLC chromatogram.
After HPLC separation, the purification T-2 toxin was detected by HPLC using an Agilent C3 (4.6 × 250 mm, i.d. 5 μm), column temperature 30 °C, mobile phase methanol-60% aqueous acetic acid, a gradient of 0–60 min, a flow rate of 1.0 mL min−1 and detection at 208 nm. The structures of the isolated compounds were identified using ESI-MS and 1H NMR.
2.5 MTT assay
In vitro anti-tumor activity was examined by an MTT assay, following the procedure in the original report.12 SMMC-7721 HepG2 and Bel-7401 cells lines were obtained from the Institute of Basic Medical Science, Chinese Academy of Medical Sciences (Beijing, China). For MTT assay, SMMC-7721 HepG2 and Bel-7401 cells were seeded at a concentration of 5.0 × 10⁴ cells per mL (200 μL total) in a 96-well assay plate. After 24 h incubation at 37 °C under 5% CO2, the test substance was added. Each concentration was tested three times. The same volume of solution without the test substance was used as a control. The cells were incubated for 24 h, and then 20 μL of MTT solution (5 mg mL−1) was added to each well and incubated for another 4 h. After removal of medium, 200 μL dimethyl sulfoxide (DMSO) was added to each cell, and the optical density (OD) was measured at 490 nm using a Bio-assay reader (Bio-Rad550, USA). The relative cell viability was expressed as the ratio of the absorbance of T-2 toxin treated cells to that of the control cells.2.6 Apoptosis assay
SMMC-7721 cells were seeded on slides at a density of 5 × 10⁴/mL in 6-well plates. After treatment as mentioned above, cells from all 5 groups were washed twice with PBS, fixed in 4% paraformaldehyde for 10 min, and then stained with Hoechst 33258 for 5 min. Then the cells were observed under a fluorescence microscope. The nuclei of the living cells were a homogeneous blue; those of apoptotic cells were compact, condensed, and whitish-blue.SMMC-7721 cells treated with different concentration of T-2 toxin were harvested by centrifugation at 1000g for 3 min, and washed with ice-cold PBS. The cell suspension (100 μL) was centrifuged at 1000 g for 3 min. After that, the supernatant was discarded and the pellet was gently resuspended in 100 μL cell culture medium and incubated with 100 μL Muse Annexin V & Dead Cell reagents in the dark at room temperature for 20 min. Apoptosis was analyzed using a Muse Cell Analyzer (Merck-Millipore).
2.7 Detection of change in mitochondria membrane potential
Mitochondrial stability was assessed using a mitochondrial membrane potential assay kit with JC-1. SMMC-7721 cells of 1 × 10⁴ cells per well were cultured in 96-well plates for 24 h and then treated with T-2 toxin. After 24 h treatment, the cells were incubated with 62.5 μL JC-1 fluorescent dye for 20 min in the dark at 37 °C. Then, the cells were washed slowly twice with JC-1 dyeing buffer, followed by treating Hoechst (100 μL) for 10 min. The mitochondrial membrane potential was imaged using fluorescence microscopy (Olympus, Tokyo, Japan) at 550 nm excitation and 570 nm emissions for JC-1.2.8 Determination of intracellular ROS production
Intracellular production of reactive oxygen species (ROS) was measured after treatment with T-2 toxin for 6 h. Following treatment, the cells were harvested, washed twice with PBS, and incubated with 10 μmol L−1 2′,7′-dichlorodihydrofluorescein diacetate (DCFH-DA) in the dark for 30 min. Finally, the cells were analyzed for DCF fluorescence by Luciferase labelling apparatus.2.9 Effects of T-2 toxin on MDA content and SOD activity of SMMC-7721
The cells were seeded in 6-well plates at 2 × 10⁵ cells per mL. The cells were exposed to different concentrations of T-2 toxin for 6 h. The cells were then washed with cold PBS and harvested. SOD enzyme activity and MDA content were measured after treatment with T-2 toxin for 6 h by using Biotech SOD-525, MDA-586 assay kits (OXIS International, Portland, OR, U.S.A.).2.10 Detection of caspase-3/7 activation
The caspase-3/7 activation was detected by Muse Cell Analyzer. SMMC-7721 cells treated with different concentration of T-2 toxin were harvested by centrifugation at 1000g for 3 min, and then the cells were resuspended in 50 μL PBS. Add 5 μL of Muse Caspase-3/7 reagent working solution to each group. Mix thoroughly by pipetting up and incubate samples for 30 minutes in the 37 °C incubator with 5% CO2. After incubation, add 150 μL of Muse™ Caspase 7-AAD working solution to each tube, incubate at room temperature for 5 minutes before detecting by Muse Cell Analyzer.2.11 Western blot analysis
After treatment as mentioned above, 5 × 10⁵ cells were harvested and sonicated in RIPS buffer. After centrifugation at 12![[thin space (1/6-em)]](https://www.rsc.org/images/entities/char_2009.gif) 000 × 1g for 10 min at 4 °C, protein content was estimated according to Bio-Rad protein assay and 50 μg protein/lane were loaded on to 12% polyacrylamide SDS gel. The separated proteins were then transferred electrophoretically to nitrocellulose paper and soaked in transfer buffer (25 mmol L−1 Tris, 192 mmol L−1 glycine) and 20% methanol v/v. Non-specific binding was blocked by incubation of the blots in 5% no-fat dry milk in TBS/0.1% Tween (25 mmol L−1 Tris, 150 mmol L−1 NaCl, 0.1% Tween v/v) for 60 min. After washing, the blots were incubated overnight at 4 °C with the primary antibody. After incubation with the primary antibodies and washing in TBS/0.1% Tween, the appropriate secondary antibody was added and left for 1 h at room temperature. Immunoreactive protein bands were detected by chemiluminescence using enhanced chemiluminescence reagents (ECL). Blots were also stained with anti β-actin antibody as internal control for the amounts of target proteins. The films were then subjected to densitometry analysis using a Gel Doc 2000 system (Bio-Rad).
000 × 1g for 10 min at 4 °C, protein content was estimated according to Bio-Rad protein assay and 50 μg protein/lane were loaded on to 12% polyacrylamide SDS gel. The separated proteins were then transferred electrophoretically to nitrocellulose paper and soaked in transfer buffer (25 mmol L−1 Tris, 192 mmol L−1 glycine) and 20% methanol v/v. Non-specific binding was blocked by incubation of the blots in 5% no-fat dry milk in TBS/0.1% Tween (25 mmol L−1 Tris, 150 mmol L−1 NaCl, 0.1% Tween v/v) for 60 min. After washing, the blots were incubated overnight at 4 °C with the primary antibody. After incubation with the primary antibodies and washing in TBS/0.1% Tween, the appropriate secondary antibody was added and left for 1 h at room temperature. Immunoreactive protein bands were detected by chemiluminescence using enhanced chemiluminescence reagents (ECL). Blots were also stained with anti β-actin antibody as internal control for the amounts of target proteins. The films were then subjected to densitometry analysis using a Gel Doc 2000 system (Bio-Rad).
2.12 Statistical analysis
Results are expressed as mean ± SEM. All data were analyzed by one-way ANOVA by using SPSS version 13 software and expressed in mean ± standard deviation. p < 0.05 was considered significant.3. Results
3.1 Identification of T-2 toxin producing Fusarium
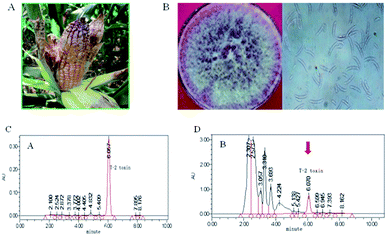
Moldy corn was harvested from Jilin, Northeast China and the moldy show pale pink fungus morphology (Fig. 1A). 17 Fusarium from moldy corn were identified by PDA properties. Shape, surface slightly powdery, beginning to white, quickly become to red. A microscopic or sickle shaped crescent of Fusarium oxysporum (Fig. 1B).The results of seed germination inhibition test showed that 10 of the crude extracts of all tested strains could inhibit the growth of pea embryo, and the other 7 could not inhibit the growth of pea embryo (Table 1). Among the 10 strains, strain JL01 showed the strongest inhibition. Therefore, the following studies were carried out with JL01 as the experimental strain.
| Strains | Embryonic bud inhibition rate (%) |
|---|---|
| JL01 | 95.84 ± 1.86 |
| JL02 | 46.13 ± 2.03 |
| JL03 | 17.06 ± 1.85 |
| JL04 | 23.15 ± 2.15 |
| JL05 | 12.45 ± 1.50 |
| JL06 | 10 ± 2.12 |
| JL07 | 13.25 ± 1.64 |
| JL08 | 24.15 ± 2.37 |
| JL09 | 35.26 ± 2.53 |
| JL10 | 53.49 ± 2.89 |
| JL11 | 36.18 ± 1.56 |
| JL12 | 5.13 ± 2.61 |
| JL13 | 62.06 ± 1.78 |
| JL14 | 33.86 ± 1.25 |
| JL15 | 27.16 ± 2.68 |
| JL16 | 19.55 ± 2.25 |
| JL17 | 19.24 ± 2.76 |
To further confirm that strain JL01 produces T-2 toxin, HPLC was applied to detect its T-2 toxin production. Under the HPLC conditions, the peak time of standard T-2 toxin is 6.057 min (Fig. 1C). A peak was released at 6.057 min in the crude extract from strain JL01 (Fig. 1D). Among the 10 strains, JL01 strain shows the strongest capacity to produce T-2 toxin by HLPC.
3.2 Purification and characterization of T-2 toxin
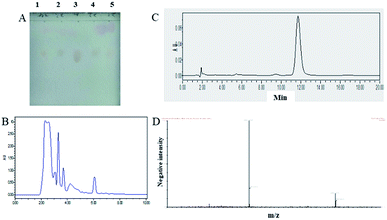
Silica gel column chromatography, eluting with a petroleum ether-ethyl acetate gradient, was employed for first-step separation. Based on TLC analysis of each fraction (Fig. 2A), the fractions were obtained by pooling fractions containing compounds of T-2 toxin, which were subjected to further HPLC separation.Before pooling fractions containing compounds of T-2 toxin were loaded to HPLC, HPLC system including the flow rate and the sample loading amount was performed for optimization. Flow rate was set at 10 min min−1 and 60% methanol in ultra-pure water was used as the mobile phase (Fig. 2B). Then purification was performed. The fraction collected from preparative HPLC was dried at 40 °C with a rotatory evaporator under vacuum. The analytical HPLC analysis of the purified compound showed a single peak (Fig. 2C) that constituted 98% of the total detectable peak area.
To further characterize the purified compound, this material was identified by ESI-MS, and 1H NMR. The data are listed below and have been compared with literature values. Their structures are illustrated in Fig. 2D and S1.† The positive ESI/MS spectrum: [M + H]+ ion at m/z 467.2 and [M + Na]+ ion at m/z 489.2. The 1H NMR spectrum (600 MHz, D2O): σ (CDCl3, 600 MHz) 5.84–5.83 (1H, H-10), 5.31 (2H, H-4, H-8), 4.37–4.36 (1H, H-11), 4.33–4.30 (1H, H-15b), 4.19–4.17 (1H, H-3), 4.09–4.07 (1H, H-15a), 3.73 (1H, H-2), 3.23–3.22 (1H, 3-OH), 3.09 (1H, H-13b), 2.83 (1H, H-13a), 2.44–2.41 (1H, H-7a), 2.18–2.11 (6H, H-2′, H-18, H-3′), 06 (3H, H-17), 1.93 (1H, H-7b), 1.77 (3H, H-16), 0.99–0.97 (6H, H4′, H5′), 0.84 (3H, H-14).
3.3 Cytotoxicity of T-2 toxin on human hepatoma cells
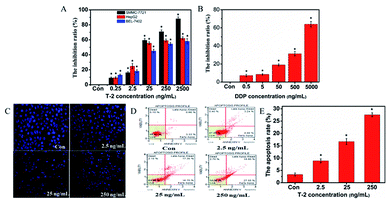
To evaluate the cytotoxic effects of T-2 toxin on SMMC-7721 HepG2 and Bel-7401 cells, the MTT assay was conducted. SMMC-7721 cells were treated with T-2 toxin at the concentration of 0.025, 0.25, 2.5, 25, 250 and 2500 ng mL−1 for 24 h. Cisplatin (DDP) were selected as the positive control. The cytotoxic and growth-inhibitory effects were examined. As shown in Fig. 3, the T-2 toxin caused dramatic cell growth inhibition in SMMC-7721 HepG2 and Bel-7401 cells in a dose-dependent manner (Fig. 3A). But, T-2 toxin exhibited a better proliferation inhibition on SMMC-7721 cells. Then, SMMC-7721 cells are recommended for further experiments to investigate the cytotoxic mechanisms of T-2 toxin.3.4 Morphological changes in T-2 toxin-induced apoptosis of SMMC-7721 cells
Hoechst 33258, a DNA-sensitive fluorochrome, was used to assess changes in the nuclear morphology following treatment with different concentration of T-2 toxin. The nuclei in normal cells exhibited diffused staining of the chromatin. However, after T-2 toxin treatment, the cells underwent typical morphological changes (chromatin condensation, margination, and shrunken nucleus) indicative of apoptosis (Fig. 3B).3.5 Effect of T-2 toxin on apoptosis of SMMC-7721 cells
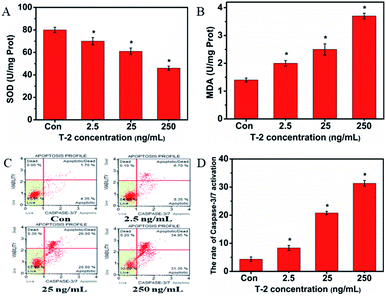
To determine the role of T-2 in cellular apoptosis induction, we stained the cells with Muse Annexin V & Dead Cell reagents. Muse cell analyzer was used to quantify fluorescent cells. The number of early apoptotic cells increased with increasing T-2 concentration. The details are shown in Fig. 3. The percentages of apoptosis are 3.33%, 8.88%, 16.70% and 27.55% with the concentration of T-2 toxin (0, 2.5, 25, 250 ng mL−1), respectively (Fig. 3C). In general, the rate of apoptotic SMMC-7721 cells significantly increased in a dose-dependent manner.3.6 T-2 toxin induces MMP change in SMMC-7721 cells
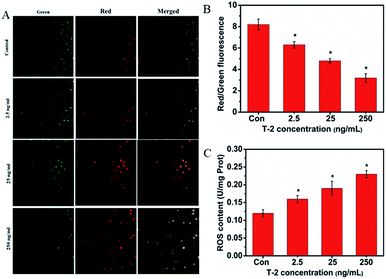
The depolarization of MMP reflects mitochondrial dysfunction which is an early marker of mitochondrial-mediated cell apoptosis. In the present study, we evaluated the changes in MMP by a fluorescence microscope. As shown in Fig. 4A and B, the green light was most obvious in the normal group and it was decreased 24 h after cells were treated with T-2. In contrast, while T-2 toxin treatment resulted in the generation of red light. The ratio of red/green fluorescence is decreased. It showed that the mitochondrial membrane potential was declined.3.7 T-2 toxin triggers ROS generation in SMMC-7721 cells
The accumulation of intracellular ROS is as an important factor in stress induced cell death. Treatment with T-2 toxin generated ROS in a dose-dependent manner as detected by Luciferase labeling apparatus (Fig. 4C).3.8 Effects of T-2 on oxidative stress
We measured the total activity of SOD and MDA in SMMC-7721 cells. MDA is regarded as a major marker of lipid peroxidation in tissue, whereas SOD was an important enzyme in the antioxidant defense system. After treating the cells with T-2 for 6 h, the SOD levels decreased and the MDA content was increased (Fig. 5A and B).3.9 Caspase-3/7 activation detected result
To determine the effect of T-2 toxin on caspase-3/7 activation, Muse caspase-3/7 kit was selected. Muse cell analyzer was used to quantify stained cells. The details are shown in Fig. 5. The percentages of cells in the early stages of apoptosis are 4.35%, 8.35%, 20.80% and 31.35% with the concentration of T-2 toxin (0, 2.5, 25, 250 ng mL−1), respectively (Fig. 5C).3.10 T-2 toxin induced apoptosis by mitochondrial pathway
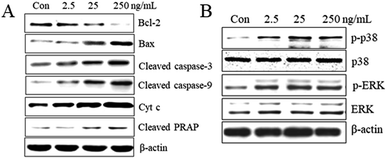
The Bax and Bcl-2 genes are important apoptosis-associated upstream regulators in intrinsic (mitochondrial) apoptotic pathway. The Bax and Bcl-2 expression levels modify mitochondrial integrity, release cytochrome c and activate caspases. The imbalance in the Bax/Bcl-2 ratio as well as their individual expression level is of great importance. Our studies showed that T-2 toxin treatment resulted in upregulation of bax and downregulation of bcl-2 and subsequently increase in Bax/Bcl-2 ratio and it was consistent with the increase in apoptosis after T-2 treatment. To evaluate whether T-2 toxin induced SMMC-7721 cells via the intrinsic mitochondrial pathway, we examined the expression of cleaved caspase-3, cleaved caspase-9, cleaved PARP and cytochrome c release from mitochondria (Fig. 6A). The results showed that increase in levels of cleaved caspase-3, cleaved caspase-9, cleaved PARP and cytochrome c with increasing concentrations of T-2 toxin.3.11 Effects of T-2 toxin on mitogen-activated protein kinase (MAPK) activation
MAPKs play key roles in cell proliferation, differentiation, survival and apoptosis. Our study revealed that T-2 toxin treatment can enhanced the activations of ERK and P38 in SMMC-7721 cells (Fig. 6B). The dates suggest that the activations of MAPKs might contribute to the T-2 toxin anti-tumor effect.4. Discussion
T-2 toxin, produced by various Fusarium fungi e.g., F. sporotrichiodes, F. poae, F. equiseti, and F. acumimatum, is one of the most toxic mycotoxins belonging to the type A trichothecenes.12 T-2 toxin also has the ability to induce apoptosis in cells and the molecular target of T-2 toxin is the 60 S ribosomal subunit. The studies have reported that oxidative stress is also an important underlying mechanism in the toxicity of T-2 toxin. T-2 toxin significantly increases the levels of ROS and depletes intracellular reduced glutathione GSH.13–15 That leads to single-strand breaks in DNA and the cells apoptosis is triggered. T-2 toxin causes a large range of toxic effects in animals, such as weight loss, decreases in blood cell and leukocyte count, reduction in plasma glucose, and pathological changes in the liver and stomach.16–18 Over the years, there have been many reports from different regions of the world describing the association of T-2 with damage to agriculture and its toxic effects in animals. However, as a representative of toxic trichothecene mycotoxins, T-2 toxin is considered one of the most commonly emerged in many crops.5,19 The inducing apoptosis effect of T-2 toxin on tumor has been ignored. In the study, we investigated Fusarium poae was isolated from moldy corn from Jilin, Northeast China, the conditions of producing toxin and the molecular mechanisms involved in T-2 toxin induced oxidative stress, DNA damage and apoptosis in human hepatoma cell line SMMC-7721.Fusarium poae is widely distributed in various food crops (such as wheat, rice, maize, barley and oats, etc.).20–22 In the study, moldy corn was harvested from Jilin, Northeast China to isolate Fusarium poae. 17 strains Fusarium from moldy corn was identified by PDA properties. The Fusarium strains (17 strains) which were preliminarily identified according to their morphological characteristics were amplified on PDA plate and then the strain JL01 had the strongest ability to produce toxin which can inhibit the growth of pea embryo. HPLC analysis result show that under the experimental conditions, the peak time of T-2 toxin standard is 6.057 min and a peak was released at 6.057 min in the crude extract. The two peaks were very close to each other. The selected strain JL01 can produce T-2 toxin and was used for the following experiment. To isolation T-2 toxin, the harvested culture was dissolved in 80% ethanol, concentrated by rotary evaporators and extracted by n-hexane. The extraction was purified by silica gel chromatography firstly and HPLC. After optimizing the HPLC conditions, we fixed the flow rate at 10 mL min−1, the most efficient purification of the T-2 toxin was obtained by using 60% methanol in ultra-pure water as the mobile phase. The purified T-2 toxin compound was assessed by analytical HPLC and characterised by ESI/MS and 1H NMR. The results of positive ESI/MS and 1H NMR analysis of the purified compound obtained by preparative HPLC were consistent with those previously reported, and the purified compound was characterised as T-2 toxin. Those results reveal we have successfully isolated a endophytic Fusarium oxysporum producing T-2 toxin from corn and studied its production conditions. The results provide a basis for further study on the mechanism of Fusarium production.
Apoptosis is a very tightly programmed cell death with distinct biochemical and genetic pathways that play a critical role in the development and homeostasis in normal tissues. Evidence indicates that insufficient apoptosis can manifest as cancer or autoimmunity, while accelerated cell death is evident in acute and chronic degenerative diseases, immunodeficiency, and infertility.23,24 Therefore, using apoptosis as an intervention to treat tumors has become a new target in the search for antitumor drugs, and a new direction for development in tumor pharmacology.25 T-2 toxin belongs to a group of mycotoxins that can inhibit the DNA, RNA and protein syntheses in several cellular systems. The previous results show that T-2 toxin can inhibit the proliferation of tumor cells and induced apoptosis. However, the cellular and molecular mechanisms underlying T-2 toxin-induced apoptosis in tumor cell have not been well defined.26,27 Therefore, in this study, we focused on characterizing the T-2 toxin-induced apoptotic signaling pathways in human hepatoma cell line SMMC-7721. In this study, we found that the proliferation of SMMC-7721 cells was inhibited obviously after treatment with different concentration of T-2 toxin for 24 h. After T-2 toxin treatment, the SMMC-7721 cells underwent typical morphological changes (chromatin condensation, margination, and shrunken nucleus) and the rate of apoptosis increased in a dose-dependent manner. This finding indicates that T-2 can induce apoptosis in SMMC-7721 cells.
In previous research, T-2 toxin could up-regulate intracellular ROS. ROS promotes production of end product of lipid peroxidation, such as MDA. MDA can damage tissues and cells.28,29 At the same time, the level of MDA reflects the extent of ROS. SOD can specifically bind to superoxide anions in vivo and can act synergistically with GSH-Px to prevent lipid peroxidation and its metabolites from damaging the body.30,31 It can also directly capture and remove free radicals, such as the superoxide anion. In our study, we found that treatment with T-2 toxin generated ROS in a dose-dependent manner, the SOD levels decreased and the MDA content was increased. That showed intrinsic link between T-2 toxin induced apoptosis and oxidative stress. But the mechanism still need for further studied. It is well known that apoptosis occurs via two primary pathways: the extrinsic pathway and the intrinsic pathway. The intrinsic pathway is dependent on mitochondria. The mitochondria dependent apoptotic pathway is regulated by the Bcl-2 family of proteins which including Bax and Bcl-2. Bcl-2 inhibits apoptosis by negatively regulating the apoptotic activity of Bax and forming Bcl-2/Bax heterodimers.32 An increase in the Bax/Bcl-2 ratio has been demonstrated to promote apoptosis by directly activating the mitochondrial apoptotic pathway. As in our present study, after T-2 treatment the expression levels of Bcl-2 decreased and the expression of Bax increased. That resulting an elevation in the ration of Bax/Bcl-2. Cyto C is an important mitochondrial protein that induces apoptosis when accumulated in the cytosol in response to diverse stress stimuli. Cyto C binds caspase-9 to form a complex that activates other caspase family members, including caspase-3, to induce apoptosis.33 Our study found that T-2 treatment can increase caspase-9 and caspase-3 activity in SMMC-7721 cells. This is consistent with the release of Cyto C into the cytosol from mitochondria, potentially caspase activating. Following caspase activation, an increasing number of cellular substrates protein PARP were or cleaved, resulting in cell death. As those results demonstrated in the present study suggesting that T-2 toxin can promote the apoptosis of SMMC-7721 via the mitochondrial-dependent apoptotic pathway.
MAPK are important regulators of diverse cellular processes and stress responses. As an important player they show crosstalk at several points in signaling pathways in response to abiotic and biotic stresses that include ROS signaling.34 ERK1/2 primarily functions in cell proliferation in comparison with its role in apoptosis, while activation of JNK and p38 MAPKs is generally associated with promotion of apoptosis.35 Our results showed that T-2 significantly increased the levels of phosphorylated ERK and p38 MARK in a dose-dependent manner without affecting the expression of total proteins, indicating that these MAPK pathways were activated in the process of T-2 toxin-induced apoptosis in SMMC-7721 cells. These results demonstrated that activation of ERK and p38 pathways were involved in T-2 Toxin induced apoptosis in SMMC-7721 cells.
5. Conclusions
In summary, we demonstrated T-2 toxin induces apoptosis in SMMC-7721 cells through ROS-mediated mitochondrial dysfunction and MAPK pathways. This study provides an insight into the molecular mechanisms of T-2 toxin induced apoptosis in liver cancer cells and presents that T-2 toxin may be a novel promising agent for liver cancer treatment.Conflicts of interest
The authors declare that there is no conflict of interest associated with this study.Acknowledgements
This work was supported by the National Science And Technology major projects (No. 2012ZX09103-301-003), Science & Technology Development of Jilin Province (No. 20170414022GH), National Natural Science Foundation of China (No. 11604120), and Department of Education of Jilin Province (JJKH20180822KJ).References
- L. Dellafiora, G. Galaverna and C. Dall'Asta, Toxicol. Lett., 2017, 270, 80–87 CrossRef CAS.
- V. M. Lattanzio, B. Ciasca, M. Haidukowski, A. Infantino, A. Visconti and M. Pascale, J. Mass Spectrom., 2013, 48, 1291–1298 CrossRef CAS PubMed.
- M. A. Mondol, M. Z. Surovy, M. T. Islam, A. Schuffler and H. Laatsch, J. Agric. Food Chem., 2015, 63, 8777–8786 CrossRef CAS PubMed.
- M. Busman, S. M. Poling and C. M. Maragos, Toxins, 2011, 3, 1554–1568 CrossRef CAS PubMed.
- K. Bernhardt, H. Valenta, S. Kersten, H. U. Humpf and S. Danicke, Mycotoxin Res., 2016, 32, 89–97 CrossRef CAS PubMed.
- M. Manafi, N. Pirany, M. Noor Ali, M. Hedayati, S. Khalaji and M. Yari, Poult. Sci., 2015, 94, 1483–1492 CrossRef CAS PubMed.
- S. M. Albarenque and K. Doi, Exp. Mol. Pathol., 2005, 78, 144–149 CrossRef CAS PubMed.
- Y. Iwahashi, E. Kitagawa and H. Iwahashi, Int. J. Mol. Sci., 2008, 9, 2585–2600 CrossRef CAS PubMed.
- P. Huang, K. Akagawa, Y. Yokoyama, K. Nohara, K. Kano and K. Morimoto, Toxicol. Lett., 2007, 170, 1–10 CrossRef CAS PubMed.
- Z. Zhuang, D. Yang, Y. Huang and S. Wang, PLoS One, 2013, 8, e83105 CrossRef PubMed.
- B. Cheng, Y. Zhang, B. Tong and H. Yin, Biol. Trace Elem. Res., 2017, 178, 147–152 CrossRef CAS.
- T. Mosmann, J. Immunol. Methods, 1983, 65, 55–63 CrossRef CAS.
- Y. Ueno, M. Sawano and K. Ishii, Appl. Microbiol., 1975, 30, 4–9 CAS.
- H. Fang, L. Cong, Y. Zhi, H. Xu, X. Jia and S. Peng, Toxicol. Lett., 2016, 258, 259–266 CrossRef CAS PubMed.
- J. Xu, C. Jiang, W. Zhu, B. Wang, J. Yan, Z. Min, M. Geng, Y. Han, Q. Ning, F. Zhang, J. Sun, L. Meng and S. Lu, Osteoarthr. Cartil., 2015, 23, 1575–1585 CrossRef CAS PubMed.
- V. Dohnal, A. Jezkova, D. Jun and K. Kuca, Curr. Drug Metab., 2008, 9, 77–82 CrossRef CAS PubMed.
- M. Sokolovic, V. Garaj-Vrhovac and B. Simpraga, Arh. Hig. Rada Toksikol., 2008, 59, 43–52 CAS.
- Q. H. Wu, X. Wang, W. Yang, A. K. Nussler, L. Y. Xiong, K. Kuca, V. Dohnal, X. J. Zhang and Z. H. Yuan, Arch. Toxicol., 2014, 88, 1309–1326 CrossRef CAS PubMed.
- S. P. McCormick, T. Kato, C. M. Maragos, M. Busman, V. M. Lattanzio, G. Galaverna, C. Dall-Asta, D. Crich, N. P. Price and C. P. Kurtzman, J. Agric. Food Chem., 2015, 63, 731–738 CrossRef CAS PubMed.
- B. Cheng, Y. Zhang, B. Tong and H. Yin, Biol. Trace Elem. Res., 2017, 178(1), 147–152 CrossRef CAS.
- I. N. Kurchenko and E. S. Tsyganenko, Mikrobiolohichnyi Zhurnal, 2013, 75, 29–32 CAS.
- M. Schollenberger, H. M. Muller, M. Liebscher, C. Schlecker, M. Berger and W. Hermann, Toxins, 2011, 3, 442–452 CrossRef CAS PubMed.
- H. Forde, E. Harper, C. Davenport, K. D. Rochfort, R. Wallace, R. P. Murphy, D. Smith and P. M. Cummins, Atherosclerosis, 2016, 247, 87–96 CrossRef CAS PubMed.
- I. Horwacik and H. Rokita, Apoptosis, 2015, 20, 679–688 CrossRef CAS PubMed.
- W. Zhu, W. Zhang, H. Wang, J. Xu, Y. Li and S. Lv, Can. J. Physiol. Pharmacol., 2014, 92, 324–329 CrossRef CAS PubMed.
- H. Abassi, I. Ayed-Boussema, S. Shirley, S. Abid and H. Bacha, J. Biochem. Mol. Toxicol., 2016, 30, 128–135 CrossRef CAS PubMed.
- M. Agrawal, A. S. Bhaskar and P. V. Lakshmana Rao, Mol. Neurobiol., 2015, 51, 1379–1394 CrossRef CAS PubMed.
- S. Dutta and A. Khanna, Biomed. Pharmacother., 2016, 84, 1513–1523 CrossRef CAS.
- D. Liu, H. Shang and Y. Liu, Int. J. Mol. Sci., 2016, 17(7), 1051 CrossRef PubMed.
- J. Yao, X. Cao, R. Zhang, Y. X. Li, Z. L. Xu, D. G. Zhang, L. S. Wang and J. Y. Wang, Pharmacogn. Mag., 2016, 12, 225–234 CrossRef CAS PubMed.
- Y. Yin, X. Wang, L. Yang, Y. Sun and H. Guo, Ecotoxicology, 2010, 19, 1102–1110 CrossRef CAS PubMed.
- Q. Wang, L. Zhang, X. Yuan, Y. Ou, X. Zhu, Z. Cheng, P. Zhang, X. Wu, Y. Meng and L. Zhang, PLoS One, 2016, 11, e0163327 CrossRef PubMed.
- X. Yan, Z. Jiang, L. Bi, Y. Yang and W. Chen, Naunyn-Schmiedeberg's Arch. Pharmacol., 2015, 388, 817–830 CrossRef CAS PubMed.
- C. Niaudet, S. Bonnaud, M. Guillonneau, S. Gouard, M. H. Gaugler, S. Dutoit, N. Ripoche, N. Dubois, V. Trichet, I. Corre and F. Paris, Cell. Signalling, 2017, 33, 10–21 CrossRef CAS PubMed.
- K. L. Jian, C. Zhang, Z. C. Shang, L. Yang and L. Y. Kong, Phytomedicine, 2017, 25, 71–82 CrossRef CAS PubMed.
Footnotes |
| † Electronic supplementary information (ESI) available. See DOI: 10.1039/c8ra09967g |
| ‡ Equal contribution. |
| This journal is © The Royal Society of Chemistry 2019 |

