
 Open Access Article
 This Open Access Article is licensed under a Creative Commons Attribution-Non Commercial 3.0 Unported Licence
A colorimetric and ratiometric fluorescent sensor for sequentially detecting Cu2+ and arginine based on a coumarin–rhodamine B derivative and its application for bioimaging†
Shuai Wanga,
Haichang Dingb,
Yuesong Wanga,
Congbin Fan a,
Gang Liu*a and
Shouzhi Pu*a
a,
Gang Liu*a and
Shouzhi Pu*a
aJiangxi Key Laboratory of Organic Chemistry, Jiangxi Science and Technology Normal University, Nanchang, Jiangxi 330013, PR China. E-mail: liugang0926@163.com; pushouzhi@tsinghua.org.cn; Fax: +86-791-83831996; Tel: +86-791-83831996
bInstitute for Advanced Ceramics, State Key Laboratory of Urban Water Resource and Environment, Harbin Institute of Technology, Harbin 150001, PR China
First published on 26th February 2019
Abstract
In this work, a colorimetric and ratiometric fluorescent sensor based on a coumarin–rhodamine B hybrid for the sequential recognition of Cu2+ and arginine (Arg) via the FRET mechanism was designed and synthesized. With the addition of Cu2+, the solution displayed a colorimetric change from pale yellow to pink which is discernible by the naked eye. Additionally, the fluorescence intensities of the sensor exhibited ratiometric changes for the detection of Cu2+ at 490 and 615 nm under a single excitation wavelength of 350 nm, which corresponded to the emissions of coumarin and rhodamine B moieties, respectively. The fluorescence color change could be visualized from blue to pink. The limits of detection were determined to be as low as 0.50 and 0.47 μM for UV-vis and fluorescence measurements, respectively. More importantly, the sensor not only can recognize Cu2+ and form a sensor-Cu2+ complex but can also sequentially detect Arg with the resulting complex. The detection limits for Arg were as low as 0.60 μM (UV-vis measurement) and 0.33 μM (fluorescence measurement), respectively. A fluorescence imaging experiment in living cells demonstrated that the fabricated sensor could be utilized in ratiometric fluorescence imaging towards intracellular Cu2+, which is promising for the detection of low-level Cu2+ and Arg with potentially practical significance.
Introduction
With the development of industrialization, heavy metal pollution is becoming increasingly severe, and it is receiving more and more attention because of its potential threat to human health and the ecological environment. Among various heavy metal ions, the Cu2+ ion plays an essential role in environmental, chemical, and biological systems.1–3 However, an excess amount of Cu2+ in the body causes gastrointestinal disturbance and harms the liver and kidneys.4–8 Therefore, the development of highly sensitive and selective methods for the detection of Cu2+ in biological and environmental samples is of great importance. Currently, fluorescence spectroscopy is regarded as a powerful tool for the detection and imaging of micro-samples.9–11 So far, some fluorescent sensors for the sensitive determination of Cu2+ have been developed.12–14 However, most of them are based on “turn-off” changes in fluorescence intensity because Cu2+ is usually used as a fluorescent quencher via an energy or electron-transfer mechanism.15–18 Therefore, the sensitive “turn-on” fluorescent sensors to monitor and visualize Cu2+ are highly demanded.Amino acids are the essential components that make up the biological macromolecular proteins, which have been intensively investigated.19–21 Among all natural amino acids, arginine (Arg) not only acts as the precursor to nitric oxide (NO), urea, ornithine, but also plays a vital role in myriad biological functions, such as cell replication, wound healing, and protein synthesis.22–24 If the level of Arg in a human body is abnormal, it can cause unhealthy or even life-threatening problems for the person.25 Therefore, it is significant to develop viable methods for Arg detection. Currently, several major methods have been used for the determination of Arg, such as high-performance liquid chromatography (HPLC) and gas chromatography (GC).26,27 However, these methods usually involve specially designed and costly equipment, complicated sample preparation, and long measurement time. The fluorescent sensors compared with the above methods exhibited high selectivity, good sensitivity, and fast real-time detection, which have attracted extensive attention.28,29 Currently, only a few sensors are available for the detection of Arg due to weak interactions between receptors and Arg in aqueous media.30–33 The development of new fluorescent sensors that are sensitive and selective for the recognition of Arg remains a challenge.
Among various fluorophores, a large number of rhodamine-based fluorescence sensors have been reported for the detection of analytes due to rhodamine has various excellent optical properties.34–37 Recently, Pu et al. disclosed a fluorescent sensor based on diarylethene–rhodamine under a single emission wavelength, which showed good selectivity and sensitivity toward recognition of Cu2+ and Arg.38 In another excellent work, Xin et al. prepared a fluorescent sensor for fast visual detection of Al3+ and Arg based on fluorescence intensity change of rhodamine–thiourea in single emission wavelength.39 However, these single-signal sensor based on both fluorescence quenching and enhancement after the recognition of Cu2+/Al3+ and Arg at a single emission wavelength, which tends to be influenced by various of factors, such as instrumental efficiency, the concentration of sensor molecules, photobleaching, and microenvironment.40,41 In contrast, ratiometric sensors utilize the ratio of the intensity at two different wavelengths, which can effectively eliminate the above limitations by means of self-calibration and exclude the fluctuation of light excitation intensity.42–44 In addition, the large emission shift is more conducive to reduce the interference of crosstalk signals and improve the detection accuracy compared to most of the ratiometric fluorescent sensors that exhibit only ordinary emission shifts (<80 nm).45,46
In this work, as shown in Scheme 1, we adopted the strategy that utilizes the coumarin chromophore as the energy donor and the rhodamine moiety as the energy acceptor, which is expected to construct a ratiometric fluorescence sensor successfully for detecting of analytes based on the FRET mechanism. As a consequence, we successfully synthesized a new colorimetric and ratiometric fluorescent sensor containing both coumarin and rhodamine B units for the visual detection of Cu2+ and Arg via the FRET mechanism. During the detecting process for Cu2+ and Arg, the fluorescent sensor not only achieved the ratiometric fluorescence change with a significant emission shift (125 nm) but also provided a vivid sight to “naked eyes”. Moreover, the sensor was successfully used to monitor Cu2+ in living cells, and favorable ratiometric fluorescence signals were achieved, which has great potential application biosensing, disease diagnosis, and environmental monitoring.
 | ||
| Scheme 1 Structure and synthesis of 1. | ||
Results and discussion
Absorption and fluorescence spectral responses of sensor 1 to metal ions
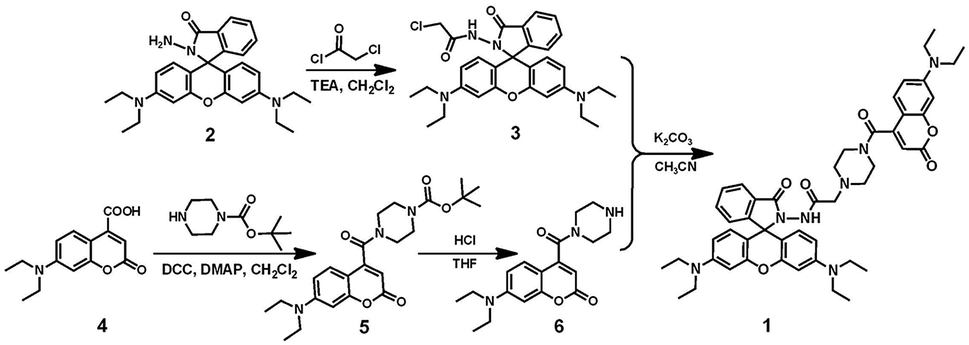
A series of metal ions (Fe3+, Al3+, Ca2+, Cd2+, Co2+, Cu2+, Ba2+, Cr3+, Hg2+, K+, Sr2+, Mg2+, Mn2+, Ni+, Pb2+, and Zn2+) were used to evaluate the UV-vis absorption and fluorescence selectivity of 1 (2.0 × 10⁻⁵ mol L−1) in CH3CN–H2O (9/1, v/v) solution. Initially, in the absence of any metal ions, the color of solution 1 was light yellow, and the absorption spectrum did not show any absorption band in the visible light range. As expected, these metal ions were separately added to the solution of 1, only Cu2+ caused a significant absorption change with an obvious absorption peak at 564 nm and a distinct color change from light yellow to pink, which corresponded to the characteristic absorption peak of the open ring form of the rhodamine B moiety (Fig. 1A and C). Other metal ions did not induce significant absorption change of 1. Similarly, only Cu2+ induced a significant ratiometric change in the fluorescence spectra upon excitation at 350 nm. Upon the addition of Cu2+, the fluorescence intensity significantly decreased at 490 nm, and a new emission peak at 615 nm emerged along with the change of fluorescence color from blue to pink. Although other competing metal ions such as Fe3+, Al3+, and Cr3+ caused a slight deduction of fluorescent intensity at 490 nm, they did not cause any significant fluorescence change at 615 nm (Fig. 1B and D). These results suggested that the sensor 1 is more selective to Cu2+ than other competitive metal ions under the same conditions.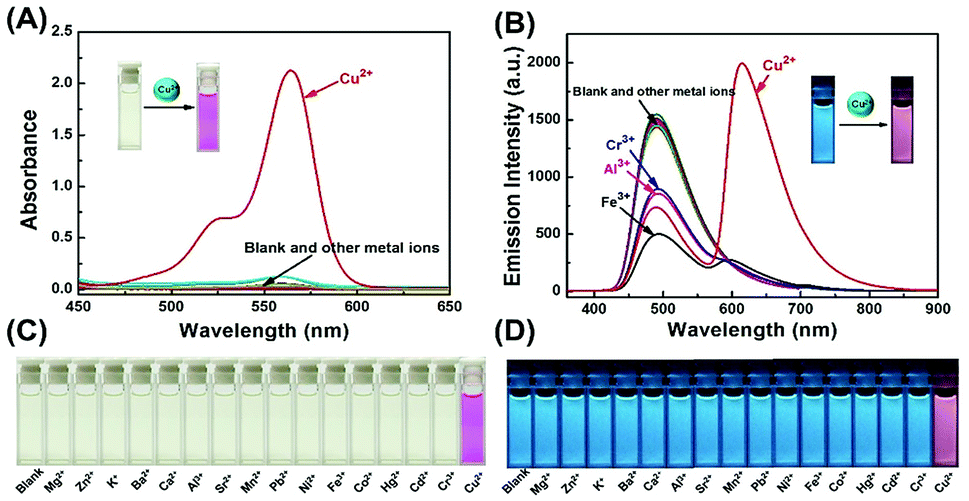 | ||
| Fig. 1 Spectroscopic changes of 1 (2.0 × 10⁻⁵ mol L−1) induced by the addition of various metal ions (3.0 eq.) in CH3CN–H2O (9/1, v/v) solutions. (A) Absorption spectral changes. (B) Fluorescence emission intensity changes. (C) The color image set upon the addition of various metal ions. (D) The fluorescence image set upon the addition of various metal ions. | ||
Subsequently, the competition experiments of absorption and fluorescence were carried out for sensor 1 (Fig. S1A†). Upon addition of Cu2+ (3.0 eq.) into the solution of 1 containing other metal ions (10.0 eq.), a similar change in absorption spectra was observed as that with Cu2+ ion only, implying that the binding affinity of Cu2+ with sensor 1 is higher than those of other metal ions. In addition, the ratios of fluorescence intensity (I615/I490) of the sensor 1 were examined under the same conditions with a series of metal ions. As shown in Fig. S1B,† most of the competitive ions did not induce significant fluorescence ratiometric changes, only Fe3+, Al3+, and Cr3+ exhibited a slight interference. The competition experiments demonstrated that the sensor 1 could specifically recognize Cu2+ with high anti-interference capability despite the presence of other competitive metal ions.
Optical responses of sensor 1 to Cu2+
To gain a deeper understanding of the chemical sensing properties of 1 for Cu2+, we further conducted absorption and fluorescence titration experiments. As shown in Fig. 2A, with the increase of Cu2+, the absorption peak gradually enhanced at 564 nm, which could be caused by the ring-opened form of the rhodamine B moiety. Fig. 2B showed the absorption titration curve increased steadily with increasing concentration of Cu2+, and the change of absorbance reached a plateau when 3.0 eq. of Cu2+ was further titrated, accompanied by the color change of the solution from light yellow to pink. As shown in Fig. S2,† the absorbance of sensor 1 exhibited a linear relationship with the concentration of Cu2+ in the range of 0–40 μM, and the linear equation was determined to be Y = 0.04292X − 0.00994 (R = 0.9962). The limit of detection (LOD, UV-vis measurement) of 1 to Cu2+ was calculated to be 0.50 μM based on 3σ/k (Fig. S3†), wherein, σ represents the standard deviation of the blank signal, and k represents the slope of the linear calibration curve.47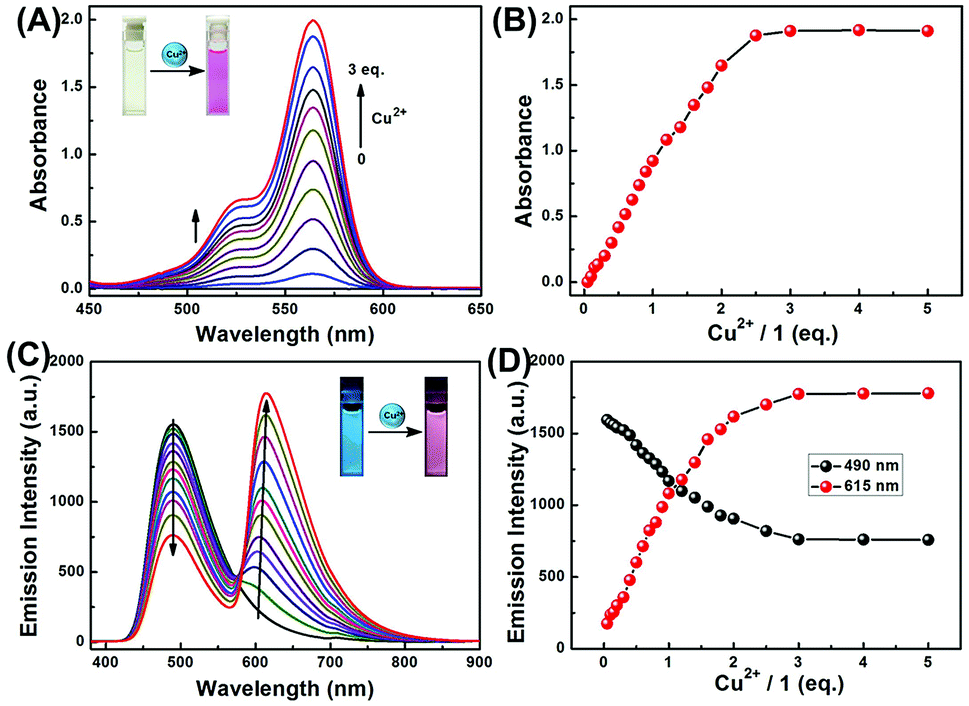 | ||
| Fig. 2 (A) Changes in absorption spectra of 1 in CH3CN–H2O (9/1, v/v) solutions upon addition of Cu2+. (B) Absorption titration profile (at 564 nm) versus concentration of Cu2+ for 1. (C) Fluorescence spectra of 1 upon titration with Cu2+ (0–5.0 eq.) in CH3CN–H2O (9/1, v/v). Inset: the color change in fluorescence of 1. (D) Fluorescence intensity of sensor 1 at 615 nm (red dot) and 490 nm (black dot) as a function of the Cu2+ concentration (0–5.0 eq.). λex = 350 nm, slit: 5 nm/5 nm. | ||
The fluorescence spectra of sensor 1 in CH3CN–H2O (9/1, v/v) solution contained different concentrations of Cu2+. In the absence of Cu2+, the spectrum of 1 exhibited a blue fluorescence emission at 490 nm which is a characteristic of the coumarin moiety. As shown in the Fig. 2C, with continuous addition of Cu2+, the fluorescence intensity at 490 nm decreased gradually, whereas a new emission peak at 615 nm appeared and increased gradually, indicating that the rhodamine moiety had changed from a spirocyclic form to a ring-opened form. Further addition of Cu2+ beyond a certain concentration (3.0 eq.) did not cause changes in fluorescence intensity (Fig. 2D). In addition, the distance between the two emission peaks exhibited a significant wavelength shift (125 nm), indicating that this system can effectively circumvent the issue of emission spectral overlap which is common with ratiometric sensors, allowing for accurate measurement of intensities of two emission peaks. Moreover, the ratiometric change of fluorescence intensity (I615/I490) was linearly correlated with the concentration of Cu2+ within the range from 0 to 60 μM and the good linear relationship was found to be Y = 0.04295X + 0.02427 (R = 0.9984) (Fig. S4†). The fluorescence detection limit was measured to be 0.47 μM based on 3σ/k (Fig. S5†). The absorption and fluorescence titration experiments suggested that sensor 1 is a promising colorimetric and ratiometric fluorescence sensor for the determination of low-level Cu2+.
Absorption and fluorescence spectral responses of the 1-Cu2+ complex to amino acids
As demonstrated above, the absorbance and fluorescence intensity of 1-Cu2+ complex reached the maximum value when 3.0 eq. of Cu2+ were added. To investigate the reversibility of the binding of sensor 1 with Cu2+, the 1-Cu2+ complex obtained with 2.0 eq. Cu2+ and 2 mL solution of 1 (2 × 10⁻⁵ mol L−1) in CH3CN–H2O (9/1, v/v) was used as the initial state.To evaluate the selectivity of the 1-Cu2+ complex toward various amino acids in CH3CN–H2O (9/1, v/v) solution, we first conducted the absorption experiment by using UV-vis spectroscopy. Upon addition of a constant amount of each amino acid (35 eq.), only Arg resulted in the complete disappearance of the visible absorption peak at 564 nm with a color change from pink to light yellow (Fig. S6A and C†). Furthermore, the selectivity of the 1-Cu2+ complex for amino acids was also investigated with fluorescence spectroscopy. As expected, Arg also could be distinguished from other amino acids in fluorescence spectra at the same conditions. Upon the addition of amino acids to solution of 1-Cu2+ complex, only Arg resulted in the quench of fluorescence emission at 615 nm and the increase of emission at 490 nm (Fig. S6B and D†).
Competition experiments were also performed by adding the Arg (30 eq.) to the solution of the 1-Cu2+ complex in the presence of 50.0 eq. other amino acids, in which similar absorption spectral changes were observed as that with Arg only, indicating that other amino acids have a negligible effect on the recognition of Arg for the 1-Cu2+ complex (Fig. S7A†). In addition, the fluorescence responses of 1-Cu2+ complex towards various amino acids after the addition of Arg were measured. As shown in Fig. S7B,† for 1-Cu2+ complex, the ratiometric fluorescence response induced by Arg was hardly affected in the presence of other amino acids. These results suggested that the presence of other amino acids at relatively high concentrations did not interfere with the detection of Arg under the same experimental conditions.
Optical responses of the 1-Cu2+ complex to Arg
To gain further insight into interactions of 1-Cu2+ complex and Arg, absorption and fluorescence titration experiments were conducted in CH3CN–H2O (9/1, v/v) solution. As shown in Fig. 3A, upon gradual addition of Arg to the 1-Cu2+ complex solution, the absorption peak at 564 nm was steadily decreased. Simultaneously, a distinct color change from pink to light yellow could be observed (Inset in Fig. 3A). As shown in Fig. 3B, the absorbance of 1-Cu2+ complex decreased at 564 nm with the addition of incremental amounts of Arg and completely disappeared when 35 eq. Arg was added. Moreover, the change of absorbance at 564 nm was linearly related (Y = −0.00529X + 2.00338, R2 = 0.9971) to the concentration of Arg in a range of 0 to 200 μM (Fig. S8†). The UV-vis detection limit of the 1-Cu2+ complex toward Arg was determined to be as low as 0.60 μM based on 3σ/k (Fig. S9†). | ||
| Fig. 3 (A) Changes in absorption spectra of 1-Cu2+ in CH3CN–H2O (9/1, v/v) solutions upon addition of Arg (0–40.0 eq.). (B) Absorption titration profile (at 564 nm) versus concentration of Arg for 1-Cu2+. (C) Fluorescent intensities ratio (I615/I490) change of 1-Cu2+ solution in CH3CN–H2O (9/1, v/v, 2 × 10⁻⁵ mol L−1) on incremental addition of Arg (0–40.0 eq.). (D) The relationship between fluorescent intensities ratio (I615/I490) change. | ||
Similarly, the sensing property of 1-Cu2+ complex toward Arg was further investigated by using fluorescence titration experiment. As shown in Fig. 3C, upon excited at 350 nm, the fluorescence intensity around 615 nm decreased with the incremental addition of Arg, whereas the emission band around 490 nm gradually increased. The fluorescence spectra of the 1-Cu2+ complex did not show further change when 30 eq. Arg was added. The ratio of fluorescence intensity at 615 and 490 nm (I615/I490) exhibited a 14-fold variation in the ratios from 1.67 to 0.12 in the 1-Cu2+ complex (Fig. 3D). As shown in Fig. S10,† 1-Cu2+ complex exhibited an excellent linear relationship (Y = −0.00621X + 1.52485, R2 = 0.9788) between the relative emission ratios and the concentration of Arg in a range of 0 to 200 μM. In addition, the fluorescence detection limit (3σ/k) was calculated to be 0.33 μM (Fig. S11†). For 1-Cu2+ complex, it exhibited optimal performance for the detection of Arg including low LOD, high sensitivity, and “naked-eyes” recognition, which suggested that it could be used as a fluorescence sensor for determination of Arg.
Detection mechanism for Cu2+ and Arg
To investigate the mechanism of interactions between sensor 1 and Cu2+, we recorded 1H NMR spectra of 1 with different equivalents of Cu2+ (Fig. 4A). As shown in 1H NMR, upon addition of Cu2+ to the DMSO-d6 solution of 1, the imine proton (Ha) at around δ 9.49 ppm disappeared. The result showed that the formation of the 1-Cu2+ complex is through the coordination of the imine proton in sensor 1 with Cu2+.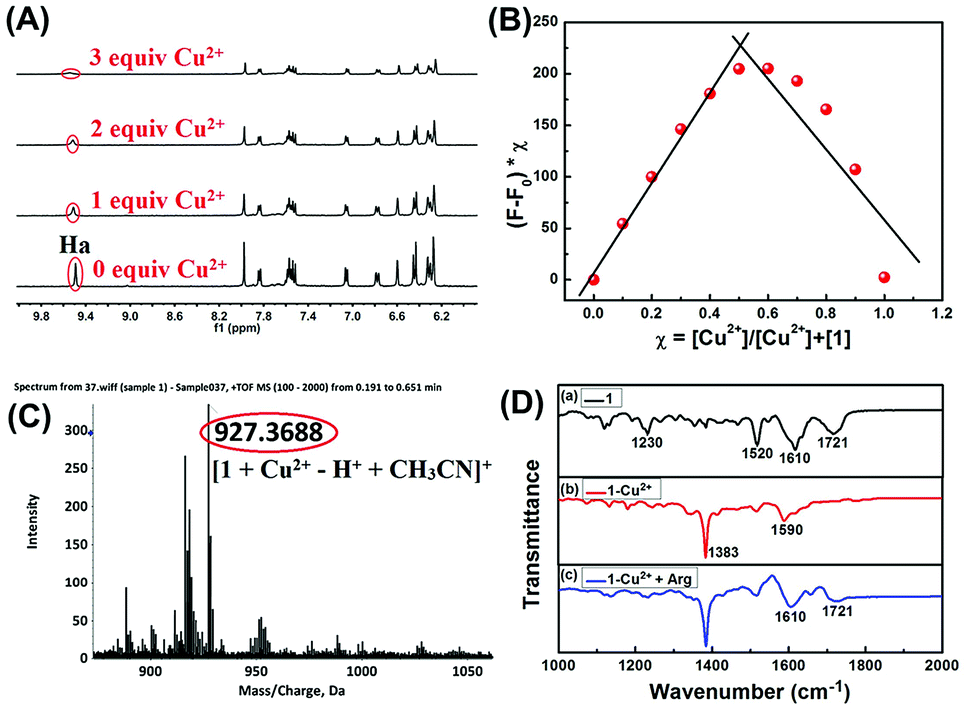 | ||
Fig. 4 (A) Partial 1H NMR spectra change of 1 in DMSO-d6 upon addition of Cu2+. (B) Job's plot for the complex of 1 with Cu2+, indicating the formation of a 1![[thin space (1/6-em)]](https://www.rsc.org/images/entities/char_2009.gif) :1 complex. The total [1] + [Cu2+] = 40 μM. (C) ESI-MS spectrum of 1-Cu2+. (D) Partial FT-IR spectra of 1 (a), 1-Cu2+ (b) and 1-Cu2+ + Arg (c). :1 complex. The total [1] + [Cu2+] = 40 μM. (C) ESI-MS spectrum of 1-Cu2+. (D) Partial FT-IR spectra of 1 (a), 1-Cu2+ (b) and 1-Cu2+ + Arg (c). | ||
Furthermore, Job's plot experiments were conducted to understand the binding stoichiometry of 1-Cu2+ complex. In the experiments, the total concentration of sensor 1 and Cu2+ was maintained at 40 μM, and the fluorescence responses of 1 toward Cu2+ were monitored at 615 nm as a function of the molar fraction of Cu2+. As shown in Fig. 4B, when the molar fraction of Cu2+ was 0.5, the fluorescence intensity reached the maximum, which suggested that the binding stoichiometry of 1-Cu2+ complex is 1:1. Moreover, the binding stoichiometry of 1-Cu2+ complex was confirmed by the ESI-MS spectrum in which the peak at 927.36 corresponded to [1 + Cu2+ – H+ + CH3CN]+ (Fig. 4C). These results confirmed that the 1-Cu2+ complex is a 1:1 complexation stoichiometry.
FT-IR measurements were also performed to investigate the mechanism of interactions between 1-Cu2+ complex and Arg. The FT-IR spectra of 1, 1-Cu2+ and 1-Cu2+ + Arg were shown in Fig. 4D. As illustrated in Fig. 4D(a), the two peaks located at 1721 and 1610 cm−1 could correspond to the antisymmetric and symmetric stretching vibrations of C![[double bond, length as m-dash]](https://www.rsc.org/images/entities/char_e001.gif) O (the rhodamine B unit),48 and the strong band at 1520 cm−1 could be assigned to CC stretching of benzenoid units.49 For the 1-Cu2+ complex, because of the disappearance of the CO group (1721 cm−1) absorption band, the absorption peak at 1610 cm−1 shifted to 1590 cm−1, indicating that the CO functional group bonded with Cu2+ and the spirolactam structure in rhodamine B changed from off to on. The FT-IR spectrum of Fig. 4D(b) showed a strong absorption peak at 1383 cm−1, which could be attributed to the characteristic absorption band of excess Cu(NO3)2. By comparing the FT-IR spectra of 1 (Fig. 4D(a)) and 1-Cu2+ (Fig. 4D(d)), the absorption band at 1721 cm−1 reappeared, and the absorption band at 1590 cm−1 was restored to its initial state after the addition of Arg, which indicated the re-formation of spirolactam from open chain amide. These results indicated that the sensor 1 first chelates with Cu2+ to form a 1-Cu2+ complex, and then restores to its initial state with the addition of Arg because of higher binding affinity between Arg and Cu2+ which leads to the escape of Cu2+ from 1-Cu2+ complex.
O (the rhodamine B unit),48 and the strong band at 1520 cm−1 could be assigned to CC stretching of benzenoid units.49 For the 1-Cu2+ complex, because of the disappearance of the CO group (1721 cm−1) absorption band, the absorption peak at 1610 cm−1 shifted to 1590 cm−1, indicating that the CO functional group bonded with Cu2+ and the spirolactam structure in rhodamine B changed from off to on. The FT-IR spectrum of Fig. 4D(b) showed a strong absorption peak at 1383 cm−1, which could be attributed to the characteristic absorption band of excess Cu(NO3)2. By comparing the FT-IR spectra of 1 (Fig. 4D(a)) and 1-Cu2+ (Fig. 4D(d)), the absorption band at 1721 cm−1 reappeared, and the absorption band at 1590 cm−1 was restored to its initial state after the addition of Arg, which indicated the re-formation of spirolactam from open chain amide. These results indicated that the sensor 1 first chelates with Cu2+ to form a 1-Cu2+ complex, and then restores to its initial state with the addition of Arg because of higher binding affinity between Arg and Cu2+ which leads to the escape of Cu2+ from 1-Cu2+ complex.
It is well recognized that a large spectral overlap between the donor emission spectrum and the acceptor absorption spectrum can achieve efficient FRET. In this work, our strategy is using coumarin group as the energy donor and rhodamine B moiety as an energy acceptor. As shown in Fig. S12,† coumarin group has strong fluorescence in the range of 425–650 nm in the absence of Cu2+, but the FRET pathway was completely suppressed. After addition of Cu2+, the fluorescence spectrum of coumarin group (donor) overlapped with the absorption spectrum of the ring-opened amide isomer of rhodamine B unit (450–600 nm, acceptor), which indicated that the efficient FRET process could occur. Subsequent addition of Arg to the solution of 1-Cu2+ complex regenerated the spirolactam structure in the rhodamine B. As a result, the FRET process was discontinued, and the emission spectrum came back to the original state of sensor 1. The corresponding mechanism for detecting Cu2+ and Arg with sensor 1 is illustrated in Scheme 2.
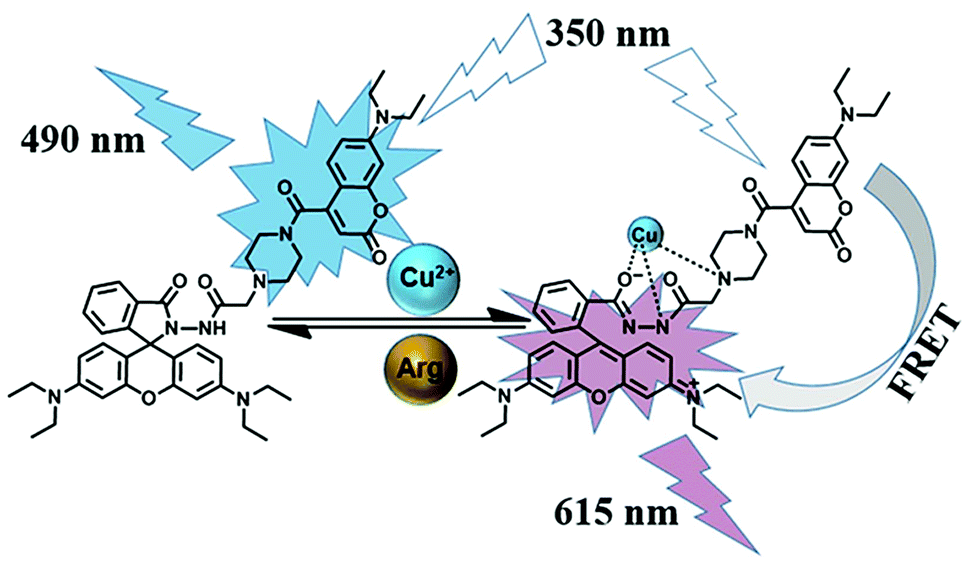 | ||
| Scheme 2 Principle for sequentially detecting Cu2+ and arginine. | ||
Fluorescence imaging of Cu2+ in living cells
To demonstrate its potential application value in biological systems, the HeLa cells were selected to study the application feasibility of the ratiometric sensor 1 preliminarily for intracellular Cu2+ imaging. As shown in Fig. 5, the fluorescence images were recorded at 430–530 nm and 550–650 nm at an excitation wavelength of 405 nm. After the HeLa cells were incubated with the addition of sensor 1 (20 μM) for 30 minutes in the absence of Cu2+, a strong blue fluorescence of the coumarin group (Fig. 5B) was observed almost without pink fluorescence of rhodamine B. In contrast, after the addition of Cu2+, the HeLa cells exhibited a significant change in fluorescence, in which a strong pink fluorescence appeared (Fig. 5E) with the quenching of blue fluorescence. These findings are consistent with the results of the previous experiments and analysis of the fluorescence intensity of the sensor 1 to Cu2+. These preliminary study results implied that the sensor 1 is cell permeable and can be applied to ratiometric fluorescence imaging of intracellular Cu2+.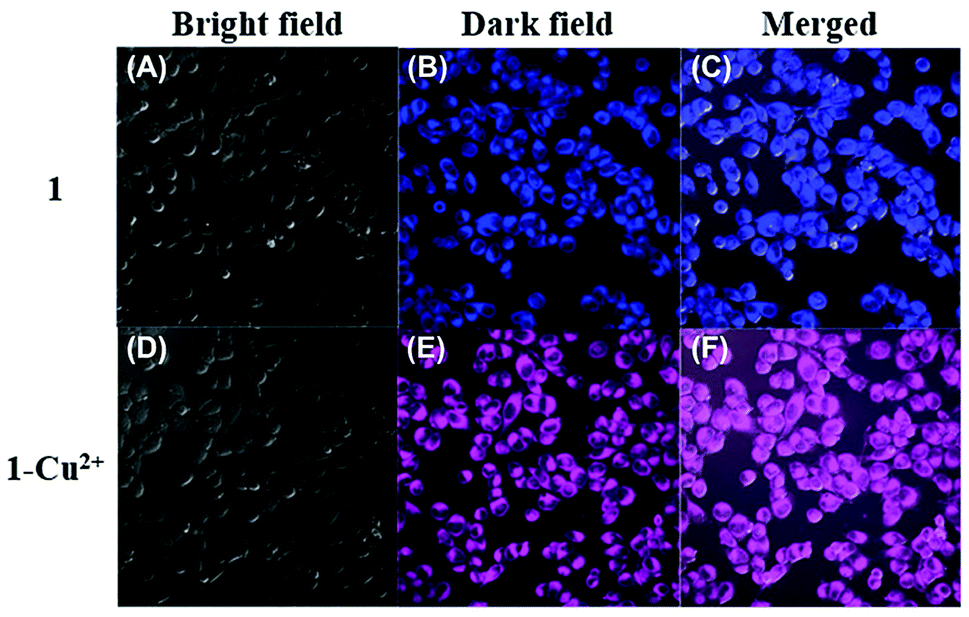 | ||
| Fig. 5 Confocal fluorescence images of HeLa cells incubated with sensor 1 (20 μM) for 30 min (A–C) and then treated with Cu2+ (2 mM) for another 30 min (D–F). Images were obtained using an excitation of 405 nm and emission channels of (B) at 430–530 nm and (E) at 550–650 nm; (C and F) merge images of (A, B and D, E); (A and D) bright field images of the cell culture. | ||
Conclusions
In conclusion, a colorimetric and ratiometric fluorescent sensor based on coumarin and rhodamine B units has been developed. The Cu2+-induced changes in color and fluorescence not only have high selectivity and sensitivity but also can be visualized by “naked-eyes”. According to ESI-MS spectrometric results and Job's plot analysis, the metal–ligand complex of Cu2+ and sensor 1 was formed in a ratio of 1:1. In addition, the spectral shifts of two obvious emission bands were up to 125 nm, which can reduce the interference of crosstalk signals, eliminate any influence of excitation backscattering, and improve the detection accuracy. More importantly, the 1-Cu2+ complex could be successfully applied to detect Arg over other amino acids selectively. The fluorescence imaging experiment confirmed that the ratiometric imaging ability of the sensor 1 towards trace intracellular Cu2+ in living cells. Therefore, the sensor 1 can be used to detect trace amounts of Cu2+ and Arg with remarkable changes in both color and fluorescence, which is highly desirable for biological detection and imaging.
Experimental
Reagents and methods
All inorganic salts, expect for K+, Hg2+, and Mn2+, were obtained by corresponding metal nitrates. Typically, 1 mmol of each reagent was mixed with 10 mL of distilled water to obtain an inorganic salt solution (0.1 mol L−1). All amino acids were prepared with deionized water to obtain the desired concentration (0.1 mol L−1). All the stock solutions were stored in the dark and diluted to the required concentration when needed. The sensor 1 was dissolved in CH3CN to obtain the stock solution (1.0 × 10⁻³ mol L−1). The fluorescence and absorption experiments of sensor 1 (2.0 × 10⁻⁵ mol L−1) were measured by adding the appropriate amount of metal ions into 2 mL of CH3CN–H2O (9/1, v/v) solution. In the experiments of amino acid detection, the solutions containing 1-Cu2+ complex were obtained by adding Cu2+ (2.0 eq.) into a solution of the sensor 1 in CH3CN–H2O (9/1, v/v, 2.0 × 10⁻⁵ mol L−1).Instrumentation
NMR spectra were obtained by a Bruker AV400 (1H NMR 400 MHz, 13C NMR 100 MHz) instrument using CD2Cl2 and DMSO-d6 as solvent and tetramethylsilane (TMS) as the internal standard. Mass spectrometry analysis was performed on an Agilent 1100 ion trap MSD spectrometer. Melting points were measured with a WRS-1B melting point apparatus. Fluorescence spectra were collected with a Hitachi F-4600 fluorescence spectrophotometer. UV-vis absorption spectra were carried out using an Agilent 8453 UV/vis spectrophotometer. Infrared spectra (IR) were collected on a Bruker Vertex-70 spectrometer. Elemental analysis was determined on a PE CHN 2400 analyzer. Fluorescence imaging of cells was performed using an Olympus FV1000 confocal laser scanning microscope.Cell culture and imaging
The living HeLa cells, namely human cervical cancer cells, were cultured in DMEM (Dulbecco modified Eagle's medium) supplemented with 10% FBS (fetal bovine serum) in an atmosphere consisting of 5% CO2 and 95% air at 37 °C. The cells were plated in a confocal dish and allowed to adhere overnight. The next day before the experiments, the cells were washed with phosphate-buffered saline (PBS) buffer. After the cells were incubated with the addition of sensor 1 (20 μM) in the culture medium for 30 min, the cells were incubated with Cu2+ (2.0 mM) for another 30 min. Subsequently, the fluorescence images were acquired by an OLYMPUS FV1000 confocal laser scanning microscope with an excitation filter of 405 nm and emission channels of 430–530 nm and 550–650 nm.Synthesis of the sensor 1
The synthetic route to sensor 1 is depicted in Scheme 1. Compounds 2, 3, and 6 were synthesized as described in the literature.38,50,51 To a stirring mixture of compound 3 (0.17 g, 0.32 mmol) and compound 6 (0.12 g, 0.35 mmol) in CH3CN (40 mL), K2CO3 (0.057 g, 0.42 mmol) was added and continuously stirred. Then the mixture solution was refluxed for 12 h. After evaporation of the solvent, the resulting residue was purified by silica gel column chromatography with ethyl acetate to obtain target compound 1 (0.17 g, 0.20 mmol) with a yield of 62.5%. Mp 427–428 K; 1H NMR (400 MHz, CD2Cl2), δ (ppm): 8.17 (s, 1H), 7.83 (d, J = 4.0 Hz, 1H), 7.63 (s, 1H), 7.44 (m, 2H), 7.24 (d, J = 8.0 Hz, 1H), 7.01 (d, J = 8.0 Hz, 1H), 6.55 (d, J = 8.0 Hz, 1H), 6.50 (d, J = 8.0 Hz, 2H), 6.42 (s, 1H), 6.25 (s, 3H), 6.23 (s, 1H), 3.39–3.35 (m, 6H), 3.31–3.17 (m, 8H), 3.09 (s, 2H), 2.89 (s, 2H), 2.26 (d, J = 12.0 Hz, 4H), 1.14 (t, J = 6.0 Hz, 6H), 1.04 (t, J = 8.0 Hz, 12H) (Fig. S13†); 13C NMR (100 MHz, CD2Cl2), δ (ppm): 166.67, 164.33, 164.09, 158.34, 156.74, 153.20, 151.22, 150.87, 148.60, 143.50, 132.61, 129.15, 129.00, 128.78, 127.91, 123.44, 122.69, 116.03, 108.82, 107.52, 107.10, 103.60, 96.98, 96.37, 65.47, 59.93, 46.64, 44.40, 43.87, 41.47, 11.81, 11.68 (Fig. S14†); ESI-MS (m/z): 826.42 [1 + H+]+ (Fig. S15†); anal. calcd for C48H55N7O6: C, 69.80; H, 6.71; N, 11.87; O, 11.62%. Found: C, 69.67; H, 6.88; N, 11.78; O, 11.67%.Conflicts of interest
There are no conflicts to declare.Acknowledgements
The authors are grateful for the financial support from the National Natural Science Foundation of China (21662015, 21861017, 41867052, 41867053), the “5511” Science and Technology Innovation talent project of Jiangxi, the key project of Natural Science Foundation of Jiangxi Province (20171ACB20025), the Science Funds of Natural Science Foundation of Jiangxi Province (20171BAB203014, 20171BAB203011), the Masters' Innovative Foundation of Jiangxi Science and Technology Normal University (YC2017-X30).Notes and references
- E. L. Que, D. W. Domaille and C. J. Chang, Chem. Rev., 2008, 108, 1517–1549 CrossRef CAS PubMed.
- Y. H. Wang, C. Zhang, X. C. Chen, B. Yang, L. Yang and C. L. Jiang, Nanoscale, 2016, 8, 5977–5984 RSC.
- H. Ryu, M. G. Choi, E. J. Cho and S. K. Chang, Dyes Pigm., 2018, 153, 117–124 CrossRef.
- Y. Jiao, L. Zhou, H. Y. He, J. Q. Yin, Q. M. Gao and J. N. Wei, Talanta, 2018, 184, 143–148 CrossRef CAS PubMed.
- G. Y. Lan, C. C. Huang and H. T. Chang, Chem. Commun., 2010, 46, 1257–1259 RSC.
- H. S. Jung, M. Park, D. Y. Han, E. Kim, C. Lee and S. Ham, Org. Lett., 2009, 11, 3378–3381 CrossRef CAS PubMed.
- B. Nisar Ahamed, I. Ravikumar and P. Ghosh, New J. Chem., 2009, 33, 1825–1828 RSC.
- R. Martínez, F. Zapata, A. Caballero and A. Espinosa, Org. Lett., 2006, 8, 3235–3238 CrossRef PubMed.
- Y. H. Huang, X. Y. Jin, Y. Y. Zhao, H. Cong and Z. Tao, Org. Biomol. Chem., 2018, 16, 5343–5349 RSC.
- Z. L. Shi, Y. Y. Tu, R. J. Wang, G. Liu and S. Z. Pu, Dyes Pigm., 2018, 149, 764–773 CrossRef CAS.
- Z. H. Fu, L. B. Yan, X. L. Zhang, F. F. Zhu, X. L. Han and J. G. Fang, Org. Biomol. Chem., 2017, 15, 4115–4121 RSC.
- S. Z. Pu, Q. Sun, C. B. Fan, R. J. Wang and G. Liu, J. Mater. Chem. C, 2016, 4, 3075–3093 RSC.
- H. Wang, B. Fang, L. Zhou, D. Li, L. Kong and K. Uvdalb, Org. Biomol. Chem., 2018, 16, 2264–2268 RSC.
- S. J. Xia, G. Liu and S. Z. Pu, J. Mater. Chem. C, 2015, 3, 4023–4029 RSC.
- J. A. Kemlo and T. M. Shepherd, Chem. Phys. Lett., 1977, 47, 158–162 CrossRef CAS.
- X. Zhang, Y. Shiraishi and T. Hirai, Org. Lett., 2007, 9, 5039–5042 CrossRef CAS PubMed.
- X. J. Meng, S. L. Li, W. B. Ma, J. L. Wang, Z. Y. Hu and D. L. Cao, Dyes Pigm., 2018, 154, 194–198 CrossRef CAS.
- N. Maurya and A. K. Singh, Dyes Pigm., 2017, 147, 484–490 CrossRef CAS.
- T. Minami, N. A. Esipenko, B. Zhang and L. Isaacs, Chem. Commun., 2014, 50, 61–63 RSC.
- J. Liu, Y. Q. Sun, Y. Y. Huo, H. X. Zhang, L. F. Wang and P. Zhang, J. Am. Chem. Soc., 2013, 136, 574–577 CrossRef PubMed.
- Q. S. Mei and Z. P. Zhang, Angew. Chem., Int. Ed., 2012, 51, 5602–5606 CrossRef CAS PubMed.
- N. Guelzim, F. Mariotti, P. G. P. Martin, F. Lasserre, T. Pineau and D. Hermier, Amino Acids, 2011, 41, 969–979 CrossRef CAS PubMed.
- T. Liu, N. Li, J. X. Dong, Y. Zhang, Y. Z. Fan and S. M. Lin, Biosens. Bioelectron., 2017, 87, 772–778 CrossRef CAS PubMed.
- S. Khezri, M. Bahram and N. Samadi, Anal. Methods, 2017, 9, 6513–6524 RSC.
- A. Ghorai, J. Mondal and G. K. Patra, New J. Chem., 2016, 40, 7821–7830 RSC.
- V. Gopalakrishnan, P. J. Burton and T. F. Blaschke, Anal. Chem., 1996, 68, 3520–3523 CrossRef CAS PubMed.
- J. Williams, D. Lang, J. A. Smith and M. J. Lewis, Biochem. Pharmacol., 1993, 46, 2097–2099 CrossRef CAS PubMed.
- H. Y. Zhang, M. X. Li, W. Y. Feng and G. Q. Feng, Dyes Pigm., 2018, 149, 475–480 CrossRef CAS.
- M. Z. Zhang, H. H. Han, S. Z. Zhang, C. Y. Wang, Y. X. Lu and W. H. Zhu, J. Mater. Chem. B, 2017, 5, 8780–8785 RSC.
- N. Verma, A. K. Singh and P. Kaur, J. Anal. Chem., 2015, 70, 1111–1115 CrossRef CAS.
- K. A. Rawat and S. K. Kailasa, Microchim. Acta, 2014, 181, 1917–1929 CrossRef CAS.
- J. H. Cao, L. P. Ding, Y. Y. Zhang, S. H. Wang and Y. Fang, J. Photochem. Photobiol., A, 2016, 314, 66–74 CrossRef CAS.
- W. J. Lu, Y. F. Gao, Y. Jiao, S. M. Shuang, C. Z. Li and C. Dong, Nanoscale, 2017, 9, 11545–11552 RSC.
- L. D. Lavis, Annu. Rev. Biochem., 2017, 86, 825–843 CrossRef CAS PubMed.
- H. N. Kim, M. H. Lee, H. J. Kim, J. S. Kim and J. Y. Yoon, Chem. Soc. Rev., 2008, 37, 1465–1472 RSC.
- L. Yuan, W. Y. Lin, Y. N. Xie, B. Chen and S. S. Zhu, J. Am. Chem. Soc., 2011, 134, 1305–1315 CrossRef PubMed.
- R. L. Zhang, J. Zhao, G. M. Han, Z. J. Liu, C. Liu and C. Zhang, J. Am. Chem. Soc., 2016, 138, 3769–3778 CrossRef CAS PubMed.
- H. C. Ding, B. Q. Li, S. Z. Pu, G. Liu, D. C. Jia and Y. Zhou, Sens. Actuators, B, 2017, 247, 26–35 CrossRef CAS.
- L. He, V. L. L. So and J. H. Xin, Sens. Actuators, B, 2014, 192, 496–502 CrossRef CAS.
- X. F. Zhang, T. Zhang, S. L. Shen, J. Y. Miao and B. X. Zhao, J. Mater. Chem. B, 2015, 3, 3260–3266 RSC.
- J. Liu, Y. Q. Sun, P. Wang, J. Y. Zhang and W. Guo, Analyst, 2013, 138, 2654–2660 RSC.
- Y. Q. Wang, T. Zhao, X. W. He, W. Y. Li and Y. K. Zhang, Biosens. Bioelectron., 2014, 51, 40–46 CrossRef CAS PubMed.
- F. F. Liu, C. B. Fan and S. Z. Pu, RSC Adv., 2018, 8, 31113–31120 RSC.
- E. T. Feng, C. B. Fan, N. S. Wang, G. Liu and S. Z. Pu, Dyes Pigm., 2018, 151, 22–27 CrossRef CAS.
- Z. J. Hu, J. W. Hu, Y. Cui, G. N. Wang, X. J. Zhang and K. Uvdal, J. Mater. Chem. B, 2014, 2, 4467–4472 RSC.
- X. Y. Guan, W. Y. Lin and W. M. Huang, Org. Biomol. Chem., 2014, 12, 3944–3949 RSC.
- J. J. Wu, Z. Ye, F. Wu, H. Y. Wang, L. T. Zeng and G. M. Bao, Talanta, 2018, 181, 239–247 CrossRef CAS PubMed.
- R. Tabit, O. Amadine, Y. Essamlali, K. Danoun, A. Rhihil and M. Zahouily, RSC Adv., 2018, 8, 1351–1360 RSC.
- A. V. Murugan, T. Muraliganth and A. Manthiram, Chem. Mater., 2009, 21, 5004–5006 CrossRef CAS.
- P. P. Ren, R. J. Wang, S. Z. Pu, G. Liu and C. B. Fan, J. Phys. Org. Chem., 2014, 27, 183–190 CrossRef CAS.
- Y. Kurishita, T. Kohira, A. Ojida and I. Hamachi, J. Am. Chem. Soc., 2010, 132, 13290–13299 CrossRef CAS PubMed.
Footnote |
| † Electronic supplementary information (ESI) available. See DOI: 10.1039/c8ra09943j |
| This journal is © The Royal Society of Chemistry 2019 |