DOI:
10.1039/C8RA09840A
(Paper)
RSC Adv., 2019,
9, 7975-7983
A comparative study of side-chain-type poly(ether ether ketone) anion exchange membrane functionalized with different hetero-cycloaliphatic quaternary ammonium groups†
Received
30th November 2018
, Accepted 7th February 2019
First published on 11th March 2019
Abstract
Anion exchange membranes based on side-chain-type quarternized poly(ether ether ketone)s (QPEEKs), containing different hetero-cycloaliphatic quaternary ammonium groups, were prepared via a multi-step procedure, including polycondensation with a monomer containing pendant methylphenyl groups, bromomethylation, and followed by quaternization with 1-methylpyrrolidine (MPY), 1-methylpiperidine (MPRD), 1-methylimidazole (MIDZ) and N-methyl morpholine (MMPH), respectively. The properties of these membranes were then compared with the properties of conventional quarternized poly(ether ether ketone)s containing benzyltrimethylammonium (QPEEK-TMA). Model compounds, QMPY, QMPRD, QMIDZ and QMMPH, were synthesized and used to quantitatively compare the alkaline stability of hetero-cycloaliphatic quaternary ammonium groups using 1H NMR. The results of this study indicated that the alkaline stability of all these model compounds is in the order of QMPY > QMPRD > QTMA > QMIDZ > QMMPH. These QPEEKs membranes display superior thermal, dimensional and mechanical stability. QPEEK-TMA, QPEEK-MPY and QPEEK-MPRD exhibit higher hydroxide conductivities and lower activation energies than QPEEK-MIDZ and QPEEK-MMPH. Furthermore, after exposure to 1 M NaOH at 60 °C for 24 days, QPEEK-MPY and QPEEK-MPRD demonstrated a loss in hydroxide conductivity of 28.5% and 33.4%, respectively. Both values were lower than that of QPEEK-TMA (37.7%). Therefore, among these side-chain-type QPEEKs membranes, QPEEK-MPY and QPEEK-MPRD, containing benzylmethylpyrrolidinium and benzylmethylpiperidinium as cation head-groups, are promising AEM materials for fuel cell construction.
Introduction
The current pattern of mankind's energy consumption is facing more and more problems and challenges, including the excessive dependence on traditional fossil fuels, such as coal and oil. Also, it causes environmental pollution and greenhouse gas emission due to combustion of fossil fuels.1 Therefore, the development of clean and sustainable energy sources for replacing fossil fuels has been initiated. At present, there are many possible alternative energy sources to the combustion of fossil fuels under investigation, for example, solar energy, wind energy, hydrogen energy, nuclear energy, tidal energy and bio-energy. However, utilization of new energy requires energy generation, storage and release.2,3
In the past decades, hydrogen fuel cells have become the new and promising energy technology due to their high energy conversion efficiency, superior portability and environmental friendliness.4,5 As one type of fuel cells, anion exchange membrane fuel cells (AEMFCs) have drawn tremendous attention due to their potential advantages over common proton exchange membrane fuel cells (PEMFCs), including enhanced oxygen reduction kinetics and faster fuel oxidation kinetics under alkaline conditions. This technology would allow using low-cost, non-precious metal catalysts and reducing the overall cost of AEMFCs greatly.6–10 As the core component in AEMFCs, anion exchange membrane (AEM) serves as the electrolyte for hydroxide ion transport between electrodes and separates the fuel from the oxidant.11 Hence, in order to ensure efficient and stable operation of AEMFCs, the ideal AEM must possess high enough hydroxide conductivity (the conductivity must meet the requirement: >10 mS cm−1 at room temperature and close to 100 mS cm−1 as far as possible at working temperature), satisfactory thermal and chemical stability, and sufficient film forming ability, mechanical strength and dimensional stability.12
Quaternary ammonium (QA) functionalized polymer electrolyte membranes, especially those using trimethylamine (TMA) as the quaternary reagent, have been widely investigated as potential AEM materials. Most of them were prepared by tethering QA groups to the backbone of chloromethylated or bromomethylated aromatic polymers by immersing them in TMA solution.13,14 However, conventional QA-functionalized AEMs exhibit very low ionic conductivity and poor alkaline stability at high pH and high temperature conditions. Therefore, many researchers have concentrated on molecular design to improve the performance of AEMs. Some achievements have been made in this field by finding alternatives to QA functional groups. Marino et al. studied the alkaline stability of different cationic model compounds in high-pH solutions by determining the half-times of the compounds using NMR analysis. The results suggested that aliphatic-heterocyclic QA head-groups exhibited excellent alkaline stability compared to that of the conventional benzyltrimethylammonium head-groups, especially under extreme accelerated experiment conditions.15 For example, piperidinium demonstrated high resistance to both nucleophilic substitution and elimination in 6 M NaOH at elevated temperatures. Recently, many researchers also reported that AEMs, based on polymers containing N-alkylpyrrolidinium and benzyl-N-methylmorpholinium head-groups, exhibited higher alkaline stability than the commercial Tokuyama A201 AEMs.16–18 Ponce-gonzález et al. reported that radiation-grafted AEMs, containing saturated-heterocyclic head-groups, displayed a relatively good alkaline stability, conductivity and in situ fuel cell performance.19 They believe that the benzyl-N-methylpyrrolidinium head-group is the most promising alternative to benzyltrimethylammonium head-group.
As recently reported, locating the sulfonic acid groups on the side chains of the polymer backbones could improve the mobility of ions, thus, promoting phase separation and increasing proton conductivity. Nowadays, in some studies of AEMs, a similar method has been utilized to tether cationic head-groups to the side chain of the polymer for improving the hydroxide conductivity of AEMs without sacrificing their favourable mechanical properties.20,21
Aromatic polymers, such as poly(ether ether ketone)s (PEEK), are the most extensively used starting materials for the preparation of AEMs by grafting QA groups onto the main polymer backbone.22–24 However, it was reported that the backbone undergoes cleavage of C–O bonds under the attack of hydroxide anions when electron-withdrawing cationic head-groups are in close proximity.25 It was postulated that attaching cationic head-groups to the backbone via a bulky spacer in the side chain could isolate the electron-withdrawing effect of the cation from the aromatic C–O bonds, thereby, enhancing the alkaline stability of AEMs.
In this study, we synthesized a series of PEEKs with pendant methylphenyl groups, which gave us a chance to prepare side-chain-type AEMs bearing cationic head-groups, linked to backbones via bulky spacers in the side chains. After bromomethylation of methylphenyl-containing PEEKs, AEMs, based on aliphatic-heterocyclic QA head-groups, were prepared via Menshutkin reaction using 1-methylpyrrolidine (MPY), 1-methylpiperidine (MPRD), 1-methylimidazole (MIDZ) and N-methyl morpholine (MMPH) as quaternary reagents, respectively. Quarternized poly(ether ether ketone)s (QPEEKs) containing benzyltrimethylammonium head-groups were also prepared using trimethylamine (TMA) for comparison. The purpose of this study was mainly to compare the characteristics of AEMs containing different aliphatic-heterocyclic QA groups, including ionic exchange capacity (IEC), thermal stability, dimensional stability, mechanical properties, ionic conductivity, especially the effect of hydroxide conductivity on alkaline stability, mechanical properties and 1H NMR spectra after aging in alkaline solution. In addition, a series of model compounds with aliphatic-heterocyclic QA cations were synthesized and used to characterize degradation of these cations using 1H NMR spectroscopy. It would help to clarify the alkaline stability of QPEEKs with relevant cationic groups on side chain when exposed to alkaline solutions. In this paper, the AEMs with side-chain-type configuration and different aliphatic-heterocyclic QA head-groups are discussed in detail, comparing related properties, especially ionic conductivity and alkaline stability.
Experimental section
Materials
4,4-Difluorobenzophenone (DFBP) was purchased from Yanbian Longjing chemical company. N-Bromosuccinimide (NBS, 99%), benzoyl peroxide (BPO, 99%), MPY (98%), MPRD (97%), MIDZ (99%), MMPH (99%), p-benzoquinone (99%) and p-toluidine (AR, 99%) were obtained from Aladdin Reagent Co. Ltd. Trimethylamine in methanol (TMA, 3.2 mol L−1) was purchased from TCI. All other reagents and solvents were purchased from Tianjin Tiantai chemical company and used without further purification.
Synthesis of model compounds
The synthesis of benzyltrimethylammonium model compound (QTMA) was described by us earlier.26 One mL (8.69 mmol) benzyl chloride was dissolved in 40 mL ethyl alcohol in a 100 mL three-neck round bottom flask, equipped with a mechanical stirrer and a condenser, and then 5.43 mL (17.38 mmol) TMA was added to the flask. The reaction mixture was stirred at 78 °C for 6 h. Finally, the mixture was washed with diethyl ether and filtered. The product was washed with diethyl ether eight times and dried in a vacuum oven at 80 °C for 48 h.
As shown in Scheme 1, benzylmethylpyrrolidine, benzylmethylpiperidine, benzylmethylimidazole and benzylmethylmorpholine model compounds were synthesized using the similar procedure, employing MPY, MPRD, MIDZ and MMPH as the quaternary reagents. These model compounds with aliphatic-heterocyclic QA are denoted as QMPY, QMPRD, QMIDZ and QMMPH, respectively. Taking QMPY as an example, the synthesis was carried out as follows. One mL (8.69 mmol) benzyl chloride was dissolved in 40 mL ethyl alcohol in a 100 mL three-neck round bottom flask equipped with a mechanical stirrer and a condenser, and then 1.85 mL (17.38 mmol) MPY was added into the flask. The reaction mixture was stirred at 78 °C for 6 h. Finally, the product was precipitated in diethyl ether, filtered off, washed with diethyl ether eight times and dried in a vacuum oven at 80 °C for 48 h.
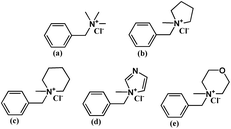 |
| | Scheme 1 Chemical structures of model compounds: QTMA (a), QMPY (b), QMPRD (c), QMIDZ (d) and QMMPH (e). | |
Synthesis of bromomethylated poly(ether ether ketone)
The 4-methylphenyl hydroquinone (He-MQ) monomer was synthesized according to procedure, used in our previous study.27 Poly(ether ether ketone) containing methylphenyl groups was synthesized as follows. He-MQ (8.00 g, 40.00 mmol), DFBP (8.72 g, 40.00 mmol), anhydrous potassium carbonate (5.52 g, 40.00 mmol), dimethyl sulfoxide (DMSO, 40 mL) and toluene (18 mL) were added to a 250 mL three-neck round bottom flask equipped with a mechanical stirrer, a nitrogen inlet and a condenser. Toluene was added and the reaction mixture was heated to 140 °C, refluxed for 4 h and then heated to 180 °C to remove toluene. The product was precipitated in cold distilled water when the mixture became very viscous after 5 h. Finally, the product was filtered off, smashed, washed with boiling deionized water more than ten times and dried under vacuum at 80 °C for 48 h.
The synthesis of bromomethylated PEEK is shown in Scheme 2. Bromomethylation of PEEK, a free-radical substitution reaction, is mild and controllable, which distinguishes it from the usual chloromethylation reaction. NBS and BPO were used as the brominating reagent and the initiator, respectively. The product was denoted as BrPEEK-X, where X is the ratio of NBS to PEEK. Taking BrPEEK-1.2 as an example, the detailed procedure is as follows. The powder of PEEK (3.00 g, 7.94 mmol) was dissolved in dry 1,1,2,2-tetrachloroethane in a 100 mL three-neck round bottom flask, equipped with a mechanical stirrer, a nitrogen inlet and a condenser. When the color of the mixture became orange, NBS (1.70 g, 9.52 mmol) and BPO (0.23 g, 0.95 mmol) were added into the flask. The mixture was heated to 180 °C for 10 h and turned claret-red gradually. Finally, the light-yellow polymer was precipitated in ethanol, washed with ethanol ten times and dried in a vacuum oven at 70 °C for 10 h.
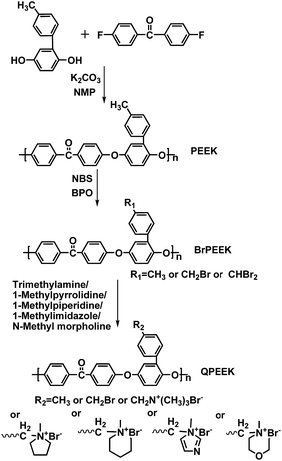 |
| | Scheme 2 Synthesis of PEEK, BrPEEK-X and QPEEK. | |
Synthesis of QPEEKs using TMA, MPY, MPRD, MIDZ, and MMPH
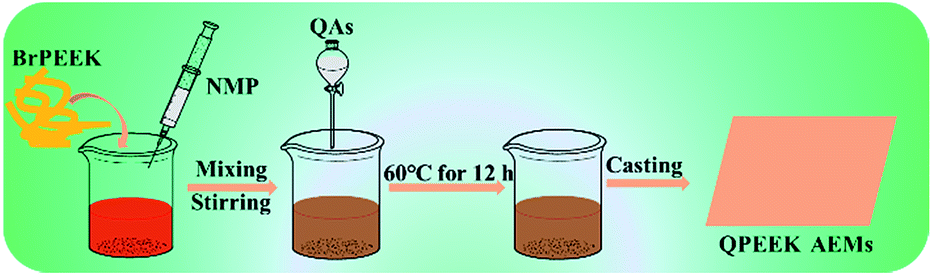
The powder of BrPEEK-1.2 (3.00 g, 5.01 mmol) was dissolved in N-methyl-2-pyrrolidone (NMP) in a 100 mL three-neck round bottom flask equipped with a mechanical stirrer and a condenser. Then MPY (1.06 mL, 10.02 mmol) was added into the flask and the reaction was kept at 60 °C for 12 h. Later the solution was cast onto a flat glass plate and thermally treated under vacuum at 60 °C for 48 h to get rid of the residual NMP solvent. Finally, the membrane was removed from the glass, cut into pieces, washed with acetone ten times and dried in a vacuum oven at 80 °C for 48 h. The obtained product was named QPEEK-MPY. Using a similar procedure, QPEEK-TMA, QPEEK-MPRD, QPEEK-MIDZ and QPEEK-MMPH were also synthesized.
Preparation of AEMs
Membranes, based on these QPEEKs, were fabricated using the solution casting method as shown in Scheme 3. For example, QPEEK-MPY (1.0 g) was dissolved in 10 mL NMP, and then the mixture was cast onto a flat glass plate and thermally treated under vacuum at 60 °C for 48 h to remove the residual solvent. The membrane was removed from the glass plate, immersed in 1 M NaOH solution for 24 h at room temperature and washed with deionized water ten times to remove extra ions. Finally, the hydroxide (OH−) counterion form membranes were obtained. All membranes were kept in a nitrogen filled ziplock bag before testing to avoid access to CO2.
 |
| | Scheme 3 Preparation of AEMs. | |
Characterization and measurement
Chemical structures of the model compounds, the monomer, PEEK, BrPEEK-X and QPEEKs were analyzed using 1H NMR spectroscopy (in CDCl3 and/or DMSO), performed on a Bruker 510 spectrometer (500 MHz) with tetramethylsilane (TMS) as a reference. To determine the thermal properties of AEMs, thermogravimetric analysis (TGA) was performed on a Perkin Elmer Pyris 1 TGA instrument with a heating rate of 10 °C min−1 in the range of 100 to 800 °C under nitrogen atmosphere. A SHIMADZU AG-1 1KN was used to explore the mechanical properties of QPEEK membranes at a speed of 2 mm min−1. At least ten samples (15 mm × 4 mm) were tested, and the average values of mechanical properties were calculated and recorded. All measurements were taken on membranes in OH− form.
Alkaline stability test of model compounds. The alkaline stability of model compounds was determined using 1H NMR after aging the model compounds in 1 M sodium deuteroxide deuterium oxide solution (NaOD/D2O) at 60 °C periodically.
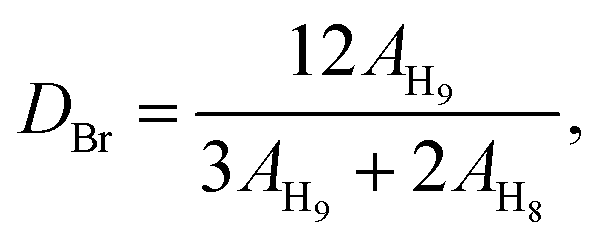
Calculation of bromination. The average bromine content of each repeating unit of BrPEEK was determined accurately by 1H NMR using the following formula:| |
 | (1) |
where DBr represents the number of bromomethyl functional groups in each repeating unit. AH9 and AH8 are the integral areas of the benzyl bromide groups and the methyl protons, respectively.
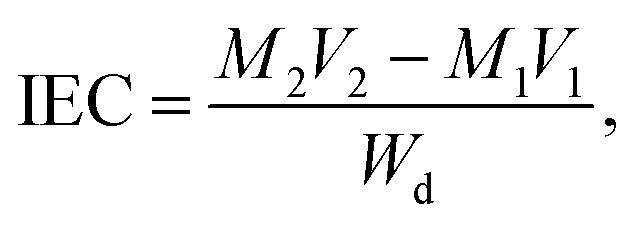
Ion exchange capacity (IEC). The ion exchange capacity (IEC) of the membranes in the OH− form was measured using the acid–base titration method in triplicate. The membranes were dried in a vacuum oven at 60 °C for 48 h, accurately weighted, and immersed in 40 mL of a 0.05 M hydrochloric acid solution. Then the samples were equilibrated for at least 48 h under an argon atmosphere. The resulting solutions were titrated with a standardized 0.08 M sodium hydroxide solution. The IEC (mmol g−1) was described as| |
 | (2) |
where M1 (M) and V1 (mL) are the concentration and the volume of hydrochloric acid before equilibrium was reached. M2 (M) and V2 (mL) refer to the concentration and volume of the standardized sodium hydroxide solution used for titration. Wd is the mass of the dry samples.
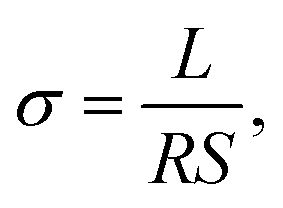
Hydroxide conductivity. Hydroxide conductivity (σ) was measured with a Princeton Applied Research 2273 potentiostat/galvanostat/frequency response analyzer using a four-probe AC impedance method, frequency ranging from 1 Hz to 1 MHz. The thickness of all membranes (1 cm × 4.5 cm) was measured before measuring σ. The test cell with the membrane was immersed in deionized water to keep 100% relative humidity at the tested temperature. The hydroxide conductivity (σ) was characterized by the following equation:| |
 | (6) |
where L is the distance between the electrodes (cm), R is the membrane resistance and S is the cross-sectional area of membrane (cm2).The slopes in Arrhenius plots of the logarithm of the ion conductivity versus 1000/T can be used to estimate the apparent activation energies (Ea) using the following equation:
| |
σ = A![[thin space (1/6-em)]](https://www.rsc.org/images/entities/char_2009.gif) exp(−Ea/RT), exp(−Ea/RT),
| (7) |
where
σ,
A,
Ea,
R and
T represent the hydroxide conductivity, a frequency factor, the apparent activation energy, the gas constant and the temperature, respectively. The apparent activation energy is estimated from the slopes of the ln
σ vs. 1000/
T curves.
Alkaline stability of AEMs. The membranes in hydroxide (OH−) counterion form were labeled as 0 day's sample. Then, QPEEK membranes were kept in 1 M NaOH aqueous solution at 60 °C for 1 day to 24 days, taken out at each interval, washed with deionized water ten times to remove extra ions and tested for hydroxide conductivity. The alkaline stability of AEMs was estimated using the remaining hydroxide conductivity after immersing them in 1 M NaOH at 60 °C for a desired time period. In addition, the mechanical properties and the changes in 1H NMR spectra were also used to evaluate the relative stabilities of QPEEKs in OH− form after immersing them in 1 M NaOH at 60 °C for 24 d.
Results and discussion
Evaluating alkaline stability via degradation of model compounds
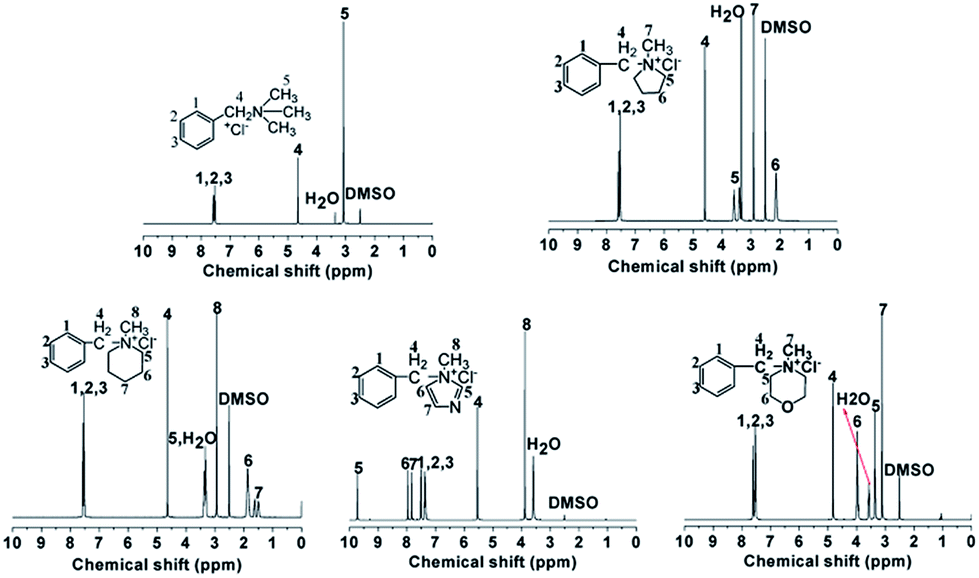
Fig. 1 shows the 1H NMR spectra of model compounds QTMA, QMPY, QMPRD, QMIDZ and QMMPH. For the QMPY model compound, the chemical shifts around 7.58–7.51 ppm (H1,2,3), 4.60 ppm (H4) and 2.90 ppm (H7) were assigned to the protons on the phenyl, benzyl and methyl groups, respectively. Besides, the peaks around 3.50 ppm (H5) and 2.2 ppm (H6) were assigned to the protons on methylene groups of MPY. Similar characteristic peaks were observed in other 1H NMR spectra of model compounds, which indicated that all the model compounds were synthesized successfully.
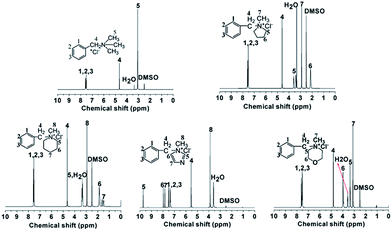 |
| | Fig. 1 The 1H NMR spectra of model compounds QTMA, QMPY, QMPRD, QMIDZ and QMMPH. | |
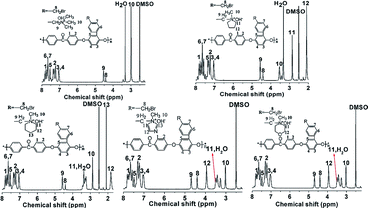
To monitor the process of degradation and thoroughly investigate the alkaline stability of hetero-cycloaliphatic QA groups, 1H NMR spectra of model compounds QMPY, QMPRD, QMIDZ and QMMPH alkali aging in 1 M NaOH/D2O at 60 °C were periodically measured for 18 days, as shown in Fig. 2. QTMA was also investigated at the same conditions so that its degradation pattern could be used as a reference for all model compounds. The water peak at 4.78 ppm was chosen as the internal reference on account of its integral area being nearly constant in the process. Then we could obtain the remaining fraction of the model compounds at a desired period of up to 18 days by calculating the relative integral area of proton resonances on the phenyl groups, which is presented in Fig. 2(f). During the test, QTMA, QMPY, QMPRD and QMMPH solutions were clear and transparent, but QMIDZ solution turned into a pale yellow emulsion and produced yellow oil droplets after 4 days. In order to continue the alkaline stability test of QMIDZ, the light-yellow supernatant was taken out each day. As shown in Fig. 2(f), these model compounds showed a fast degradation in the first 6 days and then reached a plateau after the 7th day. As shown in Fig. 2(d) and (f), the relative integral area of proton resonances of QMIDZ and QMMPH decreased significantly as the aging time increased.
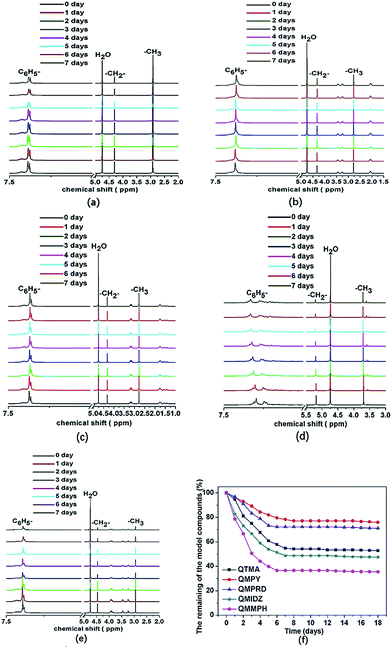 |
| | Fig. 2 The 1H NMR spectra of QTMA (a), QMPY (b), QMPRD (c), QMIDZ (d) and QMMPH (e) model compounds aged in 1 M NaOD/D2O at 60 °C, and the remaining fraction of the model compounds in 1 M NaOD/D2O (f). | |
After 18 days of aging, QMIDZ and QMMPH exhibited degradation of 52.5% and 64.2%, respectively. However, the degradation degree of QMPY and QMPRD with saturated aliphatic-heterocyclic QA head-groups, calculated from their 1H NMR spectra, was just 24.1% and 28.9%, respectively; these values were much lower than those of QMIDZ and QMMPH. Importantly, the degradation degree of QMPY and QMPRD was also much lower than that of conventional QTMA (47.3%), indicating that pyrrolidium and piperidium head-groups were found to have higher stability as compared to benzyltrimethylammonium head-group. These degradations, except for that of QTMA, were mostly due to the ring-opening reaction caused by the OH− nucleophilic attack. From these results, it is clear that the alkaline stability of all model compounds follows the order of QMPY > QMPRD > QTMA > QMIDZ > QMMPH. This conclusion can be used to select the type of QAs for the preparation of QPEEKs and analyze the alkaline stability of the AEM.
Structural characterization of QPEEKs
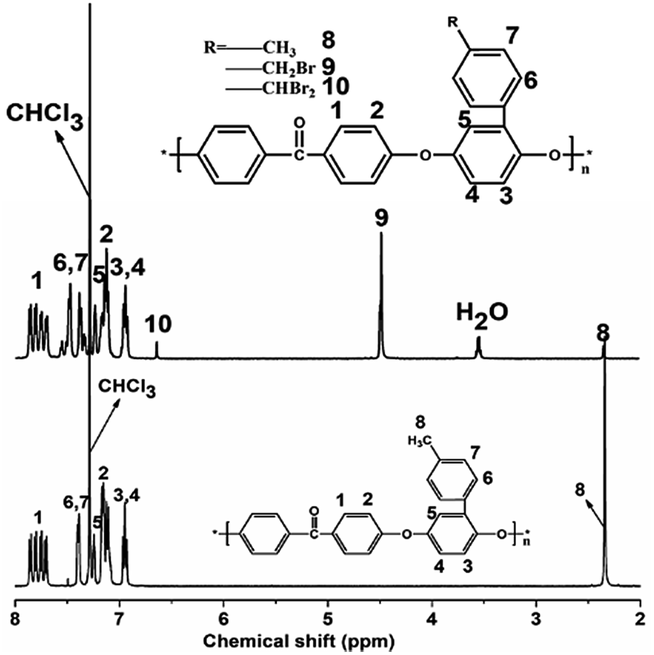
The 1HNMR spectra of PEEK and BrPEEK are shown in Fig. 3. The chemical shifts at around 4.50 ppm and 2.24 ppm were assigned to the protons of the benzyl bromide groups (–CH2Br) and the methyl protons (–CH3), respectively. The conversion ratio of bromomethylation could be controlled by adjusting the molar proportions of NBS and PEEK. The amounts of –CHBr2, –CH2Br and –CH3 after bromomethylation were quantitatively determined by calculating their integral areas and the results are listed in Table 1. The amount of –CHBr2 per repeat unit increased from 0.04 to 0.48, while the amount of –CH3 decreased from 0.23 to 0, as NBS/PEEK was adjusted from 1.0 to 2.0. Meanwhile, the amount of the target group –CH2Br per repeat unit (DBr) increased slightly from 0.74 to 0.78 and then decreased to 0.46 when NBS/PEEK increased from 1.0 to 2.0. In the following procedure, the intermediate product BrPEEK with the highest DBr of 0.78 was chosen to be the precursor for tethering hetero-cycloaliphatic QA groups.
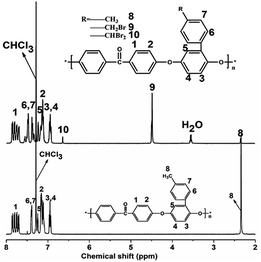 |
| | Fig. 3 The 1H NMR spectra of PEEK and BrPEEK-1.2. | |
Table 1 The amounts of –CHBr2, –CH2Br and –CH3 per repeat unit after bromomethylation
| NBS/PEEK |
–CHBr2 |
–CH2Br |
–CH3 |
| 2.0 |
0.48 |
0.46 |
0 |
| 1.5 |
0.32 |
0.62 |
0 |
| 1.4 |
0.20 |
0.68 |
0 |
| 1.3 |
0.16 |
0.74 |
0 |
| 1.2 |
0.12 |
0.78 |
0.04 |
| 1.1 |
0.07 |
0.76 |
0.12 |
| 1.0 |
0.04 |
0.74 |
0.23 |
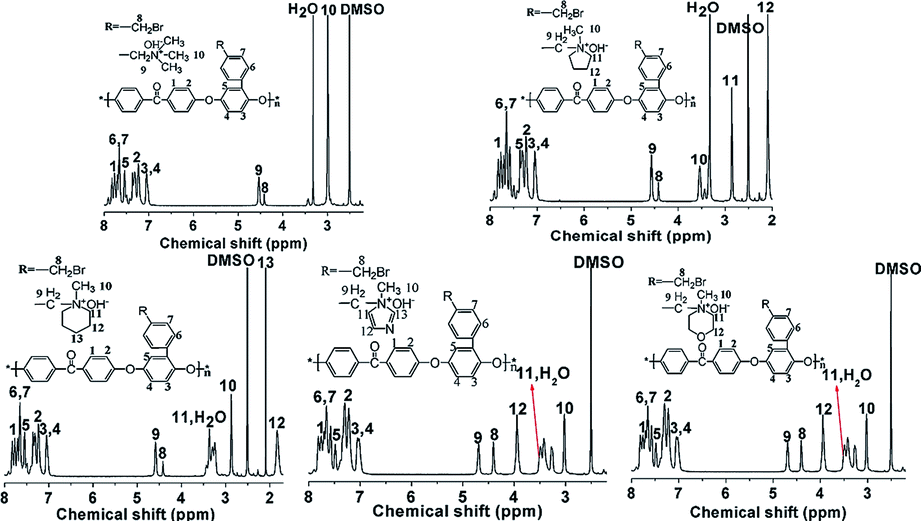
The 1H NMR spectra of QPEEKs are shown in Fig. 4. For QPEEK-MPY, the chemical shift around 4.70 ppm (H9) was assigned the protons of –CH2–N groups; meanwhile, 2.80 ppm (H11) and 2.10 ppm (H12) corresponded to the protons of –CH2– groups in MPY ring. Similar peaks were found in the other spectra of QPEEK-TMA, QPEEK-MPRD, QPEEK-MMPH and QPEEK-MIDZ (Fig. 5). These QPEEKs were synthesized successfully and all conversion ratios from BrPEEK were between 80–85%, obtained by calculating the integration ratio of quaternized ammonium benzyl groups (H9) to brominated benzyl groups (H8).
 |
| | Fig. 4 The 1H NMR spectra of QPEEK-TMA, QPEEK-MPY, QPEEK-MPRD, QPEEK-MIDZ and QPEEK-MMPH. | |
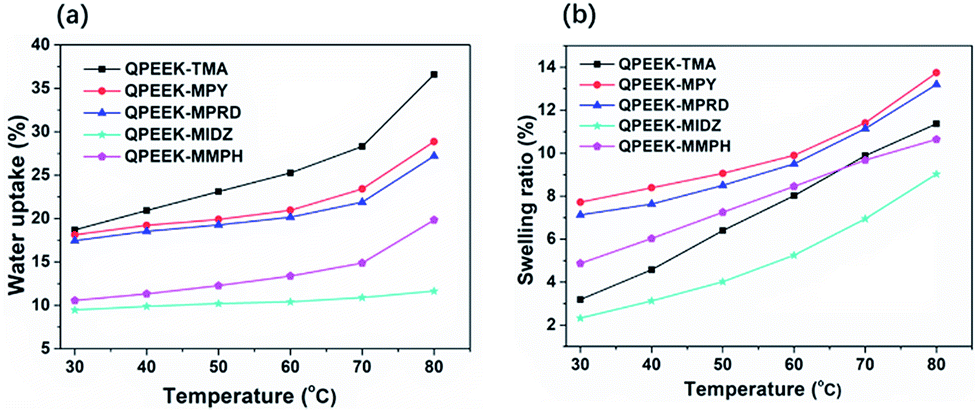
 |
| | Fig. 5 Water uptake and swelling ratio of QPEEKs. | |
As presented in Table 2, the theoretical IEC, calculated using the 1H NMR spectra, was in the range of 1.10 to 1.74 mmol g−1. The experimental values obtained by the titration method varied from 0.99 to 1.63 mmol g−1. The experimental IEC of these QPEEK membranes was line with the theoretical value, implying the successful Menschutkin reaction. QPEEK-TMA, QPEEK-MPY and QPEEK-MPRD exhibited similar IEC values of 1.63 mmol g−1, 1.49 mmol g−1 and 1.52 mmol g−1, respectively. QPEEK-MIDZ and QPEEK-MMPH had relatively lower IECs than those of the first three membranes.
Table 2 Ion exchange capacity, water uptake at 80 °C, and hydroxide conductivity at 80 °C of QPEEKs
| Sample |
IECa (mmol g−1) |
IECb (mmol g−1) |
Water uptake (%) |
σ (mS cm−1) |
λ (OH−) |
| Calculated from 1H NMR spectra. Estimated by titration. λ average number of H2O per quaternary ammonium group at 30 °C. Water uptake and σ were measured at 80 °C. |
| QPEEK-TMA |
1.74 |
1.63 |
36.6 |
40.5 |
6.37 |
| QPEEK-MPY |
1.68 |
1.49 |
28.9 |
39.9 |
6.76 |
| QPEEK-MPRD |
1.68 |
1.52 |
27.2 |
38.8 |
6.38 |
| QPEEK-MIDZ |
1.14 |
1.03 |
11.6 |
37.4 |
5.11 |
| QPEEK-MMPH |
1.10 |
0.99 |
19.8 |
33.1 |
5.93 |
Water uptake and swelling ratio
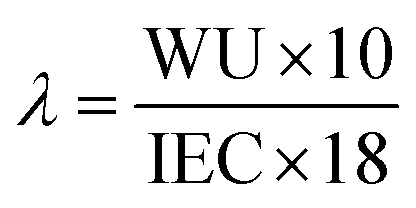
Water uptake plays an important role in determining performance of ion-exchange membrane materials. According to the vehicle mechanism, ions can not penetrate membranes unless they are hydrated by water. However, excessive water uptake results in a high swelling ratio, which damages the dimensional stability and the mechanical properties of AEMs. Therefore, it is very important to control the water uptake and the swelling ratio in a reasonable range. Water uptake and the swelling ratio of QPEEKs in the OH− form as a function of temperature, ranging from 30 °C to 80 °C, are shown in Fig. 5. Both the water uptake and the swelling ratio of these membranes increased with increasing temperature. The QPEEKs with hetero-cycloaliphatic QA head-groups showed much lower water uptake than QPEEK-TMA (18.7% at 30 °C and 36.6% at 80 °C). For example, QPEEK-MPY and QPEEK-MPRD exhibited similar water uptake of 18.1% and 17.5% at 30 °C as well as 28.9% and 27.2% at 80 °C, respectively. Furthermore, QPEEK-MPY and QPEEK-MPRD exhibited similar swelling ratios. Different from water uptake, their swelling ratios were higher than that of QPEEK-TMA (3.2% at 30 °C and 11.4% at 80%) with similar IECs. Besides, the corresponding λ of QPEEK-TMA, QPEEK-MPY and QPEEK-MPRD was in the range of 6.37 to 6.76, which was higher than the values for QPEEK-MIDZ and QPEEK-MMPH. On the whole, the changes in water uptake and λ were in line with the change in IEC.
Thermal stability
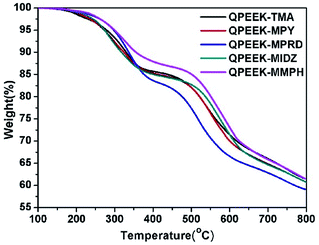
The TGA curves of QPEEKs are shown in Fig. 6. All these TGA curves exhibited two thermal decomposition stages with the temperature variation from 100 °C to 800 °C under nitrogen atmosphere. The temperature of the first weight loss, assigned to the decomposition of QAs on side chains, was approximately 200 °C and no further decomposition was observed. The temperature of the second weight loss, assigned to the decomposition of the main chains of QPEEK, was approximately 490 °C. Moreover, QPEEK-TMA, QPEEK-MPY and QPEEK-MIDZ exhibited similar Td5% of 279.1 °C, 272.8 °C and 273.6 °C, respectively. QPEEK-MPRD exhibited a relatively higher Td5% of 286.0 °C and QPEEK-MMPH displayed the highest Td5% of 299.3 °C. The Td5% of all these QPEEKs was higher than 270 °C. Besides, the residual weight percentage of all these QPEEKs at 800 °C was in the range of 59.1∼61.5%. Therefore, all membranes possessed sufficient thermal stability for potential application in construction of fuel cells.28
 |
| | Fig. 6 TGA curves of QPEEKs. | |
Mechanical properties
The mechanical properties of QPEEKs, measured in the dry state, are listed in Table 3. QPEEKs exhibited tensile strength from 43.8 MPa to 68.8 MPa, Young's modulus from 590.2 MPa to 911.1 MPa and the elongation at break from 10.2% to 70.0%. QPEEK-MIDZ had a maximum tensile strength of 68.8 MPa and a maximum Young's modulus of 911.1 MPa, while QPEEK-MMPH had a maximum elongation at break of 70.0%. According to the tensile strength of QPEEKs presented in Table 2, the mechanical strength of QPEEKs follows the order: QPEEK-MIDZ > QPEEK-MMPH > QPEEK-QMPY ≈ QPEEK-MPRD > QPEEK-TMA. The AEMs with hetero-cycloaliphatic QA head-groups had higher tensile strength than QPEEK-TMA, indicating that they were strong enough to be applied in fuel cell construction.
Table 3 Mechanical Properties of QPEEKs
| Sample |
Tensile strength (MPa) |
Elongation at break (%) |
Young's modulus (MPa) |
| QPEEK-TMA |
43.8 ± 2.2 |
16.5 ± 2.5 |
590.2 ± 127.7 |
| QPEEK-MPY |
46.2 ± 1.0 |
18.0 ± 2.1 |
771.6 ± 63.6 |
| QPEEK-MPRD |
46.0 ± 0.7 |
10.2 ± 1.2 |
820.9 ± 62.0 |
| QPEEK-MIDZ |
68.8 ± 4.8 |
27.9 ± 3.7 |
911.1 ± 131.8 |
| QPEEK-MMPH |
60.0 ± 6.7 |
70.0 ± 2.9 |
801.5 ± 75.5 |
Hydroxide conductivity
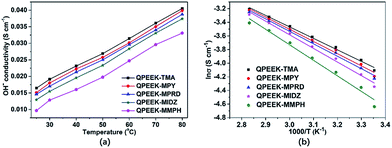
Hydroxide conductivity is the core parameter used to determine the performance of AEMs. The hydroxide conductivities of QPEEKs as the function of temperature are shown in Fig. 7(a). The hydroxide conductivities of all these membranes increased with increasing temperature. The hydroxide conductivities of QPEEK-MPY (39.9 mS cm−1, 80 °C) and QPEEK-MPRD (38.8 mS cm−1, 80 °C) were slightly lower than that of QPEEK-TMA (40.5 mS cm−1, 80 °C), but higher than those of QPEEK-MIDZ (37.4 mS cm−1, 80 °C) and QPEEK-MMPH (33.08 mS cm−1, 80 °C). Using the Arrhenius plots of hydroxide conductivity displayed in Fig. 7(b), the apparent activation energies of QPEEKs were calculated from the slopes of the lines: 13.8 kJ mol−1 for QPEEK-TMA, 14.8 kJ mol−1 for QPEEK-MPY, 15.2 kJ mol−1 for QPEEK-MPRD, 16.2 kJ mol−1 for QPEEK-MIDZ and 19.0 kJ mol−1 for QPEEK-MMPH, respectively. The lower apparent activation energies of QPEEK-MPY and QPEEK-MPRD indicated that their hydroxide conductivity could be enhanced, presumably, due to better dissociation, thus, facilitating the mobility of OH− anions.29,30
 |
| | Fig. 7 Hydroxide conductivity of QPEEKs (a) and Arrhenius plots of hydroxide conductivity of QPEEKs (b). | |
Evaluating the alkaline stability of AEMs using hydroxide conductivity
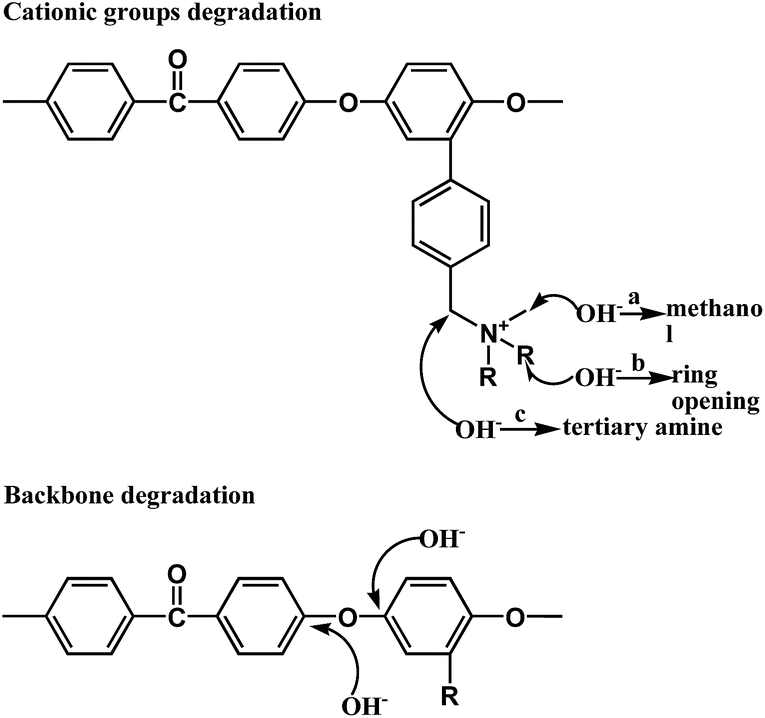
Since AEMs must be stable in a strongly alkaline environment, alkaline stability is one of the important parameters of AEMs for their practical application in AEMFCs. As reported earlier regarding methyl-containing head groups, there are three possible pathways of cationic groups' degradation, presented in Fig. 8. Pathway a is the SN2 substitution of the methyl group, resulting in loss of methanol and yielding a polymer containing a benzyl-linked secondary amine.31 Pathway b is a nucleophilic attack or Hofmann elimination reaction that leads to heterocyclic ring opening.32 Pathway c is a nucleophilic attack at the benzylic Φ–CH2–N which is especially sensitive.33 Besides, there is backbone degradation due to cleavage of aryl ether (Csp2–O) bonds, as shown in Fig. 8.25
 |
| | Fig. 8 Possible OH− promoted degradation pathways in QPEEKs membranes. | |
As shown in Table 4, the mechanical properties of QPEEKs, such as strength, elongation and modulus loss, declined after the OH− treatment for 24 d. This occured mainly because that aryl ether-containing polymers underwent polymer backbone degradation via cleavage of C–O bonds under alkaline conditions,34,35 as shown in Fig. 8.
Table 4 Mechanical properties of QPEEKs membranes after treatment with OH− for 24 d
| Sample |
Tensile strength (MPa) |
Elongation at break (%) |
Young's modulus (MPa) |
| QPEEK-TMA |
34.5 ± 5.2 |
5.3 ± 0.5 |
472.3 ± 77.0 |
| QPEEK-MPY |
30.7 ± 8.3 |
5.7 ± 0.8 |
421.7 ± 38.1 |
| QPEEK-MPRD |
15.5 ± 2.7 |
1.8 ± 0.3 |
291.2 ± 42.0 |
| QPEEK-MIDZ |
61.9 ± 2.4 |
17.0 ± 5.4 |
492.6 ± 58.8 |
| QPEEK-MMPH |
53.3 ± 2.4 |
23.6 ± 2.9 |
528.3 ± 31.3 |
The change in the hydroxide conductivity as a function of time was used to evaluate the relative stability of QPEEKs in the OH− form by immersing them in 1 M NaOH at 60 °C. The remaining hydroxide conductivity at 80 °C of the QPEEKs in the OH− form is shown Fig. 9. The hydroxide conductivities of all these QPEEKs decreased as the immersion time increased. After immersing the AEMs in 1 M NaOH at 60 °C for 24 days, QPEEK-MIDZ and QPEEK-MMPH showed a significant loss in hydroxide conductivity (>40%), caused by lower alkaline stability of benzylmethylimidazolium and benzylmethylmorpholinium at high temperature. QPEEK-TMA displayed a slightly lower loss than QPEEK-MPY and QPEEK-MPRD in the first 15 days. But after 24 days, QPEEK-MPY and QPEEK-MPRD exhibited the hydroxide conductivity losses of 28.5% and 33.4%, respectively, which were lower than that of QPEEK-TMA (37.7%). For QPEEK-TMA, QPEEK-MPY and QPEEK-MPRD, a new signal appeared around 5.85 ppm in 1H NMR spectrum, assigned to the proton of the OH group of phenol, and the peak shapes showed some differences between 7 ppm and 8 ppm after storage in 1 M NaOH at 60 °C for 24 days (Fig S1, S2 and S3†), possibly induced by QPEEKs polymer backbone scission of those membranes. The integrated area ratio of Ar–CH2–N+ (A1) and –CH2–Br or –CH2–OH (A0) is also recorded in Fig S1, S2 and S3.† The changes of A1:A0 before and after the OH− treatment were due to the degradation of cationic groups, possibly via pathways a, b and c, shown in Fig. 8. This would cause the functional group loss and, then, conductivity loss. The degradation of polymer backbone could cause cationic group loss by dissolving low Mw and highly functionalized polymer fragment, which resulted in conductivity loss. It should be noted that the alkaline stability of QPEEKs membranes was not completely consistent with that of model compounds. This occured mainly because the alkaline stability of QPEEKs was comprehensively affected by many factors: QPEEKs structure, different experimental conditions, different water uptake, etc. The anion exchange membrane exhibited a relatively high local pH in alkaline solution and a low water uptake, which led to more degradation. It is why the alkaline stability of QPEEK-MMPH and QPEEK-MIDZ was not consistent with that of QMIDZ and QMMPH.
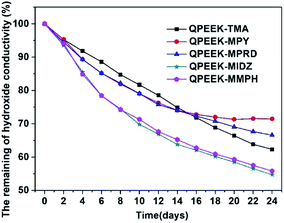 |
| | Fig. 9 The remaining hydroxide conductivity of QPEEKs membranes in the OH− form after soaking them in 1 M NaOH. | |
Conclusions
Several model compounds with aliphatic-heterocyclic QA head-groups were synthesized and their alkaline stability was characterized by 1H NMR. Our results indicated that the alkaline stability of these model compounds followed the order of QMPY > QMPRD > QTMA > QMIDZ > QMMPH. Then, a series of AEMs with aliphatic-heterocyclic QA head-groups on the side chains were prepared and compared with QPEEK-TMA. These QPEEKs exhibited sufficient thermal, dimensional and mechanical stability. QPEEK-MPY, QPEEK-MPRD and QPEEK-TMA exhibited similar OH− conductivities of 39.9 mS cm−1, 38.8 mS cm−1 and 40.5 mS cm−1 at 80 °C and 100% relative humidity. Furthermore, after a 24 days' test, QPEEK-MPY and QPEEK-MPRD possessed better alkaline stability after their immersion in 1 M NaOH solution at 60 °C. They exhibited conductivity loss of 28.5% and 33.4%, respectively, which was lower than that of QPEEK-TMA (37.7%). All parameters indicate that QPEEK-MPY and QPEEK-MPRD can be potential components of AEMFCs, especially QPEEK-MPY, which exhibited the best overall performance.
Conflicts of interest
There are no conflicts to declare.
Acknowledgements
We acknowledge the financial support from the Natural Science Foundation of China (No. 21474036).
Notes and references
- A. B. Rao and E. S. Rubin, Environ. Sci. Technol., 2002, 36, 4467 CrossRef CAS PubMed.
- N. Li and M. D. Guiver, Macromolecules, 2014, 47, 2175–2198 CrossRef CAS.
- J. R. Varcoe, P. Atanassov, D. R. Dekel, A. M. Herring, M. A. Hickner, P. A. Kohl, A. R. Kucernak, W. E. Mustain, K. Nijmeijer and K. Scott, Energy Environ. Sci., 2014, 7, 3135–3191 RSC.
- G. J. K. Acres, J. Power Sources, 2001, 100, 60–66 CrossRef CAS.
- Y. J. Wang, J. Qiao, R. Baker and J. Zhang, Chem. Soc. Rev., 2013, 42, 5768–5787 RSC.
- C. Chen, J. Pan, J. Han, Y. Wang, L. Zhu, M. A. Hickner and L. Zhuang, J. Mater. Chem. A, 2016, 4, 4071–4081 RSC.
- C. Chen, Y. L. S. Tse, G. E. Lindberg, C. Knight and G. A. Voth, J. Am. Chem. Soc., 2016, 138, 991 CrossRef CAS PubMed.
- S. Chempath, B. R. Einsla, L. R. Pratt, C. S. Macomber and J. M. Boncella, J. Phys. Chem. C, 2017, 112, 3179–3182 CrossRef.
- J. R. Varcoe, R. C. T. Slade and T. N. Danks, J. Mater. Chem., 2003, 13, 712–721 RSC.
- C. E. Diesendruck and D. R. Dekel, Curr. Opin. Electrochem., 2018, 9, 173–178 CrossRef CAS.
- C. H. Park, S. Y. Lee, D. S. Hwang, D. W. Shin, D. H. Cho, K. H. Lee, T. W. Kim, T. W. Kim, M. Lee and D. S. Kim, Nature, 2016, 532, 480 CrossRef PubMed.
- J. Pan, C. Chen, L. Zhuang and J. Lu, Acc. Chem. Res., 2012, 45, 473 CrossRef CAS PubMed.
- F. Bu, C. Zhao, B. Wang, N. Zhang, H. Lu, Z. Cai, Y. Zhang and H. Na, RSC Adv., 2015, 5, 57067–57075 RSC.
- H. S. Dang and P. Jannasch, J. Mater. Chem. A, 2016, 4, 11924–11938 RSC.
- M. G. Marino and K. D. Kreuer, Chemsuschem, 2015, 8, 513–523 CrossRef CAS PubMed.
- K. M. Meek, J. R. Nykaza and Y. A. Elabd, Macromolecules, 2016, 49, 3382–3394 CrossRef CAS.
- F. Gu, H. Dong, Y. Li, Z. Sun and Y. Feng, Macromolecules, 2014, 47, 6740–6747 CrossRef CAS.
- C. Morandi, R. Peach, H. Krieg and J. Kerres, J. Mater. Chem. A, 2014, 3, 1110–1120 RSC.
- J. Ponce-gonzález, D. K. Whelligan, L. Wang, R. Bancesoualhi, Y. Wang, Y. Peng, H. Peng, D. C. Apperley, H. N. Sarode and T. P. Pandey, Energy Environ. Sci., 2016, 9, 3724–3735 RSC.
- J. Wang, S. Li and S. Zhang, Macromolecules, 2010, 43, 3890–3896 CrossRef CAS.
- J. Wang, C. Zhao, H. Lin, G. Zhang, Y. Zhang, J. Ni, W. Ma and H. Na, J. Power Sources, 2011, 196, 5432–5437 CrossRef CAS.
- J. Pang, S. Feng, Y. Yu, H. Zhang and Z. Jiang, Polym. Chem., 2014, 5, 1477–1486 RSC.
- B. Qiu, B. Lin, L. Qiu and F. Yan, J. Mater. Chem., 2011, 22, 1040–1045 RSC.
- B. Qiu, B. Lin, Z. Si, L. Qiu, F. Chu, J. Zhao and Y. Feng, J. Power Sources, 2012, 217, 329–335 CrossRef CAS.
- L. Liu, J. Ahlfield, A. Tricker, D. Chu and P. Kohl, J. Mater. Chem. A, 2016, 4, 16233–16244 RSC.
- B. Wang, W. Sun, F. Bu, X. Li, N. Hui and C. Zhao, Int. J. Hydrogen Energy, 2016, 41, 3102–3112 CrossRef CAS.
- X. Shuai, Z. Gang, Z. Yang, C. Zhao, W. Ma, H. Sun, Z. Na, L. Zhang, J. Hao and N. Hui, J. Power Sources, 2012, 209, 228–235 CrossRef.
- J. Wang, X. Wang, D. Zu, H. Yang, L. Yan, S. Yang, H. Wei and Y. Ding, J. Membr. Sci., 2017, 545, 116–125 CrossRef.
- M. Irfan, E. Bakangura, N. U. Afsar, M. M. Hossain, J. Ran and T. Xu, J. Power Sources, 2017, 355, 171–180 CrossRef CAS.
- A. Le Mong and D. Kim, Electrochim. Acta, 2018, 290, 544–555 CrossRef CAS.
- L. Hai, K. Kim and B. S. Pivovar, J. Phys. Chem. C, 2012, 116, 9419–9426 CrossRef.
- S. A. Nunez, C. Capparelli and M. A. Hickner, Chem. Mater., 2016, 28, 2589–2598 CrossRef CAS.
- A. D. Mohanty and C. Bae, J. Mater. Chem. A, 2014, 2, 17314–17320 RSC.
- A. Christopher G and R. Vijay, Proc. Natl. Acad. Sci. U. S. A., 2013, 110, 2490–2495 CrossRef PubMed.
- S. Zhe, P. Ji, J. Guo and Y. Feng, Adv. Sci., 2018, 5, 1800065 CrossRef PubMed.
Footnote |
| † Electronic supplementary information (ESI) available. See DOI: 10.1039/c8ra09840a |
|
| This journal is © The Royal Society of Chemistry 2019 |
Click here to see how this site uses Cookies. View our privacy policy here. 
 Open Access Article
 This Open Access Article is licensed under a Creative Commons Attribution-Non Commercial 3.0 Unported Licence
 *a
*a