
 Open Access Article
 This Open Access Article is licensed under a Creative Commons Attribution-Non Commercial 3.0 Unported Licence
Designing indacenodithiophene based non-fullerene acceptors with a donor–acceptor combined bridge for organic solar cells†
Muhammad Ans a,
Khurshid Ayubb,
Ijaz Ahmad Bhattia and
Javed Iqbal*ac
a,
Khurshid Ayubb,
Ijaz Ahmad Bhattia and
Javed Iqbal*ac
aDepartment of Chemistry, University of Agriculture Faisalabad, 38000, Faisalabad, Pakistan. E-mail: ansbhatti24@gmail.com; javedkhattak79@gmail.com; Javed.iqbal@uaf.edu.pk
bDepartment of Chemistry, COMSAT University, Abbottabad Campus, Abbottabad, KPK 22060, Pakistan
cPunjab Bio-energy Institute, University of Agriculture, Faisalabad, 38040, Pakistan
First published on 28th January 2019
Abstract
Non-fullerene small acceptor molecules have gained significant attention for application in organic solar cells owing to their advantages over fullerene based acceptors. Efforts are continuously being made to design novel acceptors with greater efficiencies. Here, optoelectronic properties of four novel acceptor–donor–acceptor (A–D–A) type small molecules (A1, A2, A3 and A4) were studied for their applications in organic solar cells. These molecules contain an indacenodithiophene central core unit joined to different end capped acceptors through a monofluoro substituted benzothiadiazole (FBT) donor acceptor (DA) bridge. The different end capped acceptor groups are; 2-2(2-ethylidene-5,6-difluoro-3-oxo-2,3-dihydroinden-1-ylidene)malononitrile (A1), 2-2(2-ethylidene-3-oxo-2,3-dihydroinden-1-ylidene)malononitrile (A2), 2-(5-ethylidene-6-oxo-5,6-dihydrocyclopenta-b-thiophene-4-ylidene)malononitrile (A3), and 2-2(2-ethylidene-5,6-dicyano-3-oxo-2,3-dihydroinden-1-ylidene)malononitrile (A4). The calculated optoelectronic properties of the designed molecules were compared with a well-known reference compound R, which was recently synthesized and reported as being an excellent A–D–A type acceptor molecule. All designed molecules showed the appropriate frontier molecular orbital diagram for a charge transfer. A4 shows the highest absorption maximum (λmax) of 858.6 nm (in chloroform solvent), which was attributed to the strong electron withdrawing end-capped acceptor group. Among all of the designed molecules, A3 exhibits the highest open circuit voltages (Voc) which was (1.84 V) with PTB7-Th and (1.76 V) with the P3HT donor polymer. Owing to a lower value of λe with respect to λh, the designed molecules demonstrated superior electron mobilities when compared with reference R. Among all of the molecules, A4 shows the highest electron mobility owing to the lower value of λe compared to R.
1. Introduction
One of the major problems faced today across the globe is an energy crisis. Non-renewable energy sources have been used since ancient times. These energy sources are not only vanishing quickly but also have adverse effects on the environment upon combustion. Many alternative sources such as wind power, hydro power, biomass, and solar cells have gained significant attention in energy conversion devices. Among these, solar cells are quite important owing to the abundance of sunlight available. Solar cells convert sunlight directly into electricity by the photoelectric effect. In the past, silicon was widely used as a semiconducting material in solar cells owing to the high thermal stability, large natural abundance, reduced toxicity and high power conversion efficiency (PCE). However, there are some limitations associated with silicon such as the high cost, hardness and non-tunable energy levels. Recently, organic solar cells have emerged as a low cost alternative to silicon based solar cells. The organic solar cells offer tunable energy levels, solution processability, transparency, a large area of fabrication and flexibility.1–5 In bulk heterojunction (BHJ) organic solar cells, power conversion efficiencies (PCEs) of 11–12% have been achieved using fullerene acceptor based (PC61BM and PC71BM) solar cells.6–9 Fullerene derivatives have excellent properties such as a high electron mobility, isotropic charge transfer, low reorganization energy and so forth.10,11 Despite these advantages, the use of fullerenes in solar cells is limited owing to several factors, such as difficulty in tuning the energy level, weak absorption in the visible region, instability, poor solubility, and high production cost.12–16 To overcome the limitations of fullerene, researchers are focusing on designing solar cells based on non-fullerene acceptors. Non-fullerene electron acceptors have many advantages such as good solubility, strong absorption in the visible region, and tunable energy levels.17–19 Recently, two important classes of non-fullerene acceptors have been studied such as the perylene diimide (PDI)20–22 based acceptor and fused ring electron acceptors (FREAs).23–41 Many three dimensional (3D) and helical shaped acceptors based on PDI have been reported to have PCEs up to 9% in organic solar cells.20–22 FREAs such as ITIC contain a indacenodithienothiophene fused core ring, and 2-(3-oxo-2,3-dihydroinden-1-ylidene)malononitrile (INCN) as an end capped acceptor unit. ITIC has gained significant attention owing to its strong absorption in the visible region, high charge mobility, easy purification process and tunable energy levels. At present, a PCE of over 13% can be obtained with FREAs, much higher than the PCEs obtained using a fullerene based acceptor.35,36The benzothiadiazole (BT) unit is also used to design novel small molecules acceptors (SMAs) to obtain a high PCE. BT unit based molecules show a high LUMO (lowest unoccupied molecular orbital) value. In different acceptors, the BT unit is used as a π-bridge between the electron donor (D) and the terminal end capped acceptor group with a linear structure. McCulloch and co-workers first synthesized BT based SMAs (A1–A2–D–A2–A1) namely FBR, in which fluorene was chosen as the electron donor group.12 This acceptor, when combined with the well-known donor polymer P3HT, exhibits a PCE of 4.11%.42 Several derivatives of FBR have also been reported for use in organic solar cells, such as replacing the fluorene donor with a fused heterocyclic indacenodithiophene with a different alkyl phenyl side chain (IDT-2BR),37 3D spirobifluorene,39 or angular-shaped dithienonaphthalene (DTNR).43
Herein, we have designed four novel acceptor–donor–acceptor (A–D–A) type molecules, namely (A1, A2, A3, and A4) which have an indacenodithiophene central core unit joined to different end capped acceptors through a monofluoro substituted benzothiadiazole (FBT) donor acceptor (DA) bridge. The optoelectronic properties of the designed molecules were evaluated with respect to the reference molecule R,44 which was recently reported.
2. Computational details
All calculations were performed using the Gaussian 09 program45 and the results were visualized through the GaussView 5.0 program.46 The time dependent density functional theory (TD-DFT) calculations were performed for the reference compound R with five functionals (ωB97XD,47 CAM-B3LYP,48 B3LYP,49 M06-2X,50 and MPW1PW91 (ref. 51)) at a 6-31G(d,p) basis set in order to simulate the absorption spectrum. For the validation of the theoretical method, the maximum absorption (λmax) of reference compound R was compared with the experimental data. Functional MPW1PW91 with the 6-31G(d,p) level of theory shows the best agreement with the experimental value, therefore this functional was used for further calculations.The λmax of all molecules were calculated in the gas and solvent phase. The integral equation formalism polarizable continuum model (IEFPCM)52 model was used to account for the solvent effect. Origin 6.0 program was used for the spectra plotting.53 The charge transfer, reorganization energies, frontier orbitals and density of states (DOS) calculations were performed at the MPW1PW91/6-31G(d,p) level of theory. Mulliken charges for all of the designed molecules were also performed using the same selected functional and are summarized in the ESI.† Furthermore, the reorganization energies of all of the designed molecules (A1 to A4) including reference R were estimated at the MPW1PW91/6-31G(d,p) level of theory. The reorganization energy was divided into two major parts: internal reorganization energy (λint.) and external reorganization energy (λext.). The external reorganization deals with the external environmental relaxation, whereas the internal reorganization energy deals with quick changes in the internal structure.
Here, we neglected the external environmental effect in our study and discuss only the internal reorganization energy. Hence, the reorganization energy of the electron (λe) and hole (λh) are calculated by using the following equations.
| λe = [E0− − E−] + [E0− − E0] | (1) |
| λh = [E0+ − E+] + [E0+ − E0] | (2) |
3. Results and discussion
In the current study, different functionals including (MPW1PW91, ωB97XD, CAM-B3LYP, M06-2, and B3LYP) at a 6-31G(d,p) basis set were used for the estimation of the opto-electronic properties of the reference compound R. The maximum absorption (λmax) values for compound R with MPW1PW91, ωB97XD, CAM-B3LYP, B3LYP, and M06-2X, functionals at the 6-31G(d,p) basis set are 714.27, 530.13, 536.04, 775.45, and 532.72 nm, respectively, while the reported experimental value is 740 nm (Fig. 1).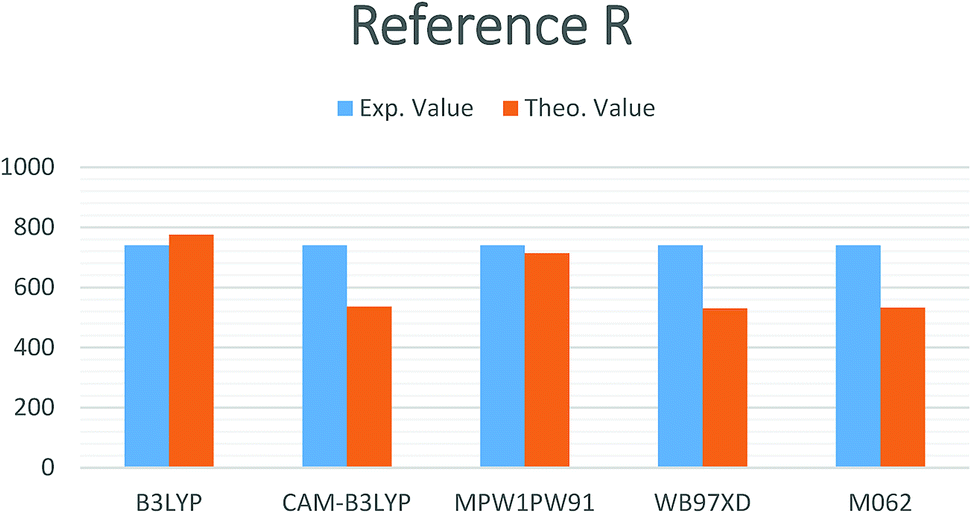 | ||
| Fig. 1 Simulated bar chart for reference R with the B3LYP, CAM-B3LYP, MPW1PW91, ωB97XD and M06-2X at 6-31G(d,p) level of theory. | ||
It is quite obvious that the MPW1PW91/6-31G(d,p) level of theory shows best agreement with the experiments and provides justification for its use in further calculation.
3.1. Frontier molecular orbital diagram
The molecular structures of the reference R and designed molecules (A1, A2, A3 and A4) are shown in Fig. 2.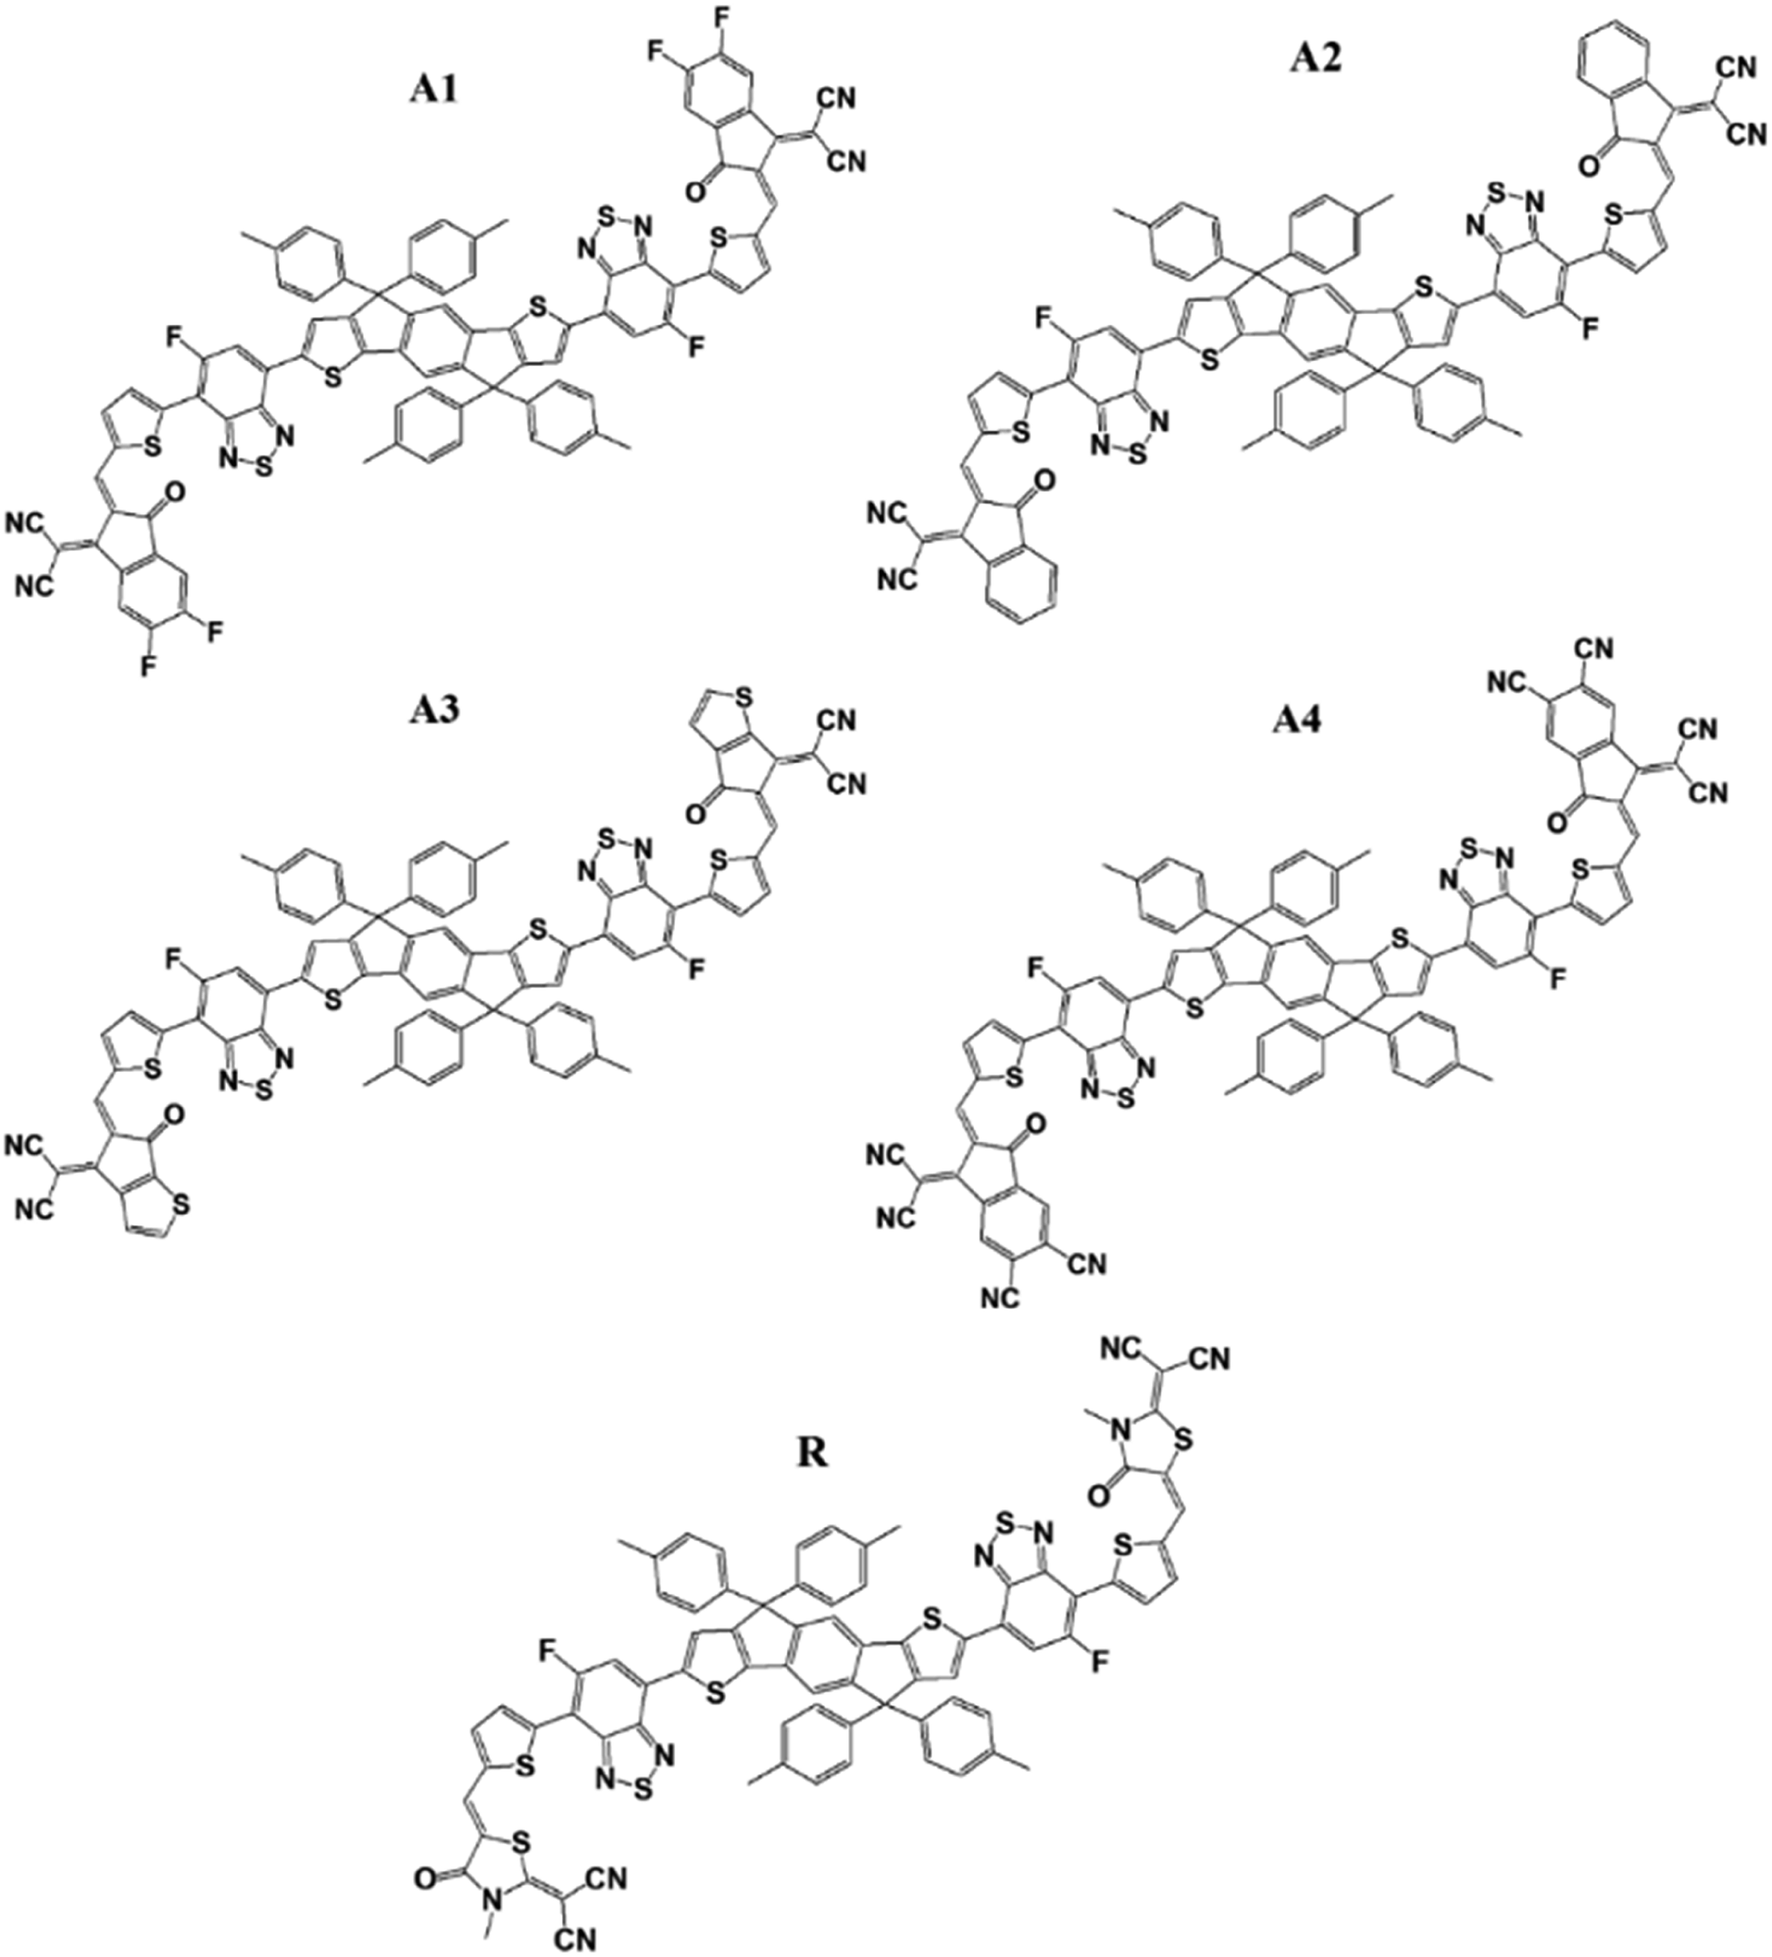 | ||
| Fig. 2 Molecular structures of reference R and the designed molecules of A1, A2, A3, and A4. | ||
The optimized geometries of reference R and the designed molecules (A1, A2, A3, and A4) at the MPW1PW91/6-31G(d,p) level of theory are shown in Fig. 3. The calculated Mulliken charges of all of the molecules are shown in the ESI Fig. S1.† The acceptor, bridge and donor exist in one plane in the optimized geometry while branches on the donor are perpendicular to the plane.
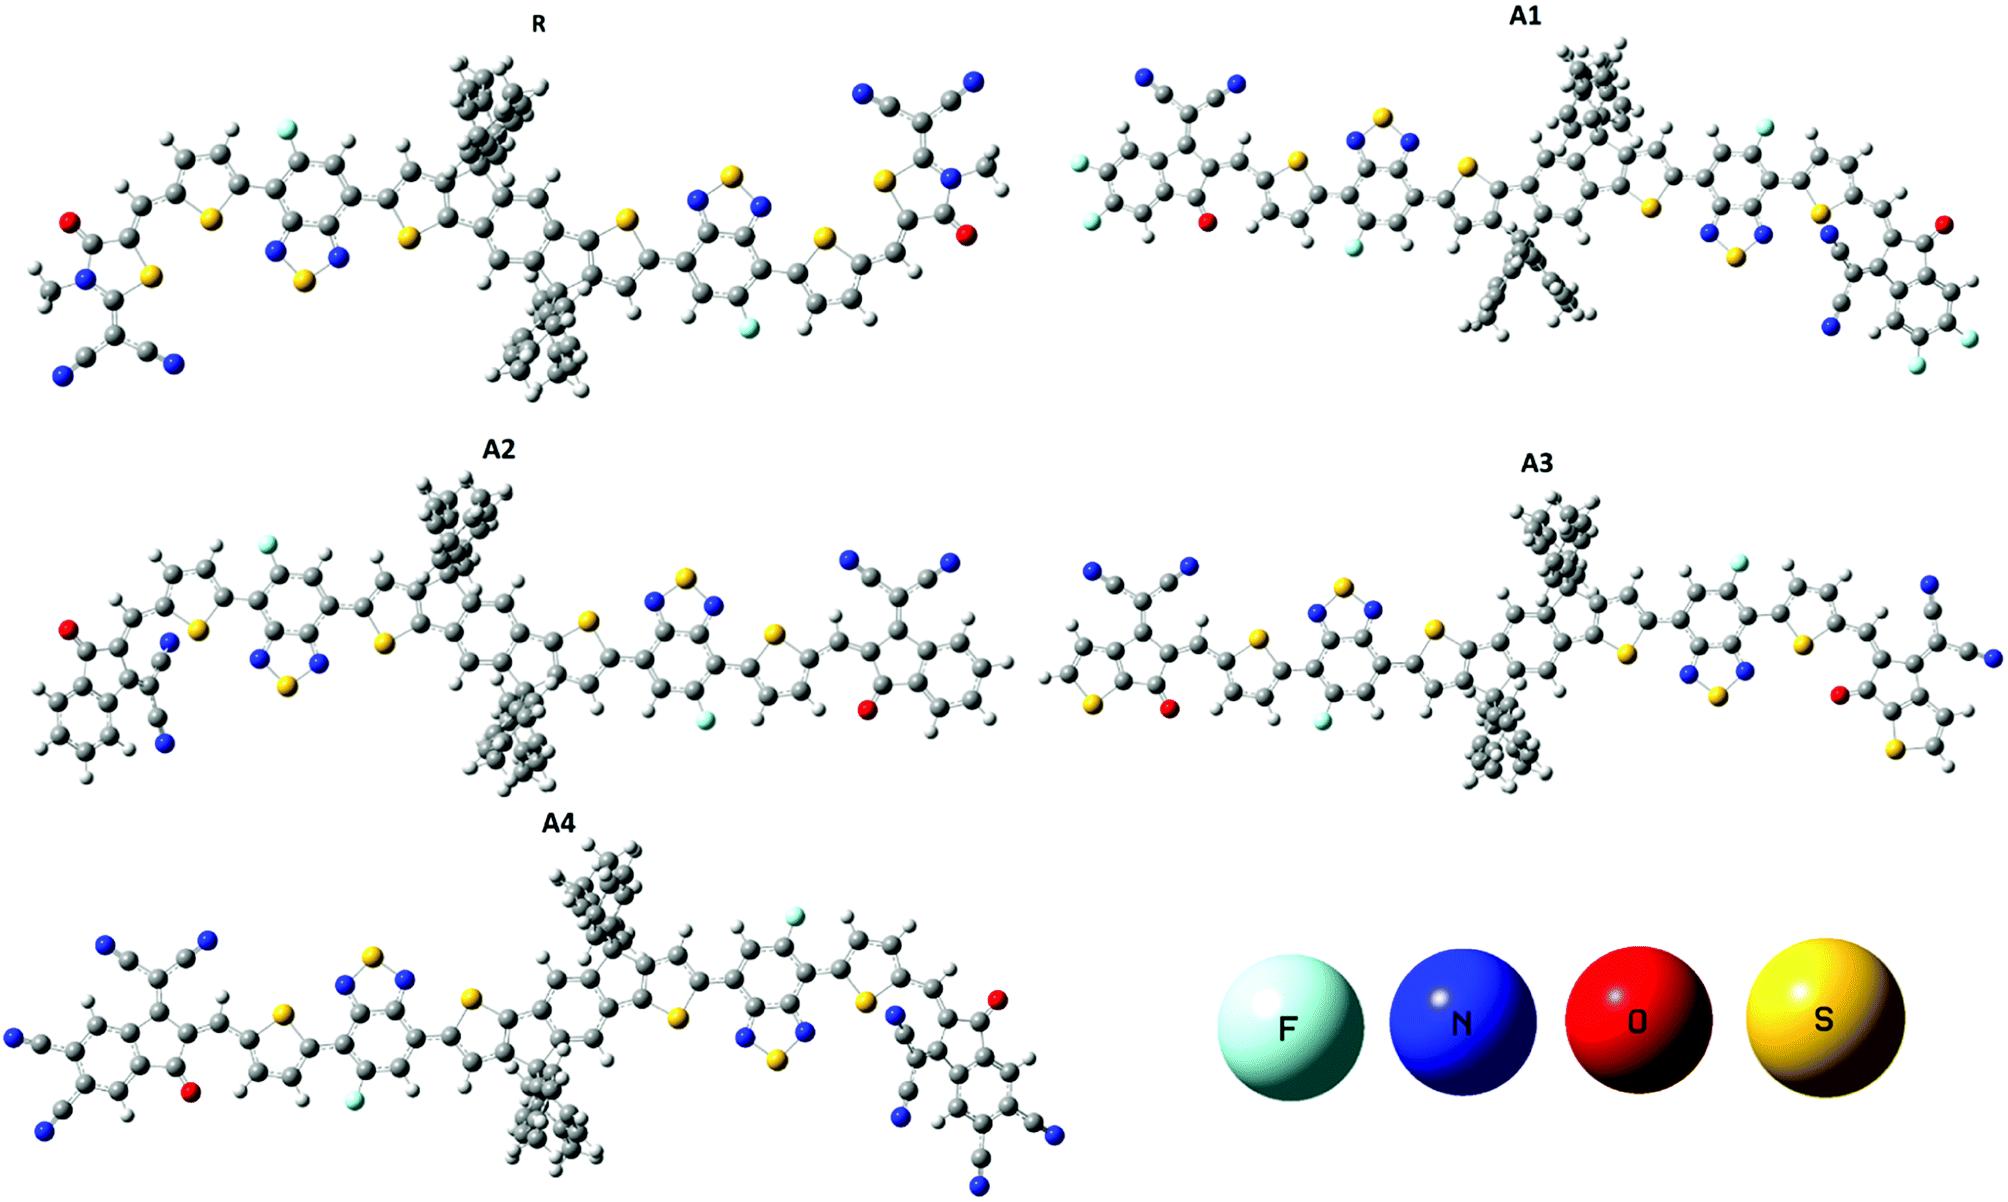 | ||
| Fig. 3 Optimized geometries of reference R and designed molecules (A1, A2, A3 and A4) at the MPW1PW91/6-31G(d,p) level of theory. | ||
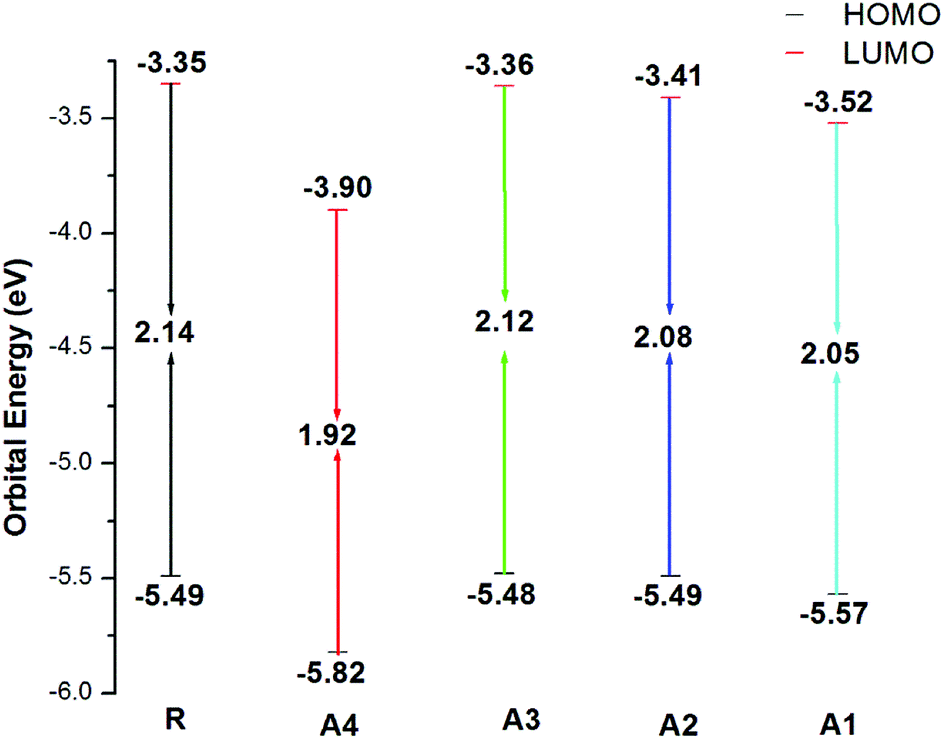
Frontier molecular orbital (FMO) diagrams are a key point used to discuss the opto-electronic properties of Organic Solar Cells (OSCs). The FMO diagrams of all molecules at the MPW1PW91/6-31G(d,p) level of theory are illustrated in Fig. 4. FMO diagrams illustrate the distribution pattern of the electron density in the highest occupied molecular orbital (HOMO) and LUMO. The HOMO and LUMO orbitals energies of the reference compound R at MPW1PW91/6-31G(d,p) are −5.49 and −3.35 eV.
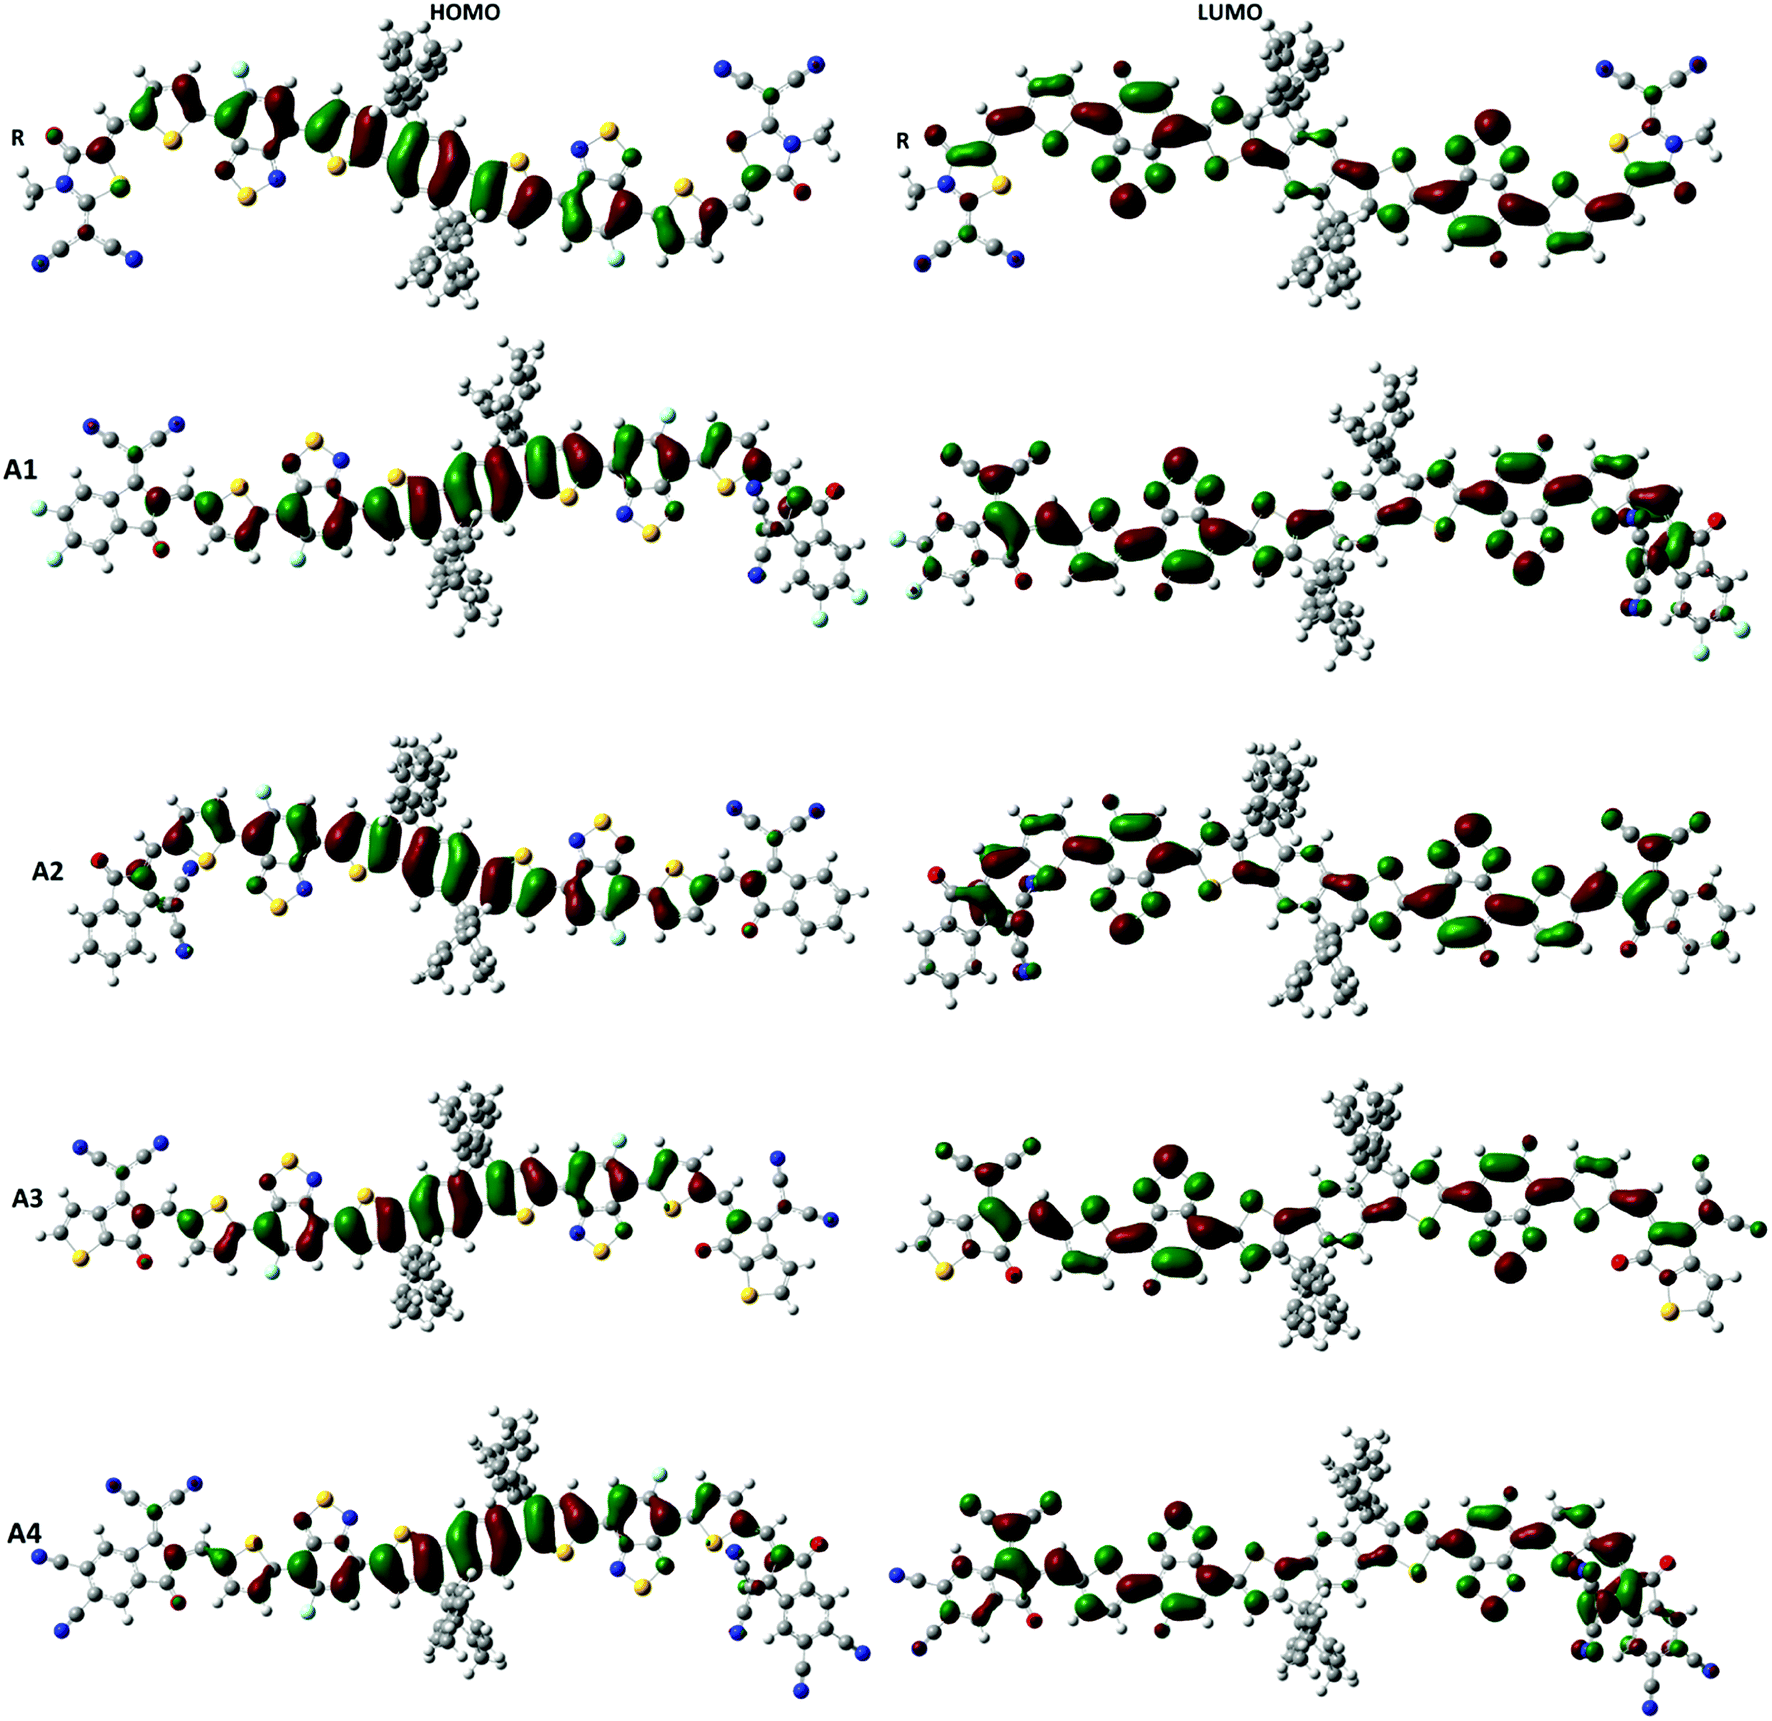 | ||
| Fig. 4 FMO diagrams of A1, A2, A3, A4 and reference R at the MPW1PW91/6-31G(d,p) level of theory. | ||
The HOMO energies of the designed molecules (A1, A2, A3 and A4) are −5.57 eV, −5.49 eV, −5.48 eV, and −5.82 eV, respectively, while the LUMO energies are −3.52 eV, −3.41 eV, −3.36 eV and −3.90 eV respectively. The HOMO–LUMO energy gaps of all of the molecules, A1, A2, A3 and A4, are 2.14 eV, 2.05 eV, 2.08 eV, 2.12 eV, and 1.92 eV respectively. The HOMO and LUMO energies along with their energy gaps are shown in Table 1.
| Molecules | EHOMO (eV) | ELUMO (eV) | Eg (eV) |
|---|---|---|---|
| a Eg = Energy band gap. | |||
| R | −5.49 | −3.35 | 2.14 |
| A1 | −5.57 | −3.52 | 2.05 |
| A2 | −5.49 | −3.41 | 2.08 |
| A3 | −5.48 | −3.36 | 2.12 |
| A4 | −5.82 | −3.90 | 1.92 |
A4 has the lowest HOMO and LUMO values among all of the designed molecules (A1, A2, and A3) including reference R, which is attributed to the extended conjugation in the 2-2(2-ethylidene-5,6-dicyano-3-oxo-2,3-dihydroinden-1-ylidene)malononitrile end-capped acceptor group. In the case of A1, the HOMO and LUMO values are lower than A2 and A3 owing to the fluoro substitution in the end capped group 2-2(2-ethylidene-5,6-difluoro-3-oxo-2,3-dihydroinden-1-ylidene)malononitrile. The HOMO and LUMO energies of A1 are higher than A4 because the cyano group has a greater withdrawing effect with respect to fluorine.
The energy of HOMO of A2 is equal to that of the reference R, but the LUMO of A2 is more stabilized which results in a lower HOMO–LUMO gap in A2. Finally, A3 and A2 have a comparable HOMO energy level while A2 has a more stabilized LUMO value mainly due to electron withdrawing effect of 2-2(2-ethylidene-3-oxo-2,3-dihydroinden-1-ylidene)malononitrile in A2. The order of the HOMO values for all of the molecules are A3 > R = A2 > A1 > A4, while the order of the LUMO energies are R > A3 > A2 > A1 > A4.
The energy gap (Eg) is very important factor for charge transfer. The lower the energy gap, the higher the charge transfer rate. In our study, all of the designed molecules have a lower energy gap with respect to reference R. Hence, our designed molecules have better opto-electronic properties than R. The energy gaps of all of the molecules are in range of 1.92 to 2.14 eV. The Eg value of reference compound R is 2.14 eV. The energy gaps of the designed molecules A1, A2, A3, and A4 are 2.05, 2.08, 2.12, and 1.92 eV, respectively. Among all of the designed molecules, A4 (1.92 eV) has the lowest energy gap value owing to the extended conjugation combined with the electron withdrawing end-capped acceptor moiety. A1 has a higher energy gap value with respect to A4 owing to the reduced electron withdrawing effect of 2-2(2-ethylidene-5,6-difluoro-3-oxo-2,3-dihydroinden-1-ylidene)malononitrile compared to 2-2(2-ethylidene-5,6-dicyano-3-oxo-2,3-dihydroinden-1-ylidene)malononitrile. Similarly, A2 has a higher energy gap than A1 and A4 but it is lower than R owing to the weak effect of 2-2(2-ethylidene-3-oxo-2,3-dihydroinden-1-ylidene)malononitrile. Finally, A3 has a higher energy gap with respect to (A1, A2 and A4) owing to a reduced extended conjugation between the end-capped acceptor groups. The energy gap decreases in the order A4 < A1 < A2 < A3 < R. The HOMO–LUMO values and their energy gaps are expressed in Fig. 5.
 | ||
| Fig. 5 HOMO–LUMO values of the designed molecules A1, A2, A3, A4 and the reference molecule R at the MPW1PW91/6-31G(d,p) level of theory. | ||
To further support the FMO diagram (Fig. 4), a partial density of states (PDOS) analysis of the designed molecules (A1–A4) and reference R at the MPW1PW91/6-31G(d,p) level of theory was performed. DOS spectra of all of the molecules are shown in Fig. 6. It is clearly seen that the electron withdrawing effect of the end-capped acceptor group changes the distribution pattern around the HOMO and LUMO. The HOMO electron density of reference compound R is mainly spread on the donor part and donor–acceptor bridge, while the LUMO density is spread uniformly on the entire molecule with a little bit on the acceptor group. In the case of A1, the HOMO density is spread mainly on the donor as well as on the bridge group while the lowest unoccupied molecular orbitals (LUMOs) are distributed equally on the donor, acceptor part and little bit on the end-capped acceptor group. The distribution pattern of A2 resembles, to some extent, A1, the highest occupied molecular orbitals (HOMOs) are mainly spread on the donor and bridge unit, while the LUMOs are spread on the donor, bridge unit, and a bit on the end-capped acceptor group. The HOMOs of all of the molecules are mainly on the donor while the LUMOs are mainly on the bridge as well as on the end capped acceptor groups.
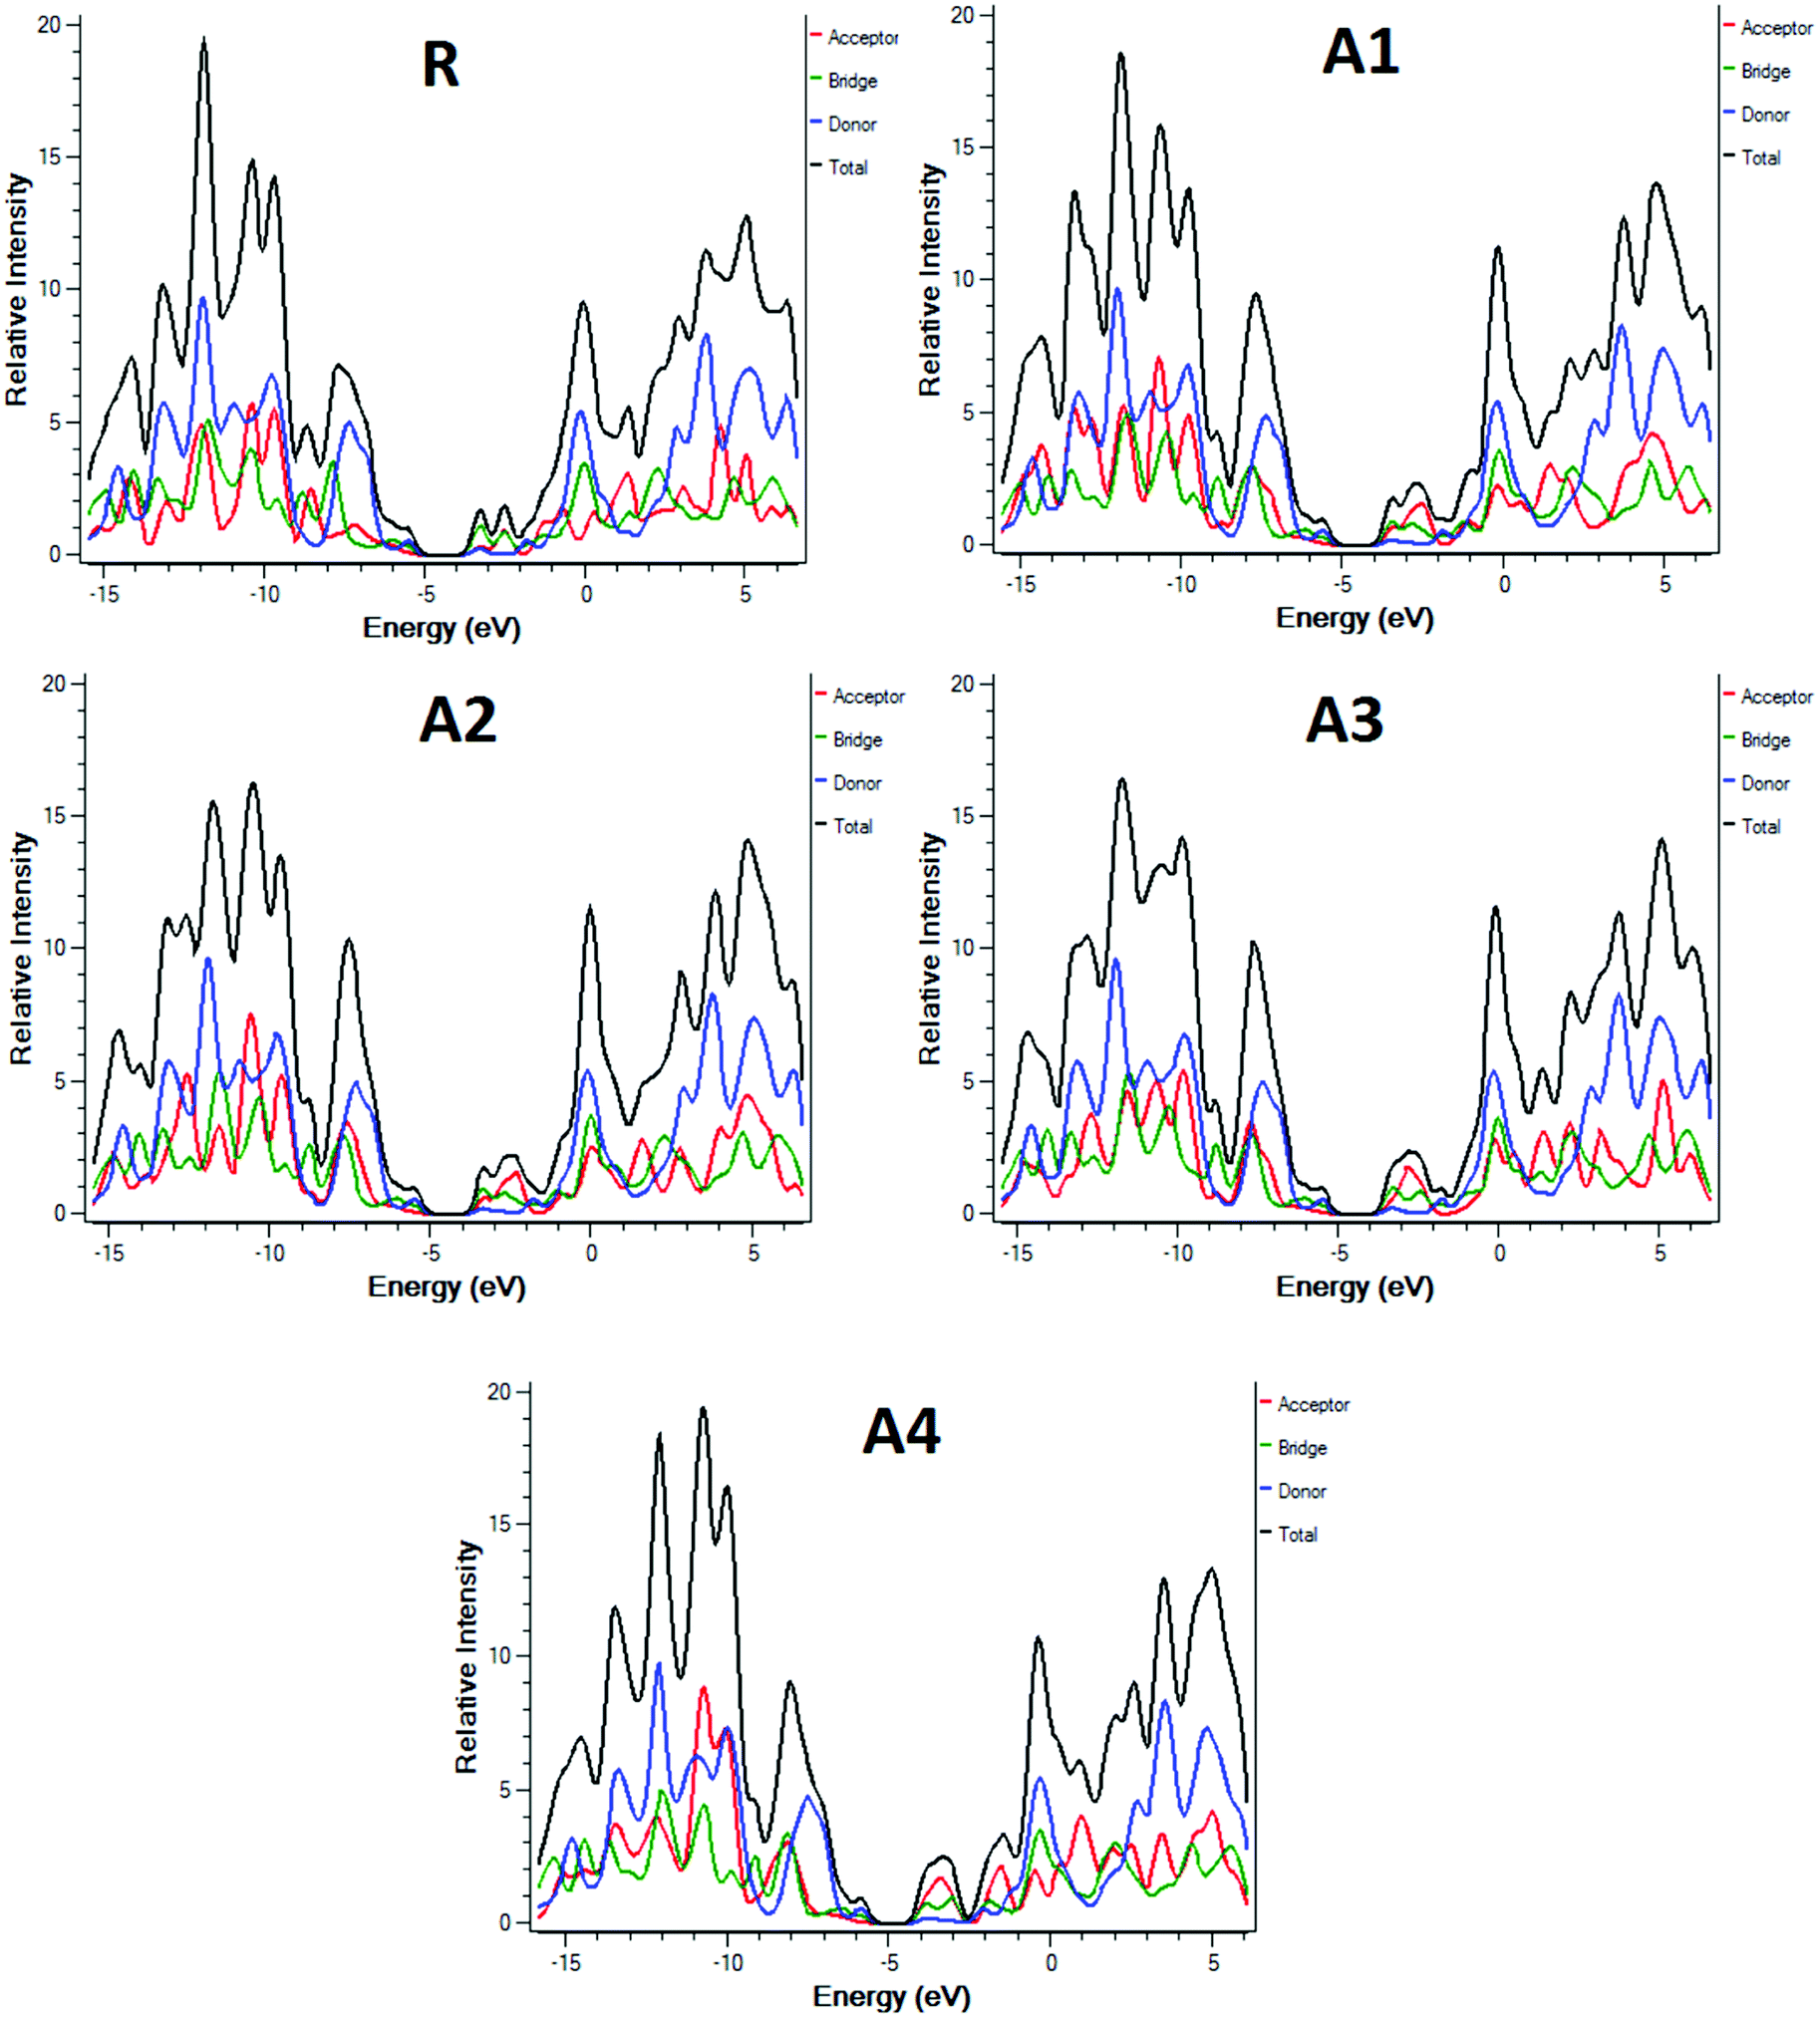 | ||
| Fig. 6 DOS around the HOMOs and LUMO of reference R and the designed molecules A1, A2, A3, A4 at the MPW1PW91/6-31G(d,p) level of theory. | ||
The distribution pattern for the HOMOs of A3 and A4 are quite similar. Both have electron densities on the donor as well as on the bridge unit without an end-capped acceptor moiety, but the pattern of density distribution in the LUMOs is quite different, A4 has a greater LUMOs distribution on the end-capped acceptor group while A3 has only a little bit.
4. Optical properties
The UV/Visible absorption spectra were computed at the MPW1PW91/6-31G(d,p) level of theory in the gas phase and in solvent (chloroform) to illustrate the optical properties of the designed molecule (A1–A4), see Tables 2 and 3. The maximum absorption λmax, oscillator strength (f), excitation energy, dipole moment and assignment, in the gaseous phase are shown in Table 2.| Molecules | Calculated λmax (nm) | Exp. λmax (nm) | Ex (eV) | f (oscillator strength) | Assignment | Dipole moment (D) |
|---|---|---|---|---|---|---|
| R | 714.3 | 740 (ref. 44) | 1.74 | 2.73 | H > L (+95%) | 0.063 |
| A1 | 745.5 | — | 1.66 | 2.99 | H > L (+94%) | 4.725 |
| A2 | 736.1 | — | 1.68 | 2.98 | H > L (+94%) | 5.885 |
| A3 | 720.4 | — | 1.72 | 3.17 | H > L (+95%) | 6.701 |
| A4 | 789.8 | — | 1.57 | 3.03 | H > L (+94%) | 9.282 |
| Molecules | Calculated λmax (nm) | Expected λmax (nm) | Ex (eV) | f (Oscillator strength) | Assignment | Dipole moment (D) |
|---|---|---|---|---|---|---|
| R | 742.8 | 740 (ref. 44) | 1.67 | 3.01 | H > L (+94%) | 0.176 |
| A1 | 797.2 | — | 1.56 | 3.20 | H > L (+93%) | 5.716 |
| A2 | 784.6 | — | 1.58 | 3.23 | H > L (+93%) | 6.740 |
| A3 | 776.9 | — | 1.60 | 3.57 | H > L (+92%) | 8.489 |
| A4 | 858.6 | — | 1.44 | 3.24 | H > L (+92%) | 11.17 |
The results show that the strong electron withdrawing end capped groups with a more extended conjugation cause a greater red shift in the absorption spectra.54 The UV/Visible absorption of all of the molecules lie in the range of 714.3–789.8 nm. The λmax value of the reference compound R is 714.3 nm. The compounds A1–A4 have a higher red shift along with a higher oscillator strength as compared to reference R. The λmax values of A1, A2, A3, and A4 in the gas phase are shown in Table 2. Among all of the molecules, A4 exhibits a higher red shift and a lower energy gap owing to the extended conjugation of the 2-2(2-ethylidene-5,6-dicyano-3-oxo-2,3-dihydroinden-1-ylidene)malononitrile withdrawing end-capped acceptor moiety.
The λmax value of A1 is higher than that of R, A2 and A3 owing to the four fluoro groups which are attached to the end-capped acceptor groups. The λmax values of the designed molecules A1, A2, A3 and A4 are 31.2, 21.8, 6.1, and 75.5 nm, respectively, these are red shifted compared to the reference compound R in the gas phase. The order of compounds with respect to the increasing λmax values are R < A3 < A2 < A1 < A4 which is, as expected, the same as the order of the decreasing HOMO–LUMO band gap energy for the compounds. These results suggest that the λmax corresponds to the transition from the HOMO to LUMO which is consistent with the assignment given in Table 2. The simulated absorption spectra of A1–A4 and R are shown in Fig. 7. All of the novel designed molecules have lower exciton energies than that of the reference R, which reveals that excitation between HOMO to LUMO is easy. A4 contains a strong electron withdrawing end capped acceptor group which causes the lower excitation energy and a higher charge transport ability. The order of the excitation energy is R < A3 < A2 < A1 < A4. The same pattern is observed in the oscillator strength.
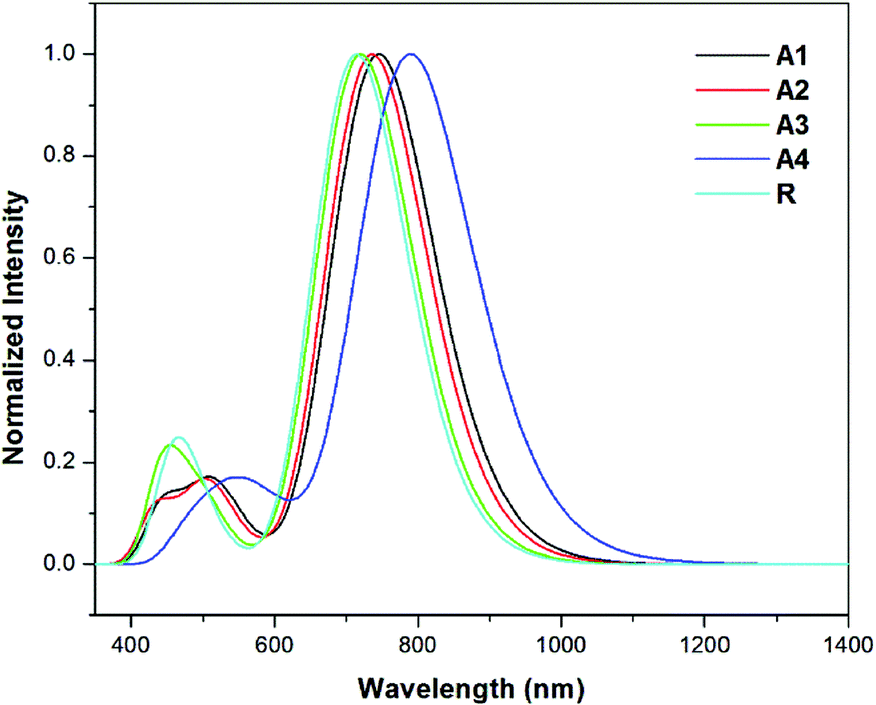 | ||
| Fig. 7 Simulated absorption spectra of the designed molecules (A1–A4) and reference R in the gas phase at the TD- MPW1PW91/6-31G(d,p) level of theory. | ||
The λmax values of reference R and the designed molecules (A1–A4) in chloroform solvent using the IEFPCM were calculated (see Table 3). The λmax values in solution lie in the range of 742.8–858.6 nm.
The excitation energy from the HOMO to LUMO of all of the designed molecules are in the range of 1.67–1.44 eV. All newly designed molecules have lower excitation energies than the reference R, which reveals that excitation between HOMO to LUMO is easy. Lower exciton energy means higher charger transfer, which lead to high power conversion efficiency. Among all, four cyano group with end capped acceptor group in A4 enhance the absorption maximum. The order of excitation energy is R < A3 < A2 < A1 < A4, which is similar to absorption pattern. Same pattern observed in oscillator strength. On the basis of above discussion, all newly designed molecules have better absorption, excitation, and oscillator strength than that of reference R.
The λmax values in solvent show a similar pattern to that in the gas phase. The absorption maxima for reference compound R and the designed molecules A1, A2, A3 and A4 in chloroform are 742.8, 797.2, 784.6, 776.9 and 858.6 nm respectively. Hence, the absorption at the longest wavelength (858.6 nm) was found for A4 with strong oscillator strength. The red shifts from the vacuum to the chloroform solution for A1, A2, A3 and A4 are 54.4, 41.8, 34.1 and 115.8 nm, respectively. The simulated absorption spectra of A1–A4 and R in chloroform are shown in Fig. 8.
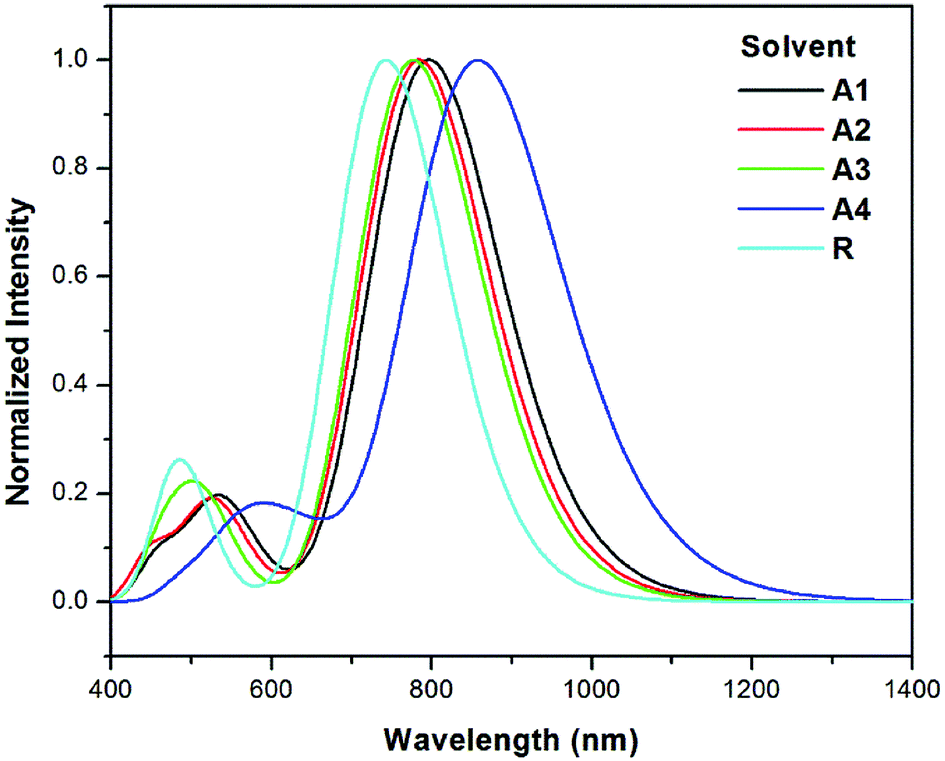 | ||
| Fig. 8 Simulated absorption spectra of designed molecules (A1–A4) and reference R in solvent (chloroform) at the TD- MPW1PW91/6-31G(d,p) level of theory. | ||
On the basis of the discussion above, all of the designed molecules have better optical properties than reference R. All four of the designed molecules have higher λmax values as compared to R and may therefore be superior to the reference molecule for use as non-fullerene SMAs.
5. Reorganization energy
Another tool to evaluate the performance of organic solar cells is reorganization energy (electron and hole), reorganization energy is linked with the charge mobilities. Reorganization energy and charge mobilities are in an inverse relationship; the lower the reorganization energy, the higher the charge mobilities. It depends on many factors, but is mainly influenced by the geometry of the cations and anions according to eqn (1) and (2). The anionic geometry indicates the electron transfer from the donor material, while the cationic geometry shows the hole in acceptor material. The overall reorganization can be used to calculate the charger transfer between the donor and acceptor unit. Reorganization is classified into two parts; internal reorganization energy (λint.) and external reorganization energy (λext.). The external reorganization deals with the polarization effect on the external environmental while the internal reorganization provides information on quick changes in the internal geometry. Here, we neglect the external environmental effects in our study and discuss only the internal reorganization energy. The reorganization energy of reference R including the designed molecules (A1–A4) were computed at the MPW1PW91/6-31G(d,p) level of theory. The calculated reorganization energies are expressed in Table 4.| Molecules | λe (eV)a | λh (eV) b | μgc | μed | μe − μg |
|---|---|---|---|---|---|
| a Reorganization energy of the electron.b Reorganization energy of the hole.c μg = Ground state.d μe = Excited state. | |||||
| R | 0.0064 | 0.0061 | 0.063 | 0.176 | 0.113 |
| A1 | 0.0063 | 0.0063 | 4.725 | 5.716 | 0.991 |
| A2 | 0.0063 | 0.0062 | 5.885 | 6.740 | 0.855 |
| A3 | 0.0062 | 0.0061 | 6.701 | 8.489 | 1.788 |
| A4 | 0.0048 | 0.0061 | 9.282 | 11.17 | 1.888 |
The λe value of reference compound R is 0.0064 eV. All of the novel designed molecules have a high electron mobility as compared to reference R, owing to the low reorganization energy value. Among the molecules, A4 has the lowest λe value, which means that A4 has the highest electron mobility between the donor and acceptor part. A1 and A2 have equal reorganization energies therefore, these two designed molecules have similar electron mobilities. The order of the electron mobility for the designed molecules is R < A1 = A2 < A3 < A4.
The reorganization energies for the hole of all of the designed molecules are also compared with the reference R. The λh value of reference compound is 0.0061 eV. The theoretical calculated λh values for A1, A2, A3 and A4 are 0.0063, 0.0062, 0.0061, and 0.0061 eV as shown in Table 4. A3 and A4 have equal λh values hence, these two acceptors have the same hole transport mobilities. The order of the hole mobilities of the designed molecules is R = A4 = A3 < A2 < A1.
6. Dipole moment
Another promising property is the dipole moment of all of the molecules which is calculated at the MPW1PW91/6-31G(d,p) level of theory. The crystallinity of organic solar cells can be enhanced by increasing the solubilities in organic solvents in both the ground and excited states. During fabrication of organic solar cells, the dipole moment is an important parameter. A high value for the dipole moment reveals a good solubility in organic solvents. The calculated dipole moments of reference compound R at the ground and excited state are 0.063 and 0.176 debye. The change in the dipole moment between the ground and excited state is 0.113 debye. The dipole moments of A1, A2, A3 and A4 in the gas phase are 4.72, 5.88, 6.70 and 9.28 D, respectively, as shown in Table 4.All of the designed molecules show a higher dipole moment with respect to the reference compound R. Therefore, the solubility of the novel designed molecules should be good in commonly used polar organic solvents (for BHJ organic solar cells such as chloroform and chlorobenzene) as compared to R, therefore it would give a reasonably good morphology of film. The changes in the dipole moment of A1, A2, A3 and A4 from the ground to excited state are 5.71, 6.74, 8.84 and 11.17 D, respectively. Among all of the molecules, A4 has the highest dipole moment which is due to the four electron withdrawing cyano groups which are attached to the end capped acceptor moiety. The dipole moment of A3 is higher than A1 and A2. The dipole moment of reference R and the designed molecules (A1–A4) calculated in a gaseous phase, as well as in solvent, are in order of A4 > A3 > A2 > A1 > R.
In BHJ organic solar cells, molecular fabrication (self-assembly) in film is greatly affected by the dipole moment of the material, as two dipoles arrange themselves in an antiparallel fashion to stimulate self-assembly and improve crystallinity.55 If the designed molecules have a packing ability then the high value of the dipole moment facilitates the self-assembly of the molecules, and also forms a long chain which provides a strong pathway for the charge mobilities. Therefore, the greater the dipole moment, the higher the charge mobilities. Furthermore, a higher dipole moment facilitates a reduction in the disorder between the donor and the acceptor, which increases the charge mobility between the donor acceptor. Moreover, it also reduces the charge recombination and thereby increases the fill factor (FF).56 The dipole moment at the ground state as well as in the excited state and their difference are shown in Table 4.
7. Open circuit voltage
The open circuit voltage (Voc) has a vital role in the performance of organic solar cells. It is the maximum amount of current which can be drawn from any optical device. The open circuit voltage is approximately proportional to the difference between the HOMO and LUMO energies of the donor and acceptor molecules, respectively. The LUMO energies of our designed acceptor molecules, including R, were aligned with the HOMO of the well-known donor polymer material PTB7-Th (EHOMO = −5.20 eV)57 in Fig. 9, and the HOMO of P3HT IS (EHOMO = −5.12 eV).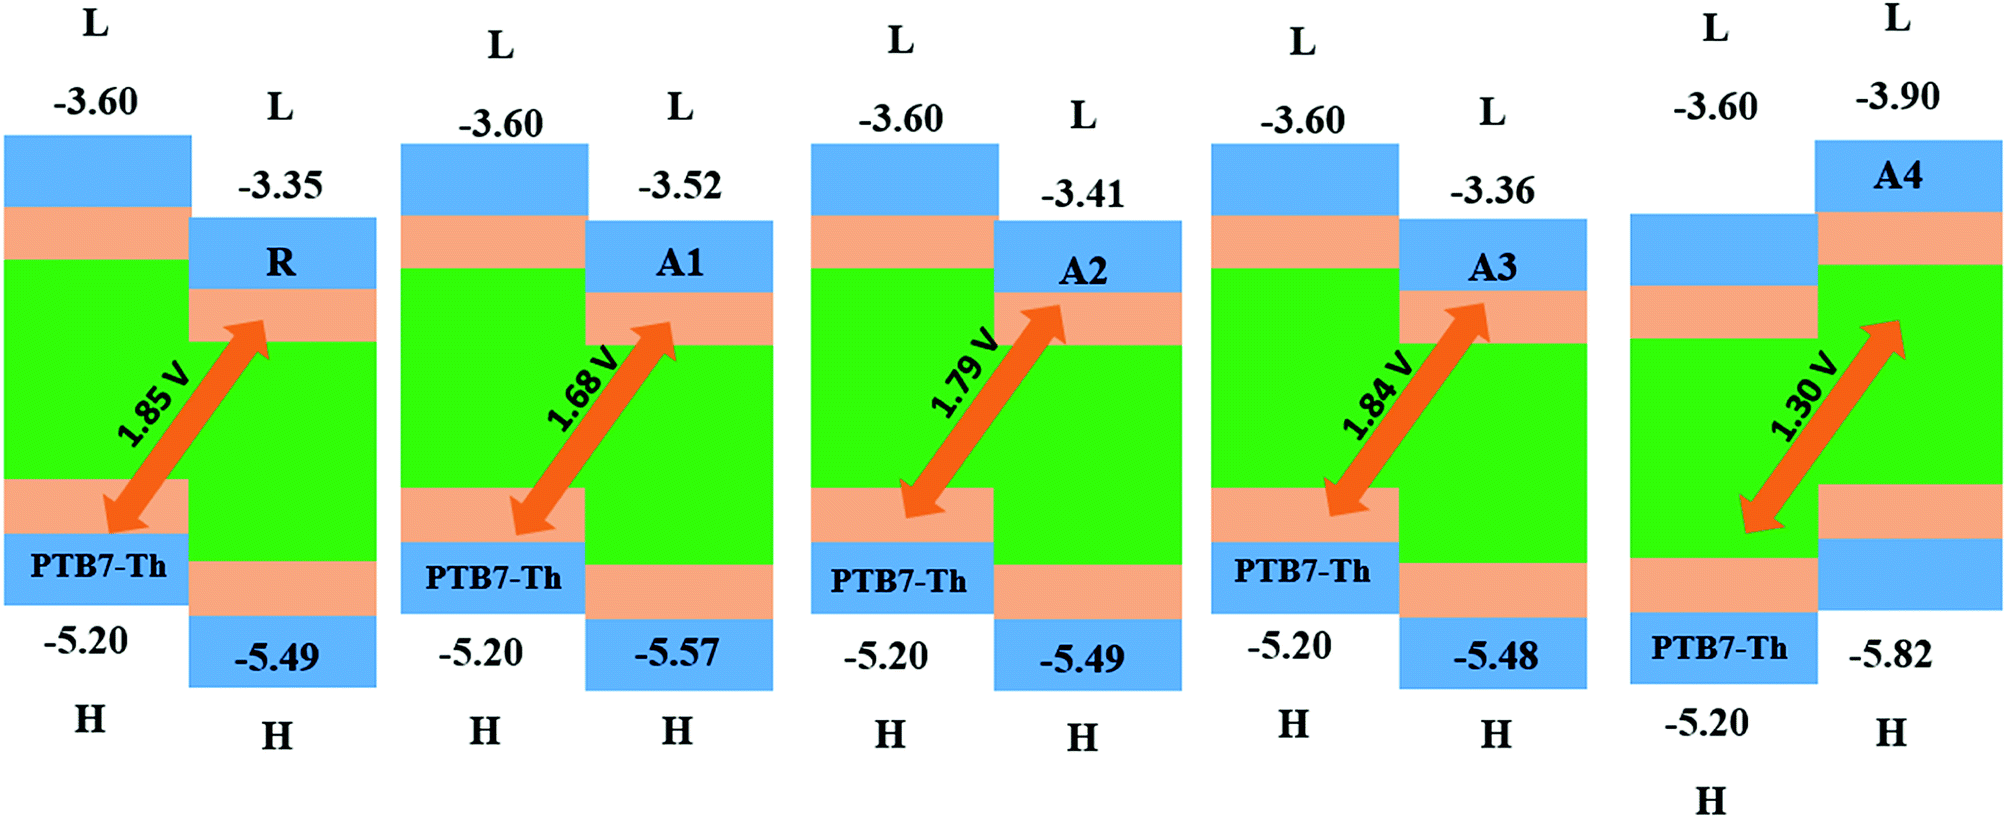 | ||
| Fig. 9 The Voc of reference R and the designed molecules A1, A2, A3 and A4 with respect to donor material PTB7-Th. | ||
The HOMOPTB7-Th–LUMOacceptor energy gap is 1.85, 1.68, 1.79, 1.60, and 1.30 V for R, A1, A2, A3 and A4, respectively. All of the novel designed molecules have comparable Voc with respect to the reference molecule R owing to the same difference between the HOMO of donor and the acceptor of the designed molecules. The energy gap of the HOMOdonor of P3HT and the LUMOacceptor of the reference and designed molecules (A1–A4) are 1.77, 1.60, 1.71, 1.76, and 1.22 V as shown in the ESI.† All of the designed molecules have a comparable Voc value with respect to reference R. Among all of the designed molecules, A2 exhibits a high Voc value. The order of Voc value with both donors (PTB7-Th and P3HT) is the same, which is R > A3 > A2 > A1 > A4.
A low lying LUMO for the acceptor moiety causes higher open circuit voltages and enhances the optoelectronic properties. A low lying LUMO orbital means that the electron can easily be transferred between the donors to the acceptor unit. In addition, the energy gap between the HOMO and LUMO is also important for the transition of electrons between the donors to the acceptor unit and enhances the PCE. Hence, the open circuit voltages are in the order of A4 < A1 < A2 < A3 < R.
8. Transition density matrix and exciton binding energy
The transition density matrixes (TDMs) of the designed molecules, including reference R, were computed to estimate the nature of the transition. The MPW1PW91/6-31G(d,p) level of theory was used to derive the absorption and emission of the S1 state in vacuum. In the present study, the effect of hydrogen atoms is neglected by default owing to their very small contributions in transitions. The transition density matrix enables us to evaluate: (i) the interaction between the donor and acceptor moieties with each other in the excited state; (ii) the electronic excitation; and (iii) the electron hole localization.58 To study it, we divided our molecules into D (donor core unit), B (combined bridge group), and A (end capped acceptors) parts. It is clear from the TDM diagrams (Fig. 10) that the electron coherence of R and A1–A4 is mainly on the diagonal of the donor and combine bridged and is small on the acceptor end-capped groups. Additionally, the coefficients of interaction between the donor and acceptor group is in the order of A4 < A1 < A2 < A3 < R. According to this sequence, the coupling of the hole and the electron of A4 may be lower with respect to the other four molecules, but it could show a higher and easier exciton dissociation in the excited state. The binding energy shows that the A4 molecule has the largest number of charges and may be easily dissociated into separated charges. Hence, the charge dissociation efficiency of A4 is higher than that obtained for the other molecules.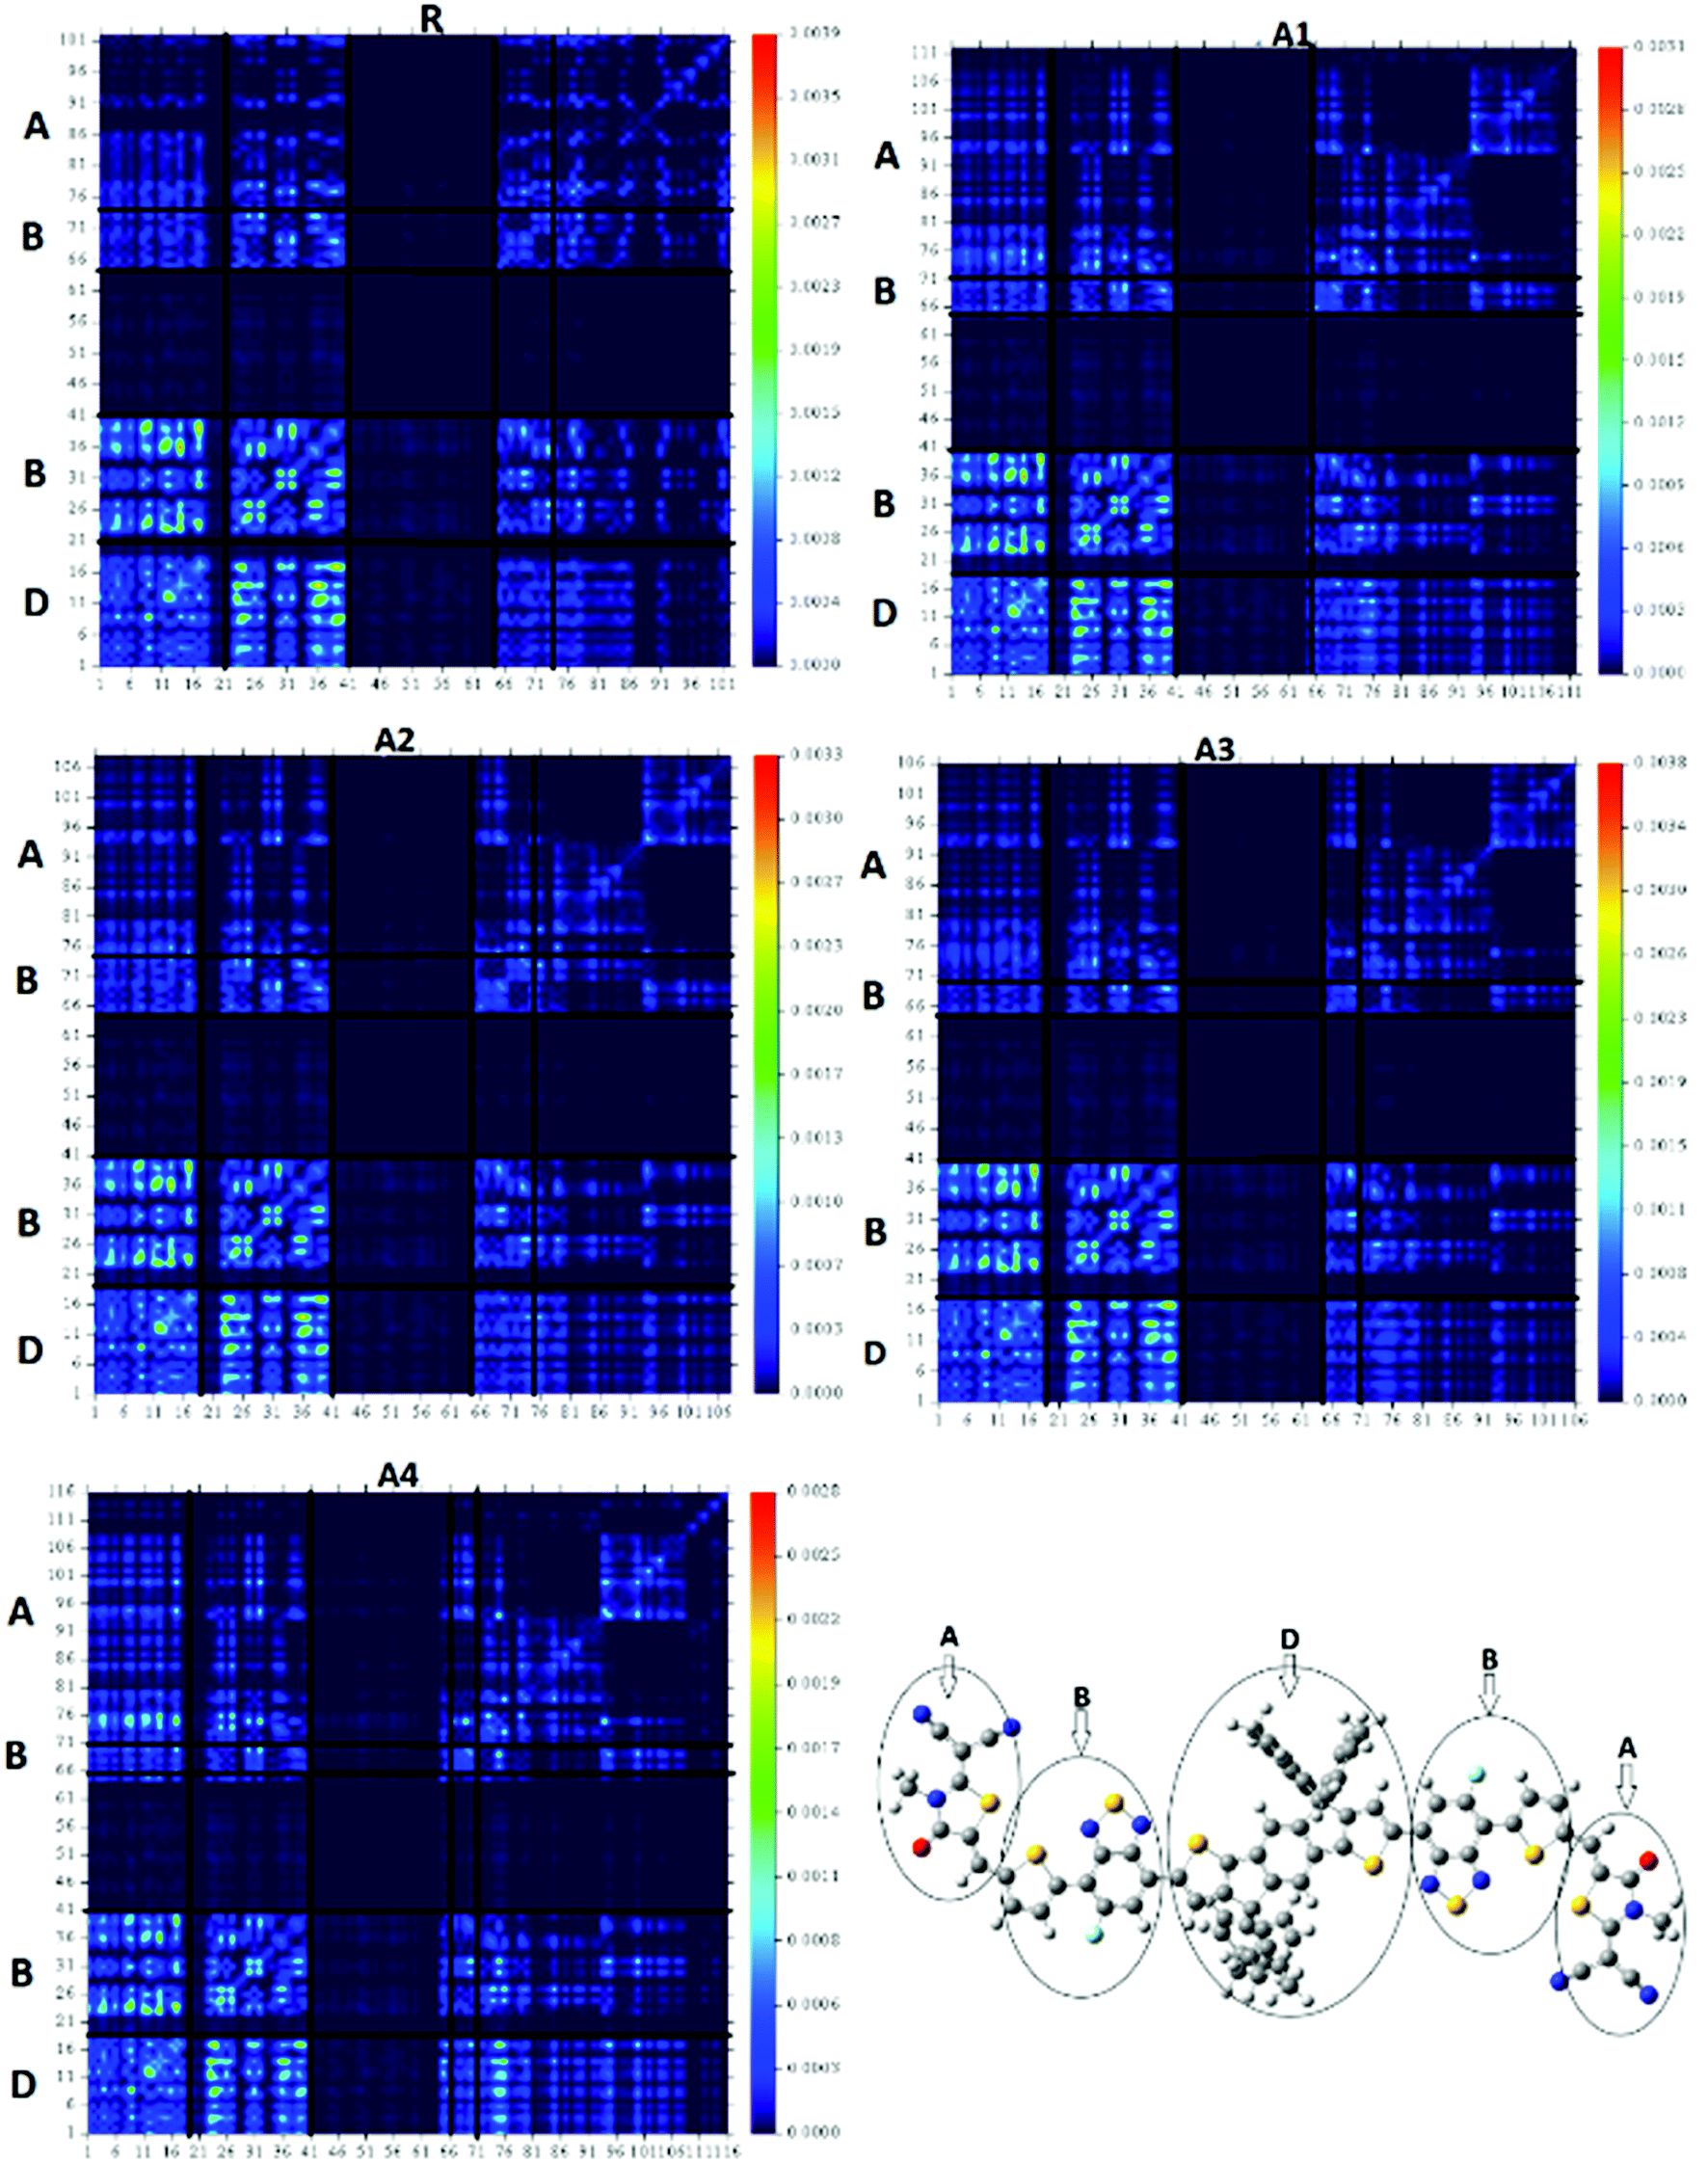 | ||
| Fig. 10 TDM of reference R and the designed molecules (A1–A4) in the S1 state. | ||
The four designed molecules show a higher charge dissociation ability with respect to R. This suggests that these molecules can increase the overall current charge density (Jsc) in comparison with R.
The binding energy is a promising factor in the performance evaluation of organic solar cells and helps the exciton dissociation potential. The binding energy of all molecules including reference compound R was also investigated. The binding energy is a concrete tool for measuring the interaction of the coulombic forces between the hole and the electron, in which a lower value for the binding energy corresponds to a lower coulombic interaction between the electron and the hole, which, in turn, can cause a higher degree of exciton dissociation in the excited state.
The binding energy (Eb) is the difference between the HOMO–LUMO energy gap EH–L and the minimum amount of energy required for the first excitation (Eopt). This is the first singlet excited state energy formed from S0 to S1 by producing pair of electron and hole.59–61 Eb can be calculate by using eqn (3).
| Eb = EH–L − Eopt | (3) |
The theoretical binding energies of R and A1–A4 are shown in Table 5
| Molecules | EH–L (eV) | Eopt (eV) | Eb (eV) |
|---|---|---|---|
| R | 2.14 | 1.730 | 0.41 |
| A1 | 2.05 | 1.663 | 0.387 |
| A2 | 2.08 | 1.684 | 0.396 |
| A3 | 2.12 | 1.721 | 0.399 |
| A4 | 1.92 | 1.560 | 0.360 |
The designed molecules all have a lower binding energy as compared to the reference molecule R. In addition, the order of the binding energies for the five molecules is A4 < A1 < A2 < A3 < R, which is in agreement with the TDM result.
9. Charge transfer analysis of acceptor A4 and polymer donor PTB7-Th
To obtain some information about the charge transfer (CT) between A4 and PTB7-Th, the complex was analyzed for CT analysis (Fig. 11). Among all of the molecules, the A4 molecule has a low reorganization energy and hence a high electron mobility, therefore the charge transfer between A4 and PTB7-Th was investigated.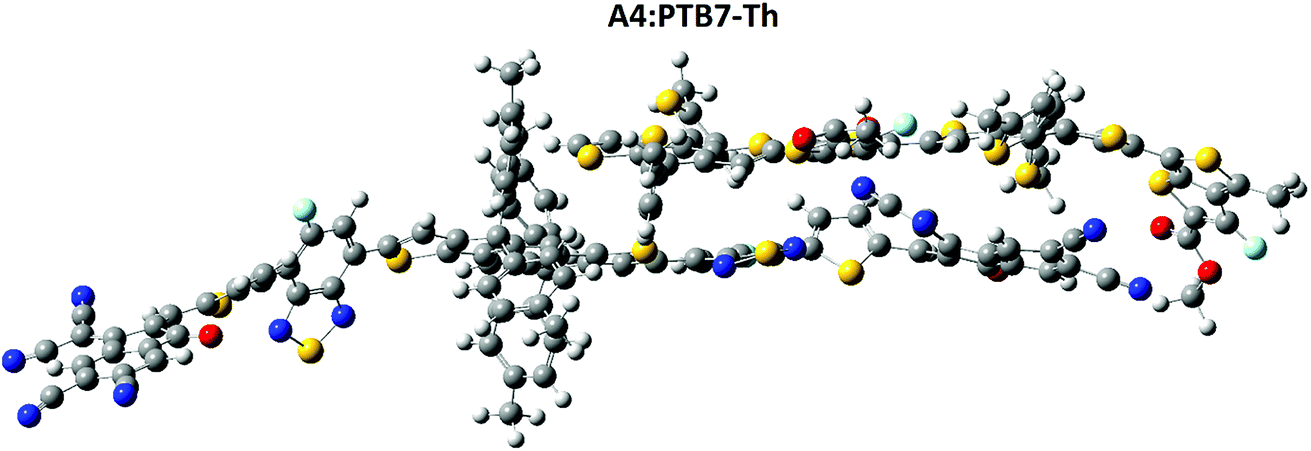 | ||
| Fig. 11 Charge transfer between A4 and PTB7-Th, the complex geometry was analyzed for charge transfer analysis at the MPW1PW91/6-31G(d,p) level of theory. | ||
The polymer PTB7-Th interacts with A4 in such a way that the polymer is parallel to the combined bridge and end capped acceptor group, which facilitate the charge transfer between the donor and the acceptor unit. The relative orientation of A4 and PTB7-Th has a significant effect on the electronic structure of the complex. The dipole moment of the complex was calculated as the presence of a dipole from PTB7-Th in the acceptor has been suggested as a reason for the efficient exciton dissociation at the A4/PTB7-Th interface.62–65 The dipole μ in the A4![[thin space (1/6-em)]](https://www.rsc.org/images/entities/char_2009.gif) :PTB7-Th complex is due to electrostatic interactions of the permanent electric moment of PTB7-Th with that of A4.
:PTB7-Th complex is due to electrostatic interactions of the permanent electric moment of PTB7-Th with that of A4.
Previously published literature reveals that the dipole moment of the complex in governed by the charge transfer. In our case, the orientation of the dipole is in accordance with this statement. The dipole moment vector originates from the polymer side and points towards the end-capped acceptor group of A4. The HOMO–LUMO distribution pattern and the electronic structure of the complex were calculated at the MPW1PW91/6-31G(d,p) level of theory. The HOMO density is mainly spread all over the donor polymer PTB7-Th, while the LUMO is distributed on the bridge and end-capped acceptor group of A4, (Fig. 12). The orbital diagram shows that the HOMO-to-LUMO excitation is a charge transfer from the donor polymer to the acceptor A4. The shifting of the density from the donor to the acceptor is concrete evidence for the charge transfer between the different groups.
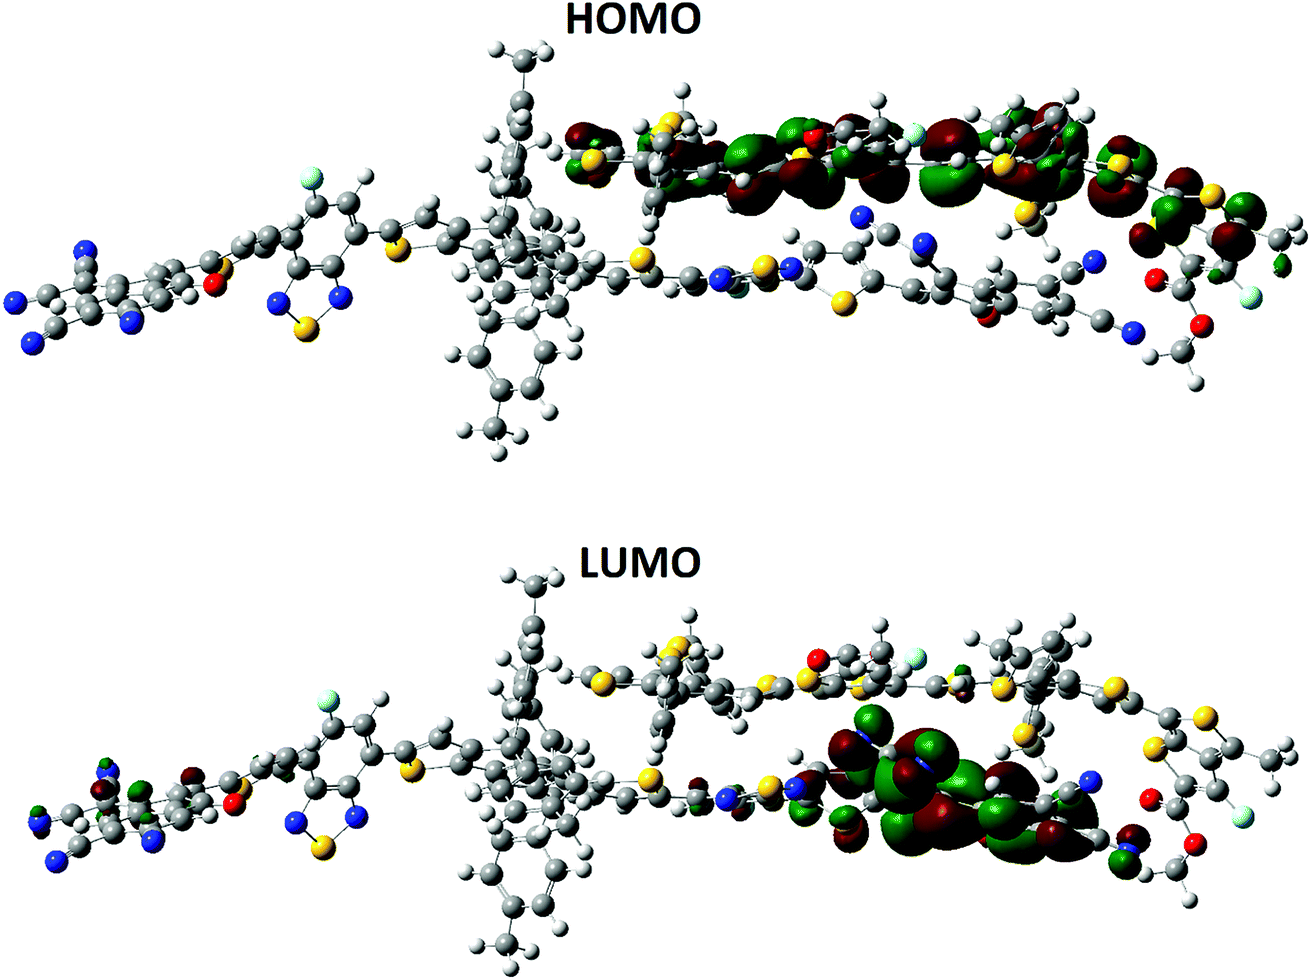 | ||
| Fig. 12 Distribution patterns of the frontier molecular orbitals (HOMO) and LUMO of A4 and PTB7-Th at the B3LYP/6-311G(d,p) level of theory. | ||
10. Conclusion
Four novel A–D–A type small molecules (A1, A2, A3 and A4) were evaluated as acceptors for non-fullerene organic solar cells. These compounds contain indacenodithiophene as a central core unit, monofluoro substituted benzothiadiazole (FBT) as a donor acceptor (DA) combine bridge and different end capped acceptor groups. Various optoelectronic properties of the four molecules were compared with a known reference molecule R. The M06-2X. CAM-B3LYP, B3LYP, MPW1PW91, and ωB97XD, with 6-31G(d,p) basis sets were used for the simulation of the UV-Vis spectra of the reference compound R. Overall, the designed molecules show better optoelectronic properties as compared to R, mainly owing to their electron withdrawing end groups. Molecule A4 displays a broad absorption in the visible region in the gas phase (λmax = 789.8 nm), as well as in chloroform solvent (λmax = 858.6 nm) and has the lowest HOMO–LUMO band gap (1.92 eV) of all of the five molecules. The lower electron reorganization energy, as compared to the hole reorganization energy, shows that the molecules had superior electron mobilities. The lower values for the electron reorganization energy transfer for A1–A4 as compared to that of R suggest that the novel molecules are suitable for use as acceptors with efficient electron transport in photovoltaic devices. Furthermore, the transition density matrix calculations show a higher charge dissociation ability for A1–A4 in comparison with that of R, which suggests a higher overall current charge density (Jsc) for those molecules. The band-gap for exciton formation, as measured by the difference between LUMO energy levels of A1–A4 and the HOMO level of a molecular model of polymer PTB7-Th, range from 1.30 to 1.85 eV. In summary, all four of the A–D–A type small molecules A1–A4 have better optoelectronic properties as compared to R and can therefore be used as organic solar cells.Conflicts of interest
There are no conflicts to declare.Acknowledgements
The computations/simulations/SIMILAR were performed on resources provided by the Swedish National Infrastructure for Computing (SNIC) at Umeå University, 901 87, Umeå, Sweden. The authors acknowledge the financial and technical support from the Punjab Bio-energy Institute (PBI) and the University of Agriculture Faisalabad (UAF).References
- Y. Li, Acc. Chem. Res., 2012, 45, 723–733 CrossRef CAS PubMed.
- Y. Lin, Y. Li and X. Zhan, Chem. Soc. Rev., 2012, 41, 4245–4272 RSC.
- J. Chen and Y. Cao, Acc. Chem. Res., 2009, 42, 1709–1718 CrossRef CAS PubMed.
- G. Li, R. Zhu and Y. Yang, Nat. Photonics, 2012, 6, 153 CrossRef CAS.
- L. Lu, T. Zheng, Q. Wu, A. M. Schneider, D. Zhao and L. Yu, Chem. Rev., 2015, 115, 12666–12731 CrossRef CAS PubMed.
- D. Deng, Y. Zhang, J. Zhang, Z. Wang, L. Zhu, J. Fang, B. Xia, Z. Wang, K. Lu and W. Ma, Nat. Commun., 2016, 7, 13740 CrossRef CAS PubMed.
- X. Xu, T. Yu, Z. Bi, W. Ma, Y. Li and Q. Peng, Adv. Mater., 2018, 30, 1703973 CrossRef PubMed.
- G. Zhang, K. Zhang, Q. Yin, X.-F. Jiang, Z. Wang, J. Xin, W. Ma, H. Yan, F. Huang and Y. Cao, J. Am. Chem. Soc., 2017, 139, 2387–2395 CrossRef CAS PubMed.
- T. Kumari, S. M. Lee, S.-H. Kang, S. Chen and C. Yang, Energy Environ. Sci., 2017, 10, 258–265 RSC.
- G. Yu, J. Gao, J. C. Hummelen, F. Wudl and A. J. Heeger, Science, 1995, 270, 1789–1791 CrossRef CAS.
- T. Liu and A. Troisi, Adv. Mater., 2013, 25, 1038–1041 CrossRef CAS PubMed.
- S. Holliday, R. S. Ashraf, C. B. Nielsen, M. Kirkus, J. A. Röhr, C. H. Tan, E. Collado-Fregoso, A. C. Knall, J. R. Durrant and J. Nelson, J. Am. Chem. Soc., 2015, 137, 898–904 CrossRef CAS PubMed.
- K. Sivula, C. K. Luscombe, B. C. Thompson and J. M. Fréchet, J. Am. Chem. Soc., 2006, 128, 13988–13989 CrossRef CAS PubMed.
- Y. Zhang, H.-L. Yip, O. Acton, S. K. Hau, F. Huang and A. K.-Y. Jen, Chem. Mater., 2009, 21, 2598–2600 CrossRef CAS.
- Y. Lin and X. Zhan, Acc. Chem. Res., 2015, 49, 175–183 CrossRef PubMed.
- R. B. Ross, C. M. Cardona, D. M. Guldi, S. G. Sankaranarayanan, M. O. Reese, N. Kopidakis, J. Peet, B. Walker, G. C. Bazan and E. Van Keuren, Nat. Mater., 2009, 8, 208 CrossRef CAS PubMed.
- C. Yan, S. Barlow, Z. Wang, H. Yan, A. K.-Y. Jen, S. R. Marder and X. Zhan, Nat. Rev. Mater., 2018, 3, 18003 CrossRef CAS.
- J. Hou, O. Inganäs, R. H. Friend and F. Gao, Nat. Mater., 2018, 17, 119 CrossRef CAS PubMed.
- P. Cheng, G. Li, X. Zhan and Y. Yang, Nat. Photonics, 2018, 12, 131 CrossRef CAS.
- J. Liu, S. Chen, D. Qian, B. Gautam, G. Yang, J. Zhao, J. Bergqvist, F. Zhang, W. Ma and H. Ade, Nat. Energy, 2016, 1, 16089 CrossRef CAS.
- X. Zhan, Z. a. Tan, B. Domercq, Z. An, X. Zhang, S. Barlow, Y. Li, D. Zhu, B. Kippelen and S. R. Marder, J. Am. Chem. Soc., 2007, 129, 7246–7247 CrossRef CAS PubMed.
- G. Gao, N. Liang, H. Geng, W. Jiang, H. Fu, J. Feng, J. Hou, X. Feng and Z. Wang, J. Am. Chem. Soc., 2017, 139, 15914–15920 CrossRef CAS PubMed.
- Y. Lin, J. Wang, Z. G. Zhang, H. Bai, Y. Li, D. Zhu and X. Zhan, Adv. Mater., 2015, 27, 1170–1174 CrossRef CAS PubMed.
- S. Dai, F. Zhao, Q. Zhang, T.-K. Lau, T. Li, K. Liu, Q. Ling, C. Wang, X. Lu and W. You, J. Am. Chem. Soc., 2017, 139, 1336–1343 CrossRef CAS PubMed.
- F. Zhao, S. Dai, Y. Wu, Q. Zhang, J. Wang, L. Jiang, Q. Ling, Z. Wei, W. Ma and W. You, Adv. Mater., 2017, 29, 1700144 CrossRef PubMed.
- Z. Luo, H. Bin, T. Liu, Z. G. Zhang, Y. Yang, C. Zhong, B. Qiu, G. Li, W. Gao and D. Xie, Adv. Mater., 2018, 30, 1706124 CrossRef PubMed.
- S. Li, L. Ye, W. Zhao, X. Liu, J. Zhu, H. Ade and J. Hou, Adv. Mater., 2017, 29, 1704051 CrossRef PubMed.
- J. Wang, W. Wang, X. Wang, Y. Wu, Q. Zhang, C. Yan, W. Ma, W. You and X. Zhan, Adv. Mater., 2017, 29, 1702125 CrossRef PubMed.
- J. Zhu, Z. Ke, Q. Zhang, J. Wang, S. Dai, Y. Wu, Y. Xu, Y. Lin, W. Ma and W. You, Adv. Mater., 2018, 30, 1704713 CrossRef PubMed.
- T. Li, S. Dai, Z. Ke, L. Yang, J. Wang, C. Yan, W. Ma and X. Zhan, Adv. Mater., 2018, 30, 1705969 CrossRef PubMed.
- W. Wang, C. Yan, T. K. Lau, J. Wang, K. Liu, Y. Fan, X. Lu and X. Zhan, Adv. Mater., 2017, 29, 1701308 CrossRef PubMed.
- B. Jia, S. Dai, Z. Ke, C. Yan, W. Ma and X. Zhan, Chem. Mater., 2017, 30, 239–245 CrossRef.
- B. Kan, J. Zhang, F. Liu, X. Wan, C. Li, X. Ke, Y. Wang, H. Feng, Y. Zhang and G. Long, Adv. Mater., 2018, 30, 1704904 CrossRef PubMed.
- S. Li, L. Zhan, F. Liu, J. Ren, M. Shi, C. Z. Li, T. P. Russell and H. Chen, Adv. Mater., 2018, 30, 1705208 CrossRef PubMed.
- Z. Fei, F. D. Eisner, X. Jiao, M. Azzouzi, J. A. Röhr, Y. Han, M. Shahid, A. S. Chesman, C. D. Easton and C. R. McNeill, Adv. Mater., 2018, 30, 1705209 CrossRef PubMed.
- W. Zhao, S. Li, H. Yao, S. Zhang, Y. Zhang, B. Yang and J. Hou, J. Am. Chem. Soc., 2017, 139, 7148–7151 CrossRef CAS PubMed.
- Y. Wu, H. Bai, Z. Wang, P. Cheng, S. Zhu, Y. Wang, W. Ma and X. Zhan, Energy Environ. Sci., 2015, 8, 3215–3221 RSC.
- S. Holliday, R. S. Ashraf, A. Wadsworth, D. Baran, S. A. Yousaf, C. B. Nielsen, C.-H. Tan, S. D. Dimitrov, Z. Shang and N. Gasparini, Nat. Commun., 2016, 7, 11585 CrossRef CAS PubMed.
- G. Zhang, G. Yang, H. Yan, J. H. Kim, H. Ade, W. Wu, X. Xu, Y. Duan and Q. Peng, Adv. Mater., 2017, 29, 1606054 CrossRef PubMed.
- S. Chen, Y. Liu, L. Zhang, P. C. Chow, Z. Wang, G. Zhang, W. Ma and H. Yan, J. Am. Chem. Soc., 2017, 139, 6298–6301 CrossRef CAS PubMed.
- D. Baran, R. S. Ashraf, D. A. Hanifi, M. Abdelsamie, N. Gasparini, J. A. Röhr, S. Holliday, A. Wadsworth, S. Lockett and M. Neophytou, Nat. Mater., 2017, 16, 363 CrossRef CAS PubMed.
- S. Holliday, R. S. Ashraf, C. B. Nielsen, M. Kirkus, J. A. Röhr, C.-H. Tan, E. Collado-Fregoso, A.-C. Knall, J. R. Durrant and J. Nelson, J. Am. Chem. Soc., 2015, 137, 898–904 CrossRef CAS PubMed.
- Y. Ma, M. Zhang, Y. Tang, W. Ma and Q. Zheng, Chem. Mater., 2017, 29, 9775–9785 CrossRef CAS.
- Y. Yang, J. Wang, H. Xu, X. Zhan and X. Chen, ACS Appl. Mater. Interfaces, 2018, 18984–18992 CrossRef CAS PubMed.
- M. Frisch, G. Trucks, H. Schlegel, G. Scuseria, M. Robb, J. Cheeseman, G. Scalmani, V. Barone, B. Mennucci and G. Petersson, Gaussian Inc., Wallingford, CT, 2009, vol. 27, p. 34 Search PubMed.
- R. D. Dennington, T. A. Keith and J. M. Millam, Gaussian Inc, 2008.
- J.-D. Chai and M. Head-Gordon, Phys. Chem. Chem. Phys., 2008, 10, 6615–6620 RSC.
- T. Yanai, D. P. Tew and N. C. Handy, Chem. Phys. Lett., 2004, 393, 51–57 CrossRef CAS.
- B. Civalleri, C. M. Zicovich-Wilson, L. Valenzano and P. Ugliengo, CrystEngComm, 2008, 10, 405–410 RSC.
- Y. Zhao and D. G. Truhlar, Theor. Chem. Acc., 2008, 120, 215–241 Search PubMed.
- C. Adamo and V. Barone, J. Chem. Phys., 1998, 108, 664–675 CrossRef CAS.
- M. Cossi, V. Barone, B. Mennucci and J. Tomasi, Chem. Phys. Lett., 1998, 286, 253–260 CrossRef CAS.
- J. H. Zhang, Y. Z. Su, J. H. Song and H. Y. Guo, Comput. Appl. Chem., 2003, 4, 020 Search PubMed.
- M. Ans, J. Iqbal, B. Eliasson and K. Ayub, Comput. Mater. Sci., 2019, 159, 150–159 CrossRef CAS.
- C. J. Takacs, Y. Sun, G. C. Welch, L. A. Perez, X. Liu, W. Wen, G. C. Bazan and A. J. Heeger, J. Am. Chem. Soc., 2012, 134, 16597–16606 CrossRef CAS PubMed.
- J. C. Blakesley and D. Neher, Phys. Rev. B: Condens. Matter Mater. Phys., 2011, 84, 075210 CrossRef.
- Y. Liang, Z. Xu, J. Xia, S. T. Tsai, Y. Wu, G. Li, C. Ray and L. Yu, Adv. Mater., 2010, 22, E135–E138 CrossRef CAS.
- M. Ans, J. Iqbal, Z. Ahmad, S. Muhammad, R. Hussain, B. Eliasson and K. Ayub, ChemistrySelect, 2018, 3, 12797–12804 CrossRef CAS.
- M. E. Köse, J. Phys. Chem. A, 2012, 116, 12503–12509 CrossRef PubMed.
- A. Dkhissi, Synth. Met., 2011, 161, 1441–1443 CrossRef CAS.
- B. G. Kim, C. G. Zhen, E. J. Jeong, J. Kieffer and J. Kim, Adv. Funct. Mater., 2012, 22, 1606–1612 CrossRef CAS.
- V. Arkhipov, P. Heremans and H. Bässler, Appl. Phys. Lett., 2003, 82, 4605–4607 CrossRef CAS.
- C. Marchiori and M. Koehler, Synth. Met., 2010, 160, 643–650 CrossRef CAS.
- M. Koehler, M. Santos and M. Da Luz, J. Appl. Phys., 2006, 99, 053702 CrossRef.
- S. Baranovskii, M. Wiemer, A. Nenashev, F. Jansson and F. Gebhard, J. Phys. Chem. Lett., 2012, 3, 1214–1221 CrossRef CAS.
Footnote |
| † Electronic supplementary information (ESI) available. See DOI: 10.1039/c8ra09292c |
| This journal is © The Royal Society of Chemistry 2019 |