 Open Access Article
Controllable reduction of graphene oxide by electron-beam irradiation
Yu
Yang
a,
Liang
Chen
*b,
De-Yuan
Li
a,
Ruo-Bing
Yi
a,
Jia-Wei
Mo
b,
Ming-Hong
Wu
*a and
Gang
Xu
 *a
*a
aShanghai Applied Radiation Institute, Shanghai University, Shanghai 200444, China. E-mail: mhwu@shu.edu.cn; xugang@shu.edu.cn
bDepartment of Optical Engineering, Zhejiang A&F University, Lin'an, Zhejiang 311300, China. E-mail: liang_chen05@126.com
First published on 25th January 2019
Abstract
The oxygen content of graphene oxide (GO) is directly related to its physical and chemical properties, such as hydrophilicity, suspension stability, adsorption, and ion-sieving ability of GO membranes. Here, a series of reduced GO (rGO) with C/O atomic ratios from 1.6 to 4.8 were prepared conveniently by electron-beam irradiation (EBI) with irradiation-dose control. Moreover, a single oxygen-containing group, i.e., epoxy or carbonyl, could be retained mainly in the rGO. The interlayer spacing of rGO could be changed from 9.6 Å to 7.4 Å through control of the oxygen content. The prepared rGO exhibited an excellent adsorption effect on Pb(II) ions, and the max adsorption capacity reached 194.76 mg g−1 for rGO with a low irradiation dose (5 kGy), which showed that the ratio of oxygen-containing groups is important for improving the adsorption of rGO in aqueous solution. These results indicated that highly efficient, environmentally friendly, and advanced EBI technology has good potential prospects for use in the large-scale production of rGO with precise control of the oxygen content.
Introduction
Graphene oxide (GO) and reduced graphene oxide (rGO) are two-dimensional (2D) materials derived from the oxidation of graphite, followed by one of many different possible exfoliation and reduction methods, and consequently have attracted great interest from researchers due to their unique physical and chemical characteristics.1–4 They show potential for use in many diverse technology applications, such as ion sieves,1,5,6 energy storage,7–9 water treatment,10,11 biomaterials12,13 and conductive materials.14,15 The performance of these applications is closely related to the characteristics of GO and rGO, such as their conductivity, water stability, biocompatibility, specific surface area and adsorption performance.4,16 However, all these properties of GO are affected by the type and amount of oxygen-containing groups on the GO surface. Therefore, it is possible to obtain rGO with specific properties by reducing or controlling the oxygen-containing groups of GO. At present, the reduction methods of GO mainly focus on thermal reduction and chemical reductant methods, such as with hydrazine reductants,17 sodium borohydride reductants,18 ascorbic acid,19 amino acid,20 HI/HAC21 and other methods, including soft-lithography.22 However, these reduction methods have harsh reaction conditions (high temperatures for a long reaction time), introduce other impurities, and are typically not environmentally friendly.4 Particularly important is to have a controllable oxygen content that can alter the properties of rGO to fulfil specific requirements in applications. There have also been efforts to tune the degrees of reduction. For example, it can be controlled by increasing the C/O ratio in thermal reduction methods,23 which is not only temperature-dependent but also a time-dependent process in the timeframe of seconds. So, due to the difficulty in precisely controlling the reduction process,6 a highly efficient and large-scale production of rGO has still not been achieved, especially, for reduction control, which still uses a higher oxygen content. Previous studies have demonstrated that GO has excellent adsorption for heavy metal ions and organic contaminants.24–27 However, swelling due to the strong hydrophilic character of GO membranes results in poor stability in water and hinders their application in water treatment.28Electron-beam irradiation (EBI) is an advanced redox technique that has been used for synthesis and chemical modification of materials.29–31 The principle of this method is to get the active free radicals (·OH, ·H and eaq−) to chemically react through applying high-energy-electron-beam radiation to water. So the strategy has many advantages, such as being chemical-reductant free, efficient, fast, eco-friendly, and easily scalable.
In this study, GO was reduced in a water/isopropanol solution system by simple, efficient, and fast EBI. The oxygen content in rGO decreased obviously as the reduction degree increased. Different reduction degrees of rGO with an interlayer spacing from 9.6 to 7.4 Å, and even a single oxygen-containing group, i.e., epoxy or carbonyl dominant, were obtained by controlling the EBI dose. Our previous studies also found that rGO as an ion-sieving membrane has great application in water treatment, and that different interlayer spacings can achieve accurate ion screening.1 Here, the results show that EBI can precisely control the rGO layer spacing under different irradiation doses, which further provides new ideas for controlling the layer spacing of rGO and the large-scale preparation of graphene. Moreover, rGO reduced by the EBI method showed a good adsorption of Pb(II) with different reduction degrees of rGO. It was found that a slight reduction of rGO at low doses (5 kGy) resulted in the best adsorption of Pb(II) of 194.76 mg g−1. The use of rGO reduced by the EBI method with dose control not only solves the issue of the swelling of GO membranes in water treatment applications, but also allows achieving a good adsorption at the same time, such as of heavy metal ions.
Experimental
Preparation of graphene oxide (GO) suspension
Graphene oxide (GO) was prepared from commercial graphite powder via a modified Hummers method.32 Graphite powders were pre-oxidized by concentrated H2SO4, K2S2O8, and P2O5 solution with continuous stirring for several hours. Then, the mixture was washed with DI water and vacuum dried. Then, pre-oxidized graphite was further oxidized in concentrated H2SO4 and KMnO4, diluted with DI water, followed by the addition of 30% H2O2. The product was separated by centrifugation and washed with a 1![[thin space (1/6-em)]](https://www.rsc.org/images/entities/char_2009.gif) :
:![[thin space (1/6-em)]](https://www.rsc.org/images/entities/char_2009.gif) 10 HCl aqueous solution to remove ion species first, and then washed with DI water sequentially. The concentration of the as-prepared GO suspension was approximately 5 mg ml−1.
10 HCl aqueous solution to remove ion species first, and then washed with DI water sequentially. The concentration of the as-prepared GO suspension was approximately 5 mg ml−1.
Reduced graphene oxide (rGO) prepared by electron-beam irradiation (EBI)
The EBI reduction method essentially involves applying radiation to water to produce hydrated electrons in the medium to facilitate chemical reactions.33,34 Hydrated electrons chemically react with the oxygen-containing groups on the GO surface to reduce the oxygen content.35 The intensity of the irradiation is described by the absorbed dose. The unit is grays, which are defined as the energy absorbed by the mass of the substance being irradiated: 1 gray indicates that 1 kg of material absorbs 1 J of energy, therefore, 1 gray = 1 J kg−1. Here the content of 75 mg GO was irradiated in each of the suspension/isopropanol samples. The GO suspension and isopropanol were mixed at a volume ratio of 3![[thin space (1/6-em)]](https://www.rsc.org/images/entities/char_2009.gif) :
:![[thin space (1/6-em)]](https://www.rsc.org/images/entities/char_2009.gif) 2. The mixed solutions were put into a sealed bag filled with nitrogen gas and irradiated with different doses (0, 5, 15, 20, 40 kGy) under room temperature. The electron accelerator had a beam intensity of 5 mA and an energy of 1.8 MeV (From the Shanghai Institute of Radiation Applications, GJ-II type electron accelerator). The degree of reduction of rGO increased and the colour became darker with the gradual increase in the irradiation dose. These were due to the removal of some oxygen-containing groups and the decrease in hydrophilicity, which led to rGO sheet agglomeration. Finally, the rGO solution was washed sequentially with DI water by centrifugation.
2. The mixed solutions were put into a sealed bag filled with nitrogen gas and irradiated with different doses (0, 5, 15, 20, 40 kGy) under room temperature. The electron accelerator had a beam intensity of 5 mA and an energy of 1.8 MeV (From the Shanghai Institute of Radiation Applications, GJ-II type electron accelerator). The degree of reduction of rGO increased and the colour became darker with the gradual increase in the irradiation dose. These were due to the removal of some oxygen-containing groups and the decrease in hydrophilicity, which led to rGO sheet agglomeration. Finally, the rGO solution was washed sequentially with DI water by centrifugation.
In order to test the suspension stability of rGO reduced by the EBI, the prepared rGO suspensions with the radiation dose increasing were centrifuged at 5000 rpm for 5 min.
Fabrication of freestanding rGO membranes
Freestanding rGO membranes could be prepared by drop-casting the rGO suspension droplets onto a smooth paper substrate.1 The freestanding rGO membranes in our study were dried thoroughly at 60 °C for 12 h. After that, they were peeled off, rinsed, and soaked with DI water for more than half an hour, then dried in a dry dish at room temperature for 3 days. The prepared freestanding membranes were later used for the adsorption experiments.Adsorption experiments
The kinetics of adsorption of Pb(II) by rGO was assessed by adding 25 mg of rGO membranes in a 10 ml solution with the initial concentration of Pb(II) 500 mg l−1, and the mixture was rotationally stirred at a rate of 160 rpm at 30 °C. An aliquot of 0.2 ml sample solution was taken from the beaker to analyze the concentration of lead ions at different time intervals. The concentration of Pb(II) ions was determined using ICP-OES (HITACHI, PS7800).According to the following equation36,37 as a pseudo-first-order kinetic model (eqn (1)), the experimental data were fitted using Origin software:
| qt = qe(1 − e−k1t) |
Results and discussion
Theory of the reduction of GO suspension via electron-beam irradiation
The primary radiolysis process of water under electron-beam irradiation can be explained by reaction (1):33 | (1) |
| eaq− + ·OH → OH− | (2) |
| ·OH + (CH3)2CHOH → ·C(CH3)2OH + H2O | (3) |
| eaq− + ·C(CH3)2OH → C(CH3)2OH− | (4) |
In reaction (1), water molecules produce various species under the high-energy-electron-beam irradiation, where the hydrated electron (e− + nH2O → eaq−) is a strong reducing agent toward oxygen-containing functional groups, such as hydroxyl, epoxies, ketones, and carboxylic acids. The generated eaq− can cause the deoxygenation and hence reduction of GO. However, eaq− tend to be degraded by ·OH in reaction (2). This causes the reduction reaction to be blocked, thus it is necessary to add an alcohol to the water to scavenge the hydroxyl radicals (·OH) to prevent reaction (2), at the same time greatly enhancing the stability of the hydrated electron by reaction (3). Herein, it is assumed that reaction (4) does not occur to an appreciable extent.34
Physicochemical properties of GO and rGOs
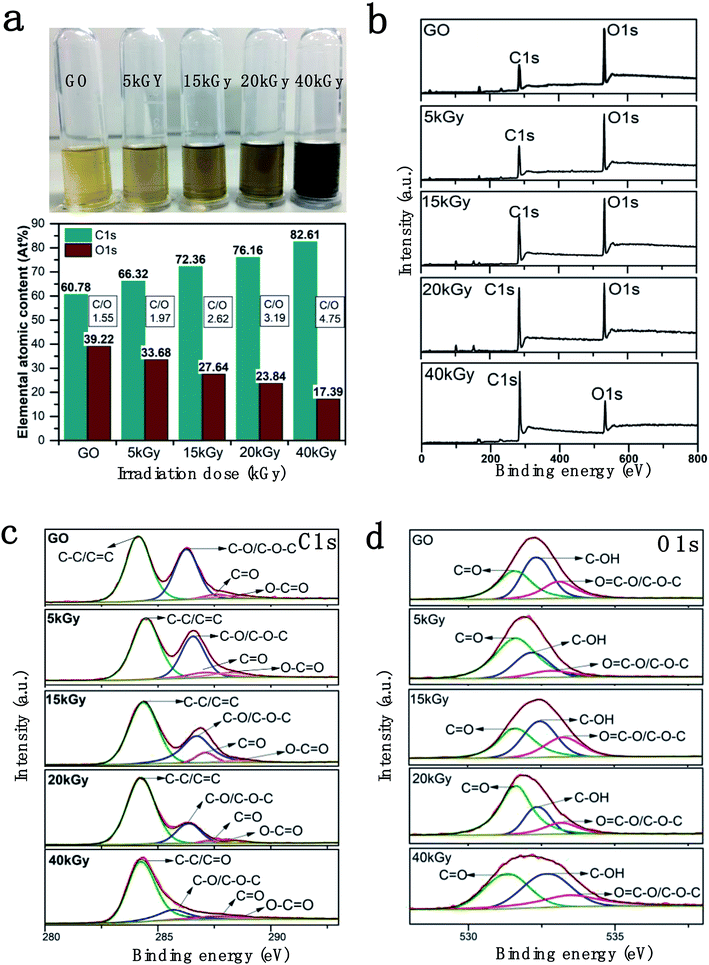
The rGOs solution (0.2 mg ml−1) at different irradiation doses (0, 5, 15, 20, 40 kGy) were obtained as shown in Fig. 1a. The solution became darker with increasing the irradiation dose, which was consistent with rGO dispersion reported in the literature.38 The decrease in GO hydrophilicity due to removing a portion of the oxygen-containing groups, which are easier to be separated by centrifugation, results in the agglomeration of GO sheets.X-ray photoelectron spectroscopy (XPS) was utilized to analyze the oxygen group content before and after the irradiation of GO. The XPS full scan spectra and C1s and O1s partial spectra of rGOs under different irradiation doses are shown in Fig. 1. The C1s and O1s peak positions of rGOs were at 285.08 eV and 532.08 eV, respectively. From the elemental contents of C and O in the full scan spectra, it is obvious that the ratio of C/O in each sample increased sharply (from 1.6 to 4.8) with the increase in irradiation dose, indicating the successful and controllable removal of oxygen-containing groups on the GO surface. The C1s and O1s XPS spectra of rGOs with different irradiation dosages are shown in Fig. 1c and d. The C1s XPS spectra exhibit four different peaks located at 284.46, 286.54, 287.08 and 288.13 eV, corresponding to aromatic (C–C/C![[double bond, length as m-dash]](https://www.rsc.org/images/entities/char_e001.gif) C), epoxide (C–O/C–O–C), carbonyl (C
C), epoxide (C–O/C–O–C), carbonyl (C![[double bond, length as m-dash]](https://www.rsc.org/images/entities/char_e001.gif) O) and carboxyl group (O–C
O) and carboxyl group (O–C![[double bond, length as m-dash]](https://www.rsc.org/images/entities/char_e001.gif) O) chemical shifts, respectively.1,39 A clear reduction control is shown by the specific peak area of C–O/C–O–C decreasing with the increasing irradiation dosages, as shown in Fig. 1c. The content of C–O/C–O–C decreased from 39.11% to 11.07%, and the content of O
O) chemical shifts, respectively.1,39 A clear reduction control is shown by the specific peak area of C–O/C–O–C decreasing with the increasing irradiation dosages, as shown in Fig. 1c. The content of C–O/C–O–C decreased from 39.11% to 11.07%, and the content of O![[double bond, length as m-dash]](https://www.rsc.org/images/entities/char_e001.gif) C–O group was reduced from 88.75% to 25.58% with an increase in irradiation dose. On the contrary, the proportion of C–C/C
C–O group was reduced from 88.75% to 25.58% with an increase in irradiation dose. On the contrary, the proportion of C–C/C![[double bond, length as m-dash]](https://www.rsc.org/images/entities/char_e001.gif) C gradually increased from 52.73% to 80.55%. (Table 1). Similarly, the O1s spectrum was also resolved into three individual component peaks centred at 533.16 eV (O
C gradually increased from 52.73% to 80.55%. (Table 1). Similarly, the O1s spectrum was also resolved into three individual component peaks centred at 533.16 eV (O![[double bond, length as m-dash]](https://www.rsc.org/images/entities/char_e001.gif) C–O and C–O–C), 532.32 eV (C–OH) and 531.60 eV (C
C–O and C–O–C), 532.32 eV (C–OH) and 531.60 eV (C![[double bond, length as m-dash]](https://www.rsc.org/images/entities/char_e001.gif) O),40,41 respectively (Fig. 1d). The content of C–OH decreased from 42.42% to 26.24%, and that of COOH decreased from 20.31% to 12.16% (Table 2), which were consistent with the results for C1s XPS. This indicated that a large number of oxygen-containing groups had been removed as the irradiation dose increased. The main oxygen-containing groups retained in rGO were epoxy or carbonyl, which upon reduction with high irradiation doses were reduced to epoxy ∼11.07% and carbonyl ∼8.02% (total oxygen content was ∼17.2% at 40 kGy).
O),40,41 respectively (Fig. 1d). The content of C–OH decreased from 42.42% to 26.24%, and that of COOH decreased from 20.31% to 12.16% (Table 2), which were consistent with the results for C1s XPS. This indicated that a large number of oxygen-containing groups had been removed as the irradiation dose increased. The main oxygen-containing groups retained in rGO were epoxy or carbonyl, which upon reduction with high irradiation doses were reduced to epoxy ∼11.07% and carbonyl ∼8.02% (total oxygen content was ∼17.2% at 40 kGy).
| Irradiation dose (kGy) | C–C/C![[double bond, length as m-dash]](https://www.rsc.org/images/entities/char_e001.gif) C (%) C (%) |
C–O/C–O–C (%) | C![[double bond, length as m-dash]](https://www.rsc.org/images/entities/char_e001.gif) O (%) O (%) |
O–C![[double bond, length as m-dash]](https://www.rsc.org/images/entities/char_e001.gif) O (%) O (%) |
|---|---|---|---|---|
| GO (0 kGy) | 52.73 | 39.1 | 5.18 | 2.99 |
| 5 kGy | 56.79 | 35.12 | 6.51 | 1.58 |
| 15 kGy | 61.05 | 30.19 | 6.46 | 2.31 |
| 20 kGy | 75.42 | 21.43 | 1.33 | 1.82 |
| 40 kGy | 80.55 | 11.07 | 8.02 | 0.37 |
| Irradiation dose (kGy) | C![[double bond, length as m-dash]](https://www.rsc.org/images/entities/char_e001.gif) O (%) O (%) |
C–OH (%) | O–C![[double bond, length as m-dash]](https://www.rsc.org/images/entities/char_e001.gif) O/C–O–C (%) O/C–O–C (%) |
|---|---|---|---|
| GO (0 kGy) | 37.28 | 42.42 | 20.31 |
| 5 kGy | 59.68 | 29.29 | 11.03 |
| 15 kGy | 53.94 | 20.41 | 26.65 |
| 20 kGy | 60.88 | 25.47 | 13.65 |
| 40 kGy | 61.59 | 26.24 | 12.16 |
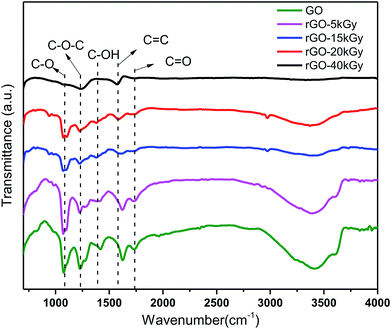
We confirmed the controllable reduction of oxygen-containing groups using FT-IR spectra detection, which showed the same trends as the oxygen-containing group contents with the irradiation doses increasing. Fig. 2 shows the change in different oxygen-containing groups on the graphene oxide surface. This suggests that the oxygen-containing groups –OH (3430 cm−1), carboxyl C![[double bond, length as m-dash]](https://www.rsc.org/images/entities/char_e001.gif) O (1735 cm−1), hydroxyl C–OH (1416 cm−1), epoxy C–O–C (1240 cm−1) and alkoxy C–O (1074 cm−1) were all gradually decreased with the radiation dose increasing. At 40 kGy dose irradiation, the oxygen-containing groups almost disappeared, such as the –OH (3430 cm−1), carbonyl C
O (1735 cm−1), hydroxyl C–OH (1416 cm−1), epoxy C–O–C (1240 cm−1) and alkoxy C–O (1074 cm−1) were all gradually decreased with the radiation dose increasing. At 40 kGy dose irradiation, the oxygen-containing groups almost disappeared, such as the –OH (3430 cm−1), carbonyl C![[double bond, length as m-dash]](https://www.rsc.org/images/entities/char_e001.gif) O (1735 cm−1), carbonyl C–OH (1416 cm−1) and alkoxy C–O (1074 cm−1) groups, consistent with the reduction of rGO reported in the literature.42–48 Moreover, a single and less oxygen-containing group, such as epoxy or carbonyl, can be retained in rGO. Therefore, it was indicated that a series of different degrees of reduction of rGO were successfully obtained by electron-beam irradiation.
O (1735 cm−1), carbonyl C–OH (1416 cm−1) and alkoxy C–O (1074 cm−1) groups, consistent with the reduction of rGO reported in the literature.42–48 Moreover, a single and less oxygen-containing group, such as epoxy or carbonyl, can be retained in rGO. Therefore, it was indicated that a series of different degrees of reduction of rGO were successfully obtained by electron-beam irradiation.
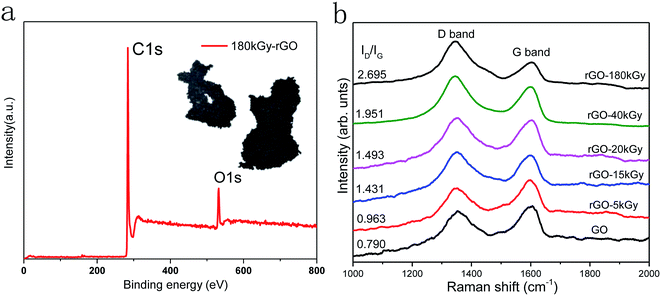
Raman spectroscopy is a non-destructive technique used to study the structural orders and disorders of various carbon materials, including GO and rGO.49 The Raman spectra of GO and rGO in Fig. 3b show peculiar peaks designated as a D band at 1350 cm−1 and G band at 1590 cm−1, with the G band assigned to the first-order scattering of the E2g mode observed for sp2 carbon domains, and the broad D band caused by sp3-hybridized carbon, structural defects, carbon amorphous or edge planes that can break the symmetry and selection rule, The ID/IG ratio is usually used to measure the disorder degree and size of sp2 clusters in a network of sp3 and sp2 bonded carbons.50,51 An increase in the ID/IG value means a degradation of the crystallinity of the graphitic materials. Here, the Raman spectroscopy results (Fig. 3) showed that the ID/IG value increased from 0.790 to 1.951 with the increase in irradiation dose, thereby the defects had increased following electron-beam irradiation.
To analyze the oxygen content and defects in GO at high doses, the irradiation dose was increased to 180 kGy. According to the results of XPS and Raman detection, the C–C/C![[double bond, length as m-dash]](https://www.rsc.org/images/entities/char_e001.gif) C ration increased to 91.28%, and the corresponding defects also increased significantly, as shown in Fig. 3. These indicate that there was a higher reduction with the increased irradiation doses; however, the defects and agglomeration of rGO was a serious issue (inset in Fig. 3a), and further confirmed that a controllable oxygen content of rGO is important to fulfil specific requirements in applications.
C ration increased to 91.28%, and the corresponding defects also increased significantly, as shown in Fig. 3. These indicate that there was a higher reduction with the increased irradiation doses; however, the defects and agglomeration of rGO was a serious issue (inset in Fig. 3a), and further confirmed that a controllable oxygen content of rGO is important to fulfil specific requirements in applications.
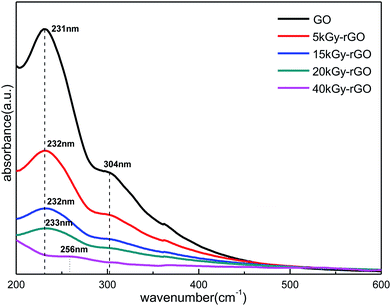
Fig. 4 shows the typical UV-vis absorption spectra for GO and rGO. There are two distinct characteristic absorption peaks at 231 nm and 304 nm for GO (0 kGy), which correspond to the π → π* transition of C![[double bond, length as m-dash]](https://www.rsc.org/images/entities/char_e001.gif) C and the n → π* transition of C
C and the n → π* transition of C![[double bond, length as m-dash]](https://www.rsc.org/images/entities/char_e001.gif) O, respectively.52 With the increase in radiation dose (from 0 to 40 kGy), the absorption peak of GO at 231 nm was shifted slightly to a longer wavelength near 256 nm. This shows that the conjugated electron structure of graphene oxide is gradually restored, which is an indication of the increase in GO reduction. The significant decrease of the C
O, respectively.52 With the increase in radiation dose (from 0 to 40 kGy), the absorption peak of GO at 231 nm was shifted slightly to a longer wavelength near 256 nm. This shows that the conjugated electron structure of graphene oxide is gradually restored, which is an indication of the increase in GO reduction. The significant decrease of the C![[double bond, length as m-dash]](https://www.rsc.org/images/entities/char_e001.gif) O characteristic absorption peak at 304 nm (disappears at 40 kGy) further indicated a decrease in the GO oxygen content. These results demonstrate again that a series of different degrees of reduction of rGO could be obtained by precise control of the EBI.
O characteristic absorption peak at 304 nm (disappears at 40 kGy) further indicated a decrease in the GO oxygen content. These results demonstrate again that a series of different degrees of reduction of rGO could be obtained by precise control of the EBI.
The control or tuning of the interlayer spacing is a key issue for ion sieving by GO membranes.1,5 It is obvious that, the oxygen-containing groups serving as pillars supporting the spacing between GO flakes in membranes would have an impact on the interlayer spacing. We therefore tested the interlayer spacing of fabricated rGO membranes by X-ray diffractometry (XRD), and found that there were clear shifts of the spacing (indicated by the Bragg peaks in Fig. 5) relative to the GO membranes without EBI reduction. The interlayer spacing showed a typical XRD pattern of the rGO, with spacings of 9.6, 8.5, 8.1, 7.8 and 7.4 Å for irradiated doses of 0, 5, 15, 20 and 40 kGy, respectively. As the radiation dose increased, the interlayer spacing of rGO decreased from 9.6 Å to 7.4 Å. This shows that the oxide contents can determine the interlayer spacing of rGO membranes at sizes as small as a nanometre, and the variable range of this spacing can be controlled to within 1 Å. The decrease in interlayer spacing indicated that EBI could precisely deoxygenate and control the reduction of rGO. It should be noted that the higher radiation dose resulted in a weaker intensity of XRD peaks (Fig. 5a), indicating a weakening of the levelling and ordering between GO flakes by higher EBI doses, which would decrease the permeability and mechanical properties of the membranes.
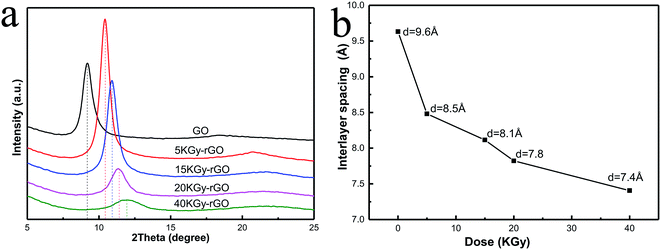 | ||
| Fig. 5 (a) XRD spectra of rGOs and (b) interlayer spacing of rGO under different irradiation doses (0, 5, 15, 20, 40 kGy). | ||
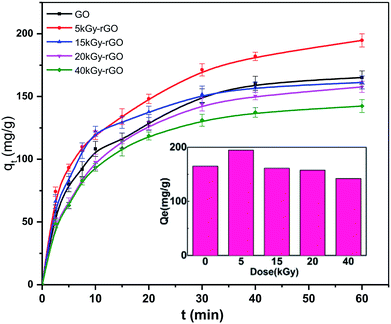
In addition, we analyzed the solution adsorption of the rGO membranes with heavy metal ions. The adsorption performance of Pb(II) by rGO membranes with different degrees of reduction was measured as shown in Fig. 6. It was found that a rapid adsorption process took place in the first 40 min and reached an equilibrium of adsorption at ∼1 h. This rapid adsorption phenomenon is attributed to the strong cation-π interactions between the adsorbents and heavy metal ions, which allows a large number of heavy metal ions to enter the channel between layers to achieve adsorption equilibrium.53 The adsorption capacity of Pb(II) by rGO under the different doses was also studied. The results showed that the fastest adsorption rate and maximum equilibrium adsorption capacity (194.76 mg g−1) occurred at a low dose of 5 kGy. According to previous research, the mechanism of rGO adsorption of heavy metals is mainly dominated by cation-π interactions, and the intensity of the cation-π force is related to the area of the aromatic ring. However, the area of the aromatic ring is related to the hydrophilicity of rGO, and these are determined by the oxygen contents on the rGO surface.54 That is, aromatic rings are the main contributing factor for Pb adsorption, but also have an important influence on the hydrophilicity. Therefore, the reason for this phenomenon is that the GO reduced by the 5 kGy dose both had a certain reducibility with good stability and good hydrophilicity in water. Then, when the irradiation dose was higher than 5 kGy, the maximum adsorption capacity decreased with the increase in irradiation dose. This is related to the removal of oxygen-containing groups on the surface of the rGO.
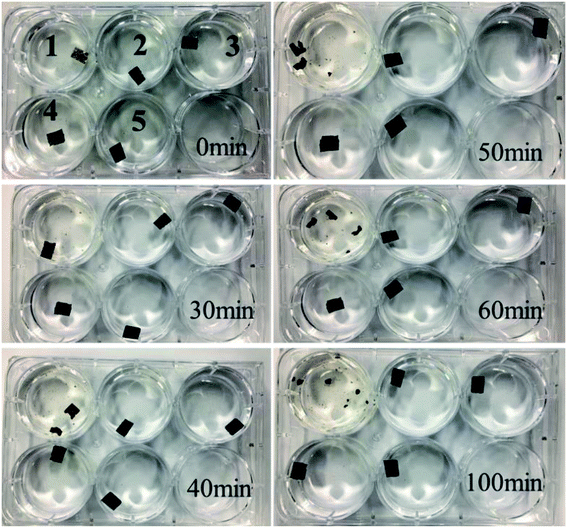
Further experiments were carried out to observe the stability of GO and rGO membranes. As shown in Fig. 7, the most striking difference between the GO and rGO membranes is their stability in water, which shows that the GO membrane disintegrates after about 30 min upon hydration without any mechanical agitation, and is then completely dispersed after 100 min. In contrast, all the rGO membranes remained intact in water. This indicated that the reduction of GO by EBI, to a certain extent, can well solve the swelling of GO membranes in water.
Conclusions
We achieved a facile and precise control of the oxygen content in rGO, with C/O atomic ratios from 1.6 to 4.8, and retention of a single epoxy or carbonyl group, mainly though electron-beam irradiation at different irradiation doses (5, 15, 20, 40 kGy). Under the electron-beam irradiation, a large number of oxygen functional groups on the surface of the GO were controllably removed, and the interlayer spacing of GO decreased from 9.6 to 7.4 Å, showing that the oxide content can determine the interlayer spacing of rGO membranes at sizes as small as a nanometre; also, the variable range of this spacing could be controlled to within 1 Å. The adsorption performance of Pb(II) showed that the best adsorption effect occurred when the irradiation dose was 5 kGy, which represented the fastest adsorption rate and maximum equilibrium adsorption capacity (194.76 mg g−1). Overall, our findings represent a controllable reduction of GO by EBI methods as an environmentally friendly, efficient and advanced technology that has potential application prospects in the controllable reduction of GO, energy storage, ion sieves, water treatment, biomaterials, conductive materials, among others.Conflicts of interest
There are no conflicts to declare.Acknowledgements
This work was supported by the National Natural Science Foundation of China (no. 11675098, 21672231, 11605111, 11775138), the Scientific Research and Developed Fund of Zhejiang A & F University (no. 2017FR032).References
- L. Chen, G. Shi, J. Shen, B. Peng, B. Zhang, Y. Wang, F. Bian, J. Wang, D. Li, Z. Qian, G. Xu, G. Liu, J. Zeng, L. Zhang, Y. Yang, G. Zhou, M. Wu, W. Jin, J. Li and H. Fang, Nature, 2017, 550, 380–383 CrossRef CAS.
- D. R. Dreyer, S. Park, C. W. Bielawski and R. S. Ruoff, Chem. Soc. Rev., 2010, 39, 228–240 RSC.
- Y. Zhu, S. Murali, W. Cai, X. Li, J. W. Suk, J. R. Potts and R. S. Ruoff, Adv. Mater., 2010, 22, 3906–3924 CrossRef CAS.
- S. Pei and H.-M. Cheng, Carbon, 2012, 50, 3210–3228 CrossRef CAS.
- J. Abraham, K. S. Vasu, C. D. Williams, K. Gopinadhan, Y. Su, C. T. Cherian, J. Dix, E. Prestat, S. J. Haigh, I. V. Grigorieva, P. Carbone, A. K. Geim and R. R. Nair, Nat. Nanotechnol., 2017, 12, 546–550 CrossRef CAS.
- R. K. Joshi, P. Carbone, F. C. Wang, V. G. Kravets, Y. Su, I. V. Grigorieva, H. A. Wu, A. K. Geim and R. R. Nair, Science, 2014, 343, 752–754 CrossRef CAS.
- J. Xu, K. Wang, S.-Z. Zu, B.-H. Han and Z. Wei, ACS Nano, 2010, 4, 5019–5026 CrossRef CAS.
- T. Kuila, A. K. Mishra, P. Khanra, N. H. Kim and J. H. Lee, Nanoscale, 2013, 5, 52–71 RSC.
- Z. Bo, X. Shuai, S. Mao, H. Yang, J. Qian, J. Chen, J. Yan and K. Cen, Sci. Rep., 2014, 4, 4684 CrossRef.
- V. Kumar Gupta, S. Agarwal, M. Asif, A. Fakhri and N. Sadeghi, J. Colloid Interface Sci., 2017, 497, 193–200 CrossRef CAS.
- W. Hou, Y. Zhang, T. Liu, H. Lu and L. He, RSC Adv., 2015, 5, 8037–8043 RSC.
- B. C. Thompson, E. Murray and G. G. Wallace, Adv. Mater., 2015, 27, 7563–7582 CrossRef CAS.
- D. Ege, A. R. Kamali and A. R. Boccaccini, Adv. Eng. Mater., 2017, 19, 1700627 CrossRef.
- A. T. U. Nugrahenny, J. Kim, S.-K. Kim, D.-H. Peck, S.-H. Yoon and D.-H. Jung, Carbon Lett., 2014, 15, 38–44 CrossRef.
- C. Zhang, T. Zhai, Y. Dan and L.-S. Turng, Polym. Compos., 2017, 38, E199–E207 CrossRef CAS.
- Y. H. Xi, J. Q. Hu, Z. Liu, R. Xie, X. J. Ju, W. Wang and L. Y. Chu, ACS Appl. Mater. Interfaces, 2016, 8, 15557–15566 CrossRef CAS.
- S. Park, J. An, J. R. Potts, A. Velamakanni, S. Murali and R. S. Ruoff, Carbon, 2011, 49, 3019–3023 CrossRef CAS.
- H.-J. Shin, K. K. Kim, A. Benayad, S.-M. Yoon, H. K. Park, I.-S. Jung, M. H. Jin, H.-K. Jeong, J. M. Kim, J.-Y. Choi and Y. H. Lee, Adv. Funct. Mater., 2009, 19, 1987–1992 CrossRef CAS.
- J. Zhang, H. Yang, G. Shen, P. Cheng, J. Zhang and S. Guo, Chem. Commun., 2010, 46, 1112–1114 RSC.
- D. Chen, L. Li and L. Guo, Nanotechnology, 2011, 22, 325601 CrossRef.
- Z. Xiong, C. Liao, W. Han and X. Wang, Adv. Mater., 2015, 27, 4469–4475 CrossRef CAS.
- Z. Xiong, C. Liao and X. Wang, J. Mater. Chem. C, 2015, 3, 6224–6231 RSC.
- C. Punckt, F. Muckel, S. Wolff, I. A. Aksay, C. A. Chavarin, G. Bacher and W. Mertin, Appl. Phys. Lett., 2013, 102, 023114 CrossRef.
- G. Zhao, X. Ren, X. Gao, X. Tan, J. Li, C. Chen, Y. Huang and X. Wang, Dalton Trans., 2011, 40, 10945–10952 RSC.
- C. J. Madadrang, H. Y. Kim, G. Gao, N. Wang, J. Zhu, H. Feng, M. Gorring, M. L. Kasner and S. Hou, ACS Appl. Mater. Interfaces, 2012, 4, 1186–1193 CrossRef CAS.
- Y. Lei, F. Chen, Y. Luo and L. Zhang, Chem. Phys. Lett., 2014, 593, 122–127 CrossRef CAS.
- B. Peng, L. Chen, C. Que, K. Yang, F. Deng, X. Deng, G. Shi, G. Xu and M. Wu, Sci. Rep., 2016, 6, 31920 CrossRef CAS.
- P. Sun, K. Wang and H. Zhu, Adv. Mater., 2016, 28, 2287–2310 CrossRef CAS.
- E. Jin, J. He, K. Sheng, Z. Zhang, G. Shi and Q. Zheng, Acta Mater., 2013, 61, 6466–6473 CrossRef CAS.
- T. Sugimoto and K. Kimura, Bull. Chem. Soc. Jpn., 2013, 86, 333–338 CrossRef CAS.
- M. Kang, D. H. Lee, Y.-M. Kang and H. Jung, Electrochim. Acta, 2015, 184, 427–435 CrossRef CAS.
- W. S. Hummers and R. E. Offeman, J. Am. Chem. Soc., 1958, 80, 1339 CrossRef CAS.
- W. H. Hamill, J. Phys. Chem., 1969, 73, 1341–1347 CrossRef CAS.
- J. Cygler and G. R. Freeman, Can. J. Chem., 1984, 62, 1265–1270 CrossRef CAS.
- B. Zhang, L. Li, Z. Wang, S. Xie, Y. Zhang, Y. Shen, M. Yu, B. Deng, Q. Huang, C. Fan and J. Li, J. Mater. Chem., 2012, 22, 7775 RSC.
- Y. S. Ho, J. C. Y. Ng and G. McKay, Sep. Purif. Methods, 2000, 29, 189–232 CrossRef CAS.
- R. Ocampo-Perez, J. Rivera-Utrilla, C. Gomez-Pacheco, M. Sanchez-Polo and J. J. Lopez-Penalver, Chem. Eng. J., 2012, 213, 88–96 CrossRef CAS.
- J.-M. Jung, C.-H. Jung, M.-S. Oh, I.-T. Hwang, C.-H. Jung, K. Shin, J. Hwang, S.-H. Park and J.-H. Choi, Mater. Lett., 2014, 126, 151–153 CrossRef CAS.
- J. Bai, H. Sun, X. Yin, X. Yin, S. Wang, A. E. Creamer, L. Xu, Z. Qin, F. He and B. Gao, ACS Appl. Mater. Interfaces, 2016, 8, 25289–25296 CrossRef CAS.
- Z. Huang, Z. Li, L. Zheng, L. Zhou, Z. Chai, X. Wang and W. Shi, Chem. Eng. J., 2017, 328, 1066–1074 CrossRef CAS.
- I. Bertóti, M. Mohai and K. László, Carbon, 2015, 84, 185–196 CrossRef.
- Y. Shen, H.-B. Zhang, H. Zhang, W. Ren, A. Dasari, G.-S. Tang and Z.-Z. Yu, Carbon, 2013, 56, 132–138 CrossRef CAS.
- E. Fuente, J. A. Menéndez, M. A. Díez, D. Suárez and M. A. Montes-Morán, J. Phys. Chem. B, 2003, 107, 6350–6359 CrossRef CAS.
- T. Szabó, O. Berkesi and I. Dékány, Carbon, 2005, 43, 3186–3189 CrossRef.
- T. Szabo, O. Berkesi, P. Forgo, K. Josepovits, Y. Sanakis, D. Petridis and I. Dekany, Chem. Mater., 2006, 18, 2740–2749 CrossRef CAS.
- A. Bagri, C. Mattevi, M. Acik, Y. J. Chabal, M. Chhowalla and V. B. Shenoy, Nat. Chem., 2010, 2, 581 CrossRef CAS.
- C.-J. Kim, W. Khan and S.-Y. Park, Chem. Phys. Lett., 2011, 511, 110–115 CrossRef CAS.
- C. Zhang, D. M. Dabbs, L.-M. Liu, I. A. Aksay, R. Car and A. Selloni, J. Phys. Chem. C, 2015, 119, 18167–18176 CrossRef CAS.
- A. Thakur, S. Kumar and V. S. Rangra, in Proceedings of the International Conference on Condensed Matter Physics 2014, ed. R.Sharma, P. K.Ahluwalia and M.Singh, 2015, vol. 1661 Search PubMed.
- M. Zainy, N. M. Huang, S. Vijay Kumar, H. N. Lim, C. H. Chia and I. Harrison, Mater. Lett., 2012, 89, 180–183 CrossRef CAS.
- A. Kaniyoor and S. Ramaprabhu, AIP Adv., 2012, 2, 13 Search PubMed.
- J. Li, G. Xiao, C. Chen, R. Li and D. Yan, J. Mater. Chem. A, 2013, 1, 1481–1487 RSC.
- V. Chandra and K. S. Kim, Chem. Commun., 2011, 47, 3942–3944 RSC.
- G. Shi, J. Liu, C. Wang, B. Song, Y. Tu, J. Hu and H. Fang, Sci. Rep., 2013, 3, 3436 CrossRef.
| This journal is © The Royal Society of Chemistry 2019 |

