 Open Access Article
Chiral and random arrangements of flavin chromophores along cyclic peptide nanotubes on gold influencing differently on surface potential and piezoelectricity†
Yusuke Kamano ,
Yuki Tabata
 ,
Hirotaka Uji
 and
Shunsaku Kimura
 *
*
Department of Material Chemistry, Graduate School of Engineering, Kyoto University, Kyoto-Daigaku Katsura, Nishikyo-ku, Kyoto 615-8510, Japan. E-mail: kimura.shunsaku.4w@kyoto-u.ac.jp
First published on 28th January 2019
Abstract
Two kinds of peptide nanotubes are prepared from cyclo(β-Asp(flavin)-β-alanine-β-alanine) (C3FAA) and cyclo(β-Asp(flavin)-ethylenediamine-succinic acid) (C3FES). The flavin chromophores are protruding on the C3FAA and C3FES peptide nanotube surfaces in random and chiral ways, respectively. The surface potentials of the C3FAA nanotube bundles on a gold substrate become larger than the C3FES nanotube bundles of the corresponding thicknesses. The converse piezoelectric coefficients are as small as less than 1 pm V−1. The peptide nanotube bundles are subjected to a thermal anneal treatment which raises up all the surface potentials and also the converse piezoelectricity of the C3FES nanotube bundles of 3 pm V−1. The macrodipole of the C3FAA nanotube and the chiral arrangement of the flavin groups in the C3FES nanotube are considered to contribute influentially to the surface potential and the piezoelectricity, respectively.
1. Introduction
Use of electronic organic materials including organic light-emitting diodes and organic field-effect transistors has been already a part of current electronic technologies.1,2 Advantages of electronic organic materials in comparison with conventional inorganic materials are attributed generally to their mechanical flexibility, mostly harmless properties, and environmentally benign processes to fabricate.3 Further, they have another advantage for the availability of the precise control of molecular organization into well-defined nanostructures without a constraint and limitation of crystallization required for most inorganic electronic materials. The latter advantage will become a key point in the technological trend toward downsizing to the nanoscale electronic devices. The ultimate goal of the downsizing is molecular electronics, but there remain many issues to be overcome. For example, molecular devices should be connected as components of an electronic circuit. Further, single molecule shows intrinsic fluctuation in the electrical outputs.4 In the aim of solving the problem of the strong stochastic fluctuations, molecular ensembles with tens molecules instead of single molecule are proposed for the nano-devices to become robust molecular devices.5 Accordingly, the mesoscopic scale of condensed materials between single molecule and crystal is a demanding dimension for the nanomaterials showing quantitative solid behaviors. For the next-generation nanoscale electronic devices or the electronic nanomaterials, the molecular assemblies comprising dipole and/or aromatic groups, which are functional units connecting to electronic responses, are thus the current targets.6Peptide nanotubes are one of the molecular assemblies having well-defined nanostructures.7,8 In recent years, variously functionalized peptide nanotubes have been studied for electronic conductivity,9 alignment of metal clusters,10 and hydrogelation.11 Our group has focused the attention on the peptide nanotubes composed of cyclic β-peptides stacking one over the other through intermolecular hydrogen bonds. The peptide nanotubes bear macrodipole because all the amide hydrogens protrude at the one face of the cyclic skeleton and all the amide carbonyls at the other face.12 The aligned hydrogen bonds along the long axis of the peptide nanotubes are arranged in an additive way of the amide dipoles. Macrodipoles have been shown to accelerate the electron transfer reactions in the direction of the macrodipoles.13–15 Aromatic groups can be introduced into the peptide nanotubes using aromatic amino acids as components of cyclic peptides. Alignment of the functional groups protruding over the peptide nanotube surface has been successfully controlled in a straight or helical way as opposed to a random arrangement of the general peptide nanotubes.16–18 The regular alignment of the functional groups along the peptide nanotube is prerequisite to achieve the optimized performance of the peptide nanotube bundles in order to be organized into the designed structure.
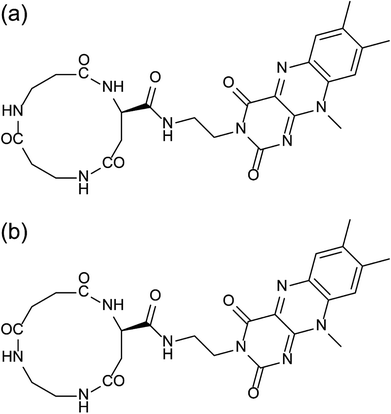
Flavin is a naturally occurring electron mediator, and has been used in several artificial molecular assembling systems, for example, by incorporating it into self-assembled monolayers19–21 and combination with single-walled carbon nanotubes.22 In the present paper, flavin is therefore introduced into peptide nanotubes to study the way how the 3-dimensional arrangement of the flavin groups in the peptide nanotube bundles influences the electric outputs of the molecular assemblies on a gold substrate. Two kinds of cyclic tri-β-peptides of cyclo(β-Asp(flavin)-β-Ala-β-Ala) (C3FAA) and cyclo(β-Asp(flavin)-ethylenediamine-succinic acid) (C3FES) are designed (Fig. 1). Upon peptide nanotube formation, the flavin side chains protruding over the peptide nanotube surface are arranged randomly for the C3FAA nanotube and in a left-handed helical way for the C3FES nanotube under a geometrical constraint of maximizing the number of intermolecular hydrogen bonds.17 The way of the peptide nanotubes being organized into bundles is considered to be amenable to the flavin arrangement in the case that the peptide nanotubes are packed tightly, resulting in different 3-dimensional distributions of the flavin groups between the C3FAA and C3FES nanotube bundles. The surface potential and the piezoelectric property of the peptide nanotube bundles are evaluated by the Kelvin force microscopy (KFM) and the piezoelectric force microscopy (PFM), because these physical properties reflect the 3-dimensional arrangement of dipoles in the peptide nanotube bundles.
2. Experimental
2.1 Peptide synthesis
The conventional liquid phase method was used to synthesize all the peptides (Scheme S1–S3†). All chemicals were purchased from commercial suppliers and used without further purification. The synthesized compounds were identified by 1H NMR spectroscopy and confirmed by mass spectrometry. Synthetic methods along with the results of NMR- and mass-spectroscopies were written in the ESI.†2.2 Spectroscopies and optical microscopy
NMR spectra were measured with a Bruker DPX-400 spectrometer. ESI mass spectra were obtained on Thermo Scientific™ Exactive™ Bench-Top LC-MS Spectrometer and Thermo Scientific™ Exactive™ Plus Bench-Top LC-MS Spectrometer. FT-IR spectroscopy was carried out with a Nicolet 6700 FT-IR spectrometer. Molecular assembly formation in solutions was analyzed by dynamic light scattering (DLS) by using Photal DLS-8000. UV and CD spectra were obtained on a Shimadzu UV-2450 spectrophotometer and a JASCO J600 circular dichroism spectrometer, respectively. The UV and CD spectra were obtained using a quartz optical cell with 1 cm path length at a concentration of 0.05 mM.2.3 Optical microscopy
Optical microscopy was conducted by using an Olympus IX70. A dispersion of crystals was dropped and dried on a slide glass and observed under cross-Nicol configuration. The sensitive tint plate was placed between the crossed polarizers.2.4 Electron diffraction
The electron diffraction patterns were taken with a JEOL JEM-2000EXII (JEOL, Japan) at an accelerating voltage of 100 kV. A drop of the dispersion of crystals was dried on a carbon-coated Cu grid. The electron diffraction patterns were obtained in the microdiffraction mode. The distance in the diffraction patterns was calibrated with the (111) diffraction ring of evaporated Au particles.2.5 Atomic force microscopy (AFM), Kelvin probe force microscopy (KFM) and piezoresponse force microscopy (PFM)
AFM measurements were conducted by an atomic force microscope (Agilent 5500 SPM system) in the acoustic AC mode under ambient atmosphere at room temperature. A dispersion of crystals was dropped and dried on gold mica substrate. Kelvin probe force microscopy (KFM) measurements were performed by an Agilent 5500 scanning probe microscope equipped with a MAC III unit. This system has three lock-in amplifiers which can run multi-frequency measurements. The topography and surface potential signals were recorded at the same time by using a single-pass mode to obtain a high lateral resolution. The cantilevers used for AFM and KFM measurements were Olympus cantilever (Pt, 2.0 N m−1, 70 kHz). PFM measurement was conducted by a piezoresponse force microscope (Bruker Multimode 8) under ambient atmosphere at room temperature. The cantilevers used for PFM measurement were Bruker AFM Probe (MESP-RC-V2, Co/Cr, 5.0 N m−1, 150 kHz).Gold mica substrates were prepared by the thermal evaporation method. Gold (99.99%) was deposited on a mica substrate with a thickness of 1000 Å by a vacuum deposition system (Osaka Vacuum, N-KS350). The gold mica substrate was thermally annealed by a burner before a suspension of cyclic peptide crystals was dropped on it and dried.
The peptide samples on a gold-mica substrate were subjected to a thermal anneal treatment as follows. The samples were heated at 130 °C in a vacuum oven for 30 min followed by cooling down below 60 °C. The samples were taken out from the vacuum oven under dry N2 gas.
3. Results and discussion
3.1 Peptide nanotube formation
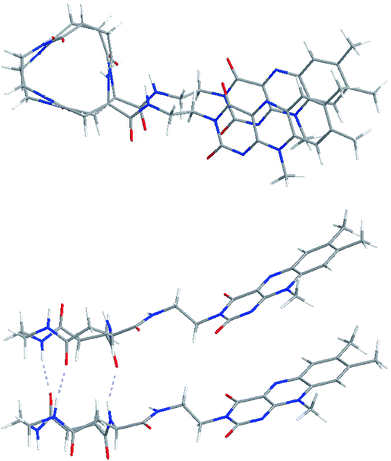
The configuration of the C3FES dimer was calculated by Gaussian09.23 The energy minimized configuration with holding three intermolecular hydrogen bonds show that two flavin chromophores are arranged in a left-handed helical way by a rotation angle of ca. 10 degrees in the C3FES nanotube (Fig. 2). On the other hand, the C3FAA dimer can take three different rotational isomers with holding three intermolecular hydrogen bonds by a rotation angle of 120 degrees (Fig. S3†). These three isomers have the same total energy, suggesting that the flavin side chains protruding over the peptide nanotube are randomly arranged in the C3FAA nanotube (Fig. S4†).The peptide nanotube bundles were prepared by the vapor-diffusion method, where the peptide solution in 1,1,1,3,3,3-hexafluoroisopropa-2-ol (HFIP) was exposed to highly humid atmosphere. FTIR spectra shows amide I, II, and N–H stretching absorptions at 1653, 1554, and 3288 cm−1 for C3FAA crystal and 1639, 1550, and 3286 cm−1 for C3FES (Fig. S5†). These absorptions indicate parallel β-sheet like structures and homogeneous hydrogen bond formations.12,18,24 The crystal rods were identified by observations with the polarized microscopy under a cross Nicol configuration with a tint plate between the two crossed polarizers. The refractive indices along the long axis of the both peptide nanotubes were found to be larger than that along the short axis (Fig. 3).
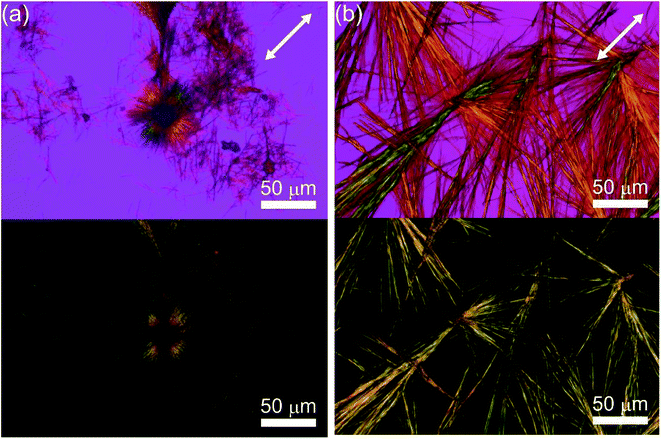 | ||
| Fig. 3 Optical microscopic images of (a) C3FAA and (b) C3FES nanotube bundles with (upper) and without a sensitive tint plate (lower) under a cross Nicol arrangement. | ||
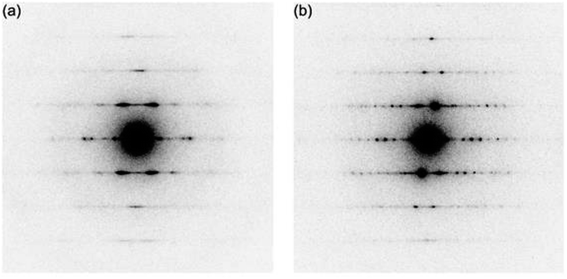
The crystalline rods were subjected to the electron diffraction measurements. The spacing of 4.8 Å along long axis of crystalline rods was identified for both of the C3FAA and C3FES nanotube bundles (Fig. 4), which confirms the peptide nanotube formation through stacking the cyclic β-peptides.17,24 The distances between the peptide nanotubes were found to be 24 Å and 20 Å for the C3FAA and C3FES nanotube bundles, respectively. The tight packing of the C3FES nanotubes may be ascribable to the regular arrangement of the flavin groups on the peptide nanotube surfaces. The better crystalline packing of the C3FES nanotube bundles than the C3FAA nanotube bundles is also supported by the clearer diffraction pattern of the former bundles (Fig. 4).
The arrangement of the flavin groups on the peptide nanotube surface was studied by CD measurements (Fig. 5). C3FAA and C3FES showed similar absorption spectra both in HFIP and a mixed solution of HFIP and water (1/39 v/v). Both cyclic peptides are soluble in HFIP but self-assembled in the presence of the excess water (Fig. S6†). The induced Cotton effect around 450 nm which corresponds to the absorption of the flavin group was observed for C3FES in nearly water (HFIP/water 1/39), supporting that the flavin groups are in a chiral environment of a left-handed helical arrangement as shown in Fig. 2 upon formation of the peptide nanotube. On the other hand, the Cotton effect around 450 nm of C3FAA in nearly water was insignificant, indicating that the flavin groups are randomly distributed on the peptide nanotube surface.
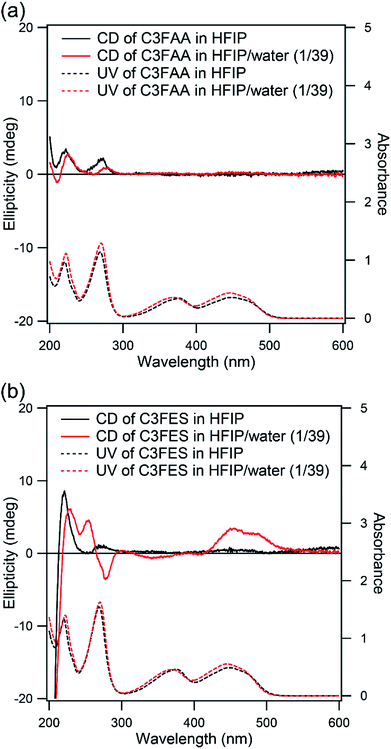 | ||
| Fig. 5 CD (solid line) and UV (dotted line) spectra of (a) C3FAA and (b) C3FES in HFIP (black) and HFIP/water (1/39 v/v) (red). The concentrations were 0.05 mM. | ||
3.2 Surface potential
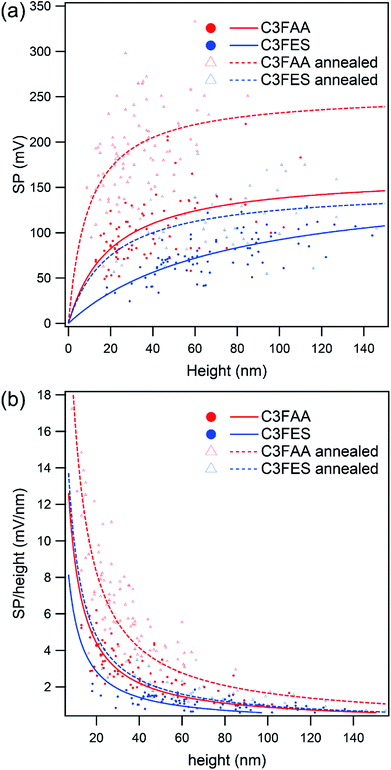
Surface potentials of the peptide nanotube bundles were examined by the Kelvin force microscopy (Fig. S7†). The thicknesses of the nanotube bundles varied from 10 nm to over 100 nm. Fig. 6(a) shows two trends of the relationship between the surface potential and the bundle thickness. One trend is that the surface potentials rise up with increase of the bundle thickness, and approach gradually to plateau levels. The other is higher values of the C3FAA nanotube bundles than the C3FES nanotube bundles when comparing between the bundles with the similar thicknesses. The former trend of the increase of the surface potential with the bundle thickness is interpretable as the total dipole increases with the thickness according to the additivity of the dipoles in the bundles. However, the saturation trend of the surface potential needs to be explained. Further, the latter trend was unexpected in terms of the random orientation of the flavin dipoles in the C3FAA nanotube bundles.The former saturation trend is explainable in terms of the structural regularity of the peptide nanotube bundles. Since the surface potential of the peptide nanotube bundles lying on a gold substrate has an origin in the total dipole across the bundles, the surface potential was divided by the bundle thickness to obtain the surface potential per unit nm as the SP coefficient. Fig. 6(b) depicts clearly the inverse proportionality of the SP coefficient with the bundle thickness. The SP coefficient represents the increase rate of the surface potential, which reflects the total dipole, accompanied by a nm elongation of the bundle thickness. The decline of the SP coefficient keeping a positive sign therefore means that the total dipole increases with increase of the bundle thickness, but the increase rate becomes less sensitive to the increase of the bundle thickness. In the present system to measure the surface potential, the peptide nanotube bundles are lying flat on the gold substrate, meaning that the peptide dipoles of the cyclic peptides contribute less to the surface potential. Accordingly, the flavin dipoles are major to contribute to the surface potential. The peptide nanotube bundles were obtained here by the vapor diffusion method which is not considered suitable for affording high quality large crystals. Consequently, the thicker bundles are poorly controlled in the regular alignment of the flavin dipoles across the bundles, resulting in reaching the plateau levels of the surface potentials with the thickness increase.
The highest surface potential was obtained with the C3FAA nanotube bundles, indicating that there should be a factor influencing the orientation of the flavin dipoles, which were inherently aligned randomly, to remain a vertical dipole component. One possible factor is stabilization of the macrodipole of the nanotube bundles by the mirror image dipole generated in a gold substrate. We therefore estimate the stabilization energy of the macrodipole originated from the intermolecular hydrogen-bond network with the mirror image dipole.25 In the case of the macrodipole lying at the distance of 1.2 nm from the gold surface, which is the half of the neighboring peptide nanotubes in the bundles, the stabilization energy owing to three hydrogen-bond networks is calculated to be ca. 20 kcal at most. With this interaction, the rearrangement of one cyclic peptide in the peptide nanotube by rotation may be difficult to occur, because the rotation requires the simultaneous rearrangement of six intermolecular hydrogen bonds (Fig. S3(a)†), which exceeds over the calculated stabilization energy. However, the stabilization energy may be enough for the flavin groups in contact with a gold substrate to take the stabilized orientation by a local movement. Since the dipole of the flavin group amounts up to 15 debye, the dipole magnitude is enough to generate the observed surface potential.26 The macrodipole of the C3FES nanotube is one third of that of the C3FAA nanotube, leading to less influence on the flavin orientation by the interaction with the mirror image dipole, which is considered to explain the lower surface potential of the C3FES nanotube bundles than the C3FAA nanotube bundles.
Based on the speculation described above, the peptide nanotube bundles were subjected to a thermal anneal treatment for the structural rearrangement under the influence of the gold substrate (Fig. S7†). If there was no effect of the gold substrate on the peptide nanotube organization in the bundles, the flavin groups would be arranged isotropically in the radial direction of the peptide nanotube bundles, leading to decline of the surface potential. The surface potential as well as the SP coefficient of the C3FAA nanotube bundles, however, increase significantly upon the thermal anneal treatment (Fig. 6), supporting the speculation that the gold substrate directs the anisotropic alignment of the flavin groups. With the strong interaction between the dipole-mirror image dipole, PNTs, which are positioned close to gold surface, may come closer to the surface during thermal annealing process by tilting flavin side-chains to parallel to the surface. As a direct consequence of the changes, the flavin dipoles should anisotropically align on the surface, leaving the flavin dipoles pointing to the air side to generate the surface potential. The C3FES nanotube bundles also increase the surface potential, however, which still remains lower than the C3FAA nanotube bundles without the thermal anneal treatment. The low magnitude of the macrodipole of C3FES nanotube is considered to lead to less rearrangement of the flavin side chains.
3.3 Piezoelectricity
The converse piezoelectric coefficient, , was evaluated by the PFM measurements. The
  values of the C3FAA nanotube bundles were less than 1 pm V−1 before and after the thermal anneal treatment, which is low compared with 11.4 pm V−1 of the Phe–Phe microrods27 and ca., 2 pC N−1 of the cyclic hexapeptide nanotube.18 The large surface potential of the C3FAA nanotube bundles is not therefore connected to a good piezoelectric response. The piezoelectric response of the dipolar compounds reflects the structural distortion owing to the torque exerting on the dipole to rotate upon the applied electric field. When the dipoles align parallel and vertically on a gold substrate, a large surface potential will appear, but the piezoelectric response will be poor because of the low torque exerting on the dipoles by the parallel applied electric field. On the other hand, the
  value of the C3FES nanotube bundles became as high as ca. 3 pm V−1 after the thermal anneal treatment. There are two kinds of the dipoles in the C3FES nanotube, one is peptide bonds and the other is the flavin groups. The C3FES nanotube contains one net hydrogen-bond network, and the macrodipole of the C3FES is 1/3-fold of the C3FAA. The peptide dipoles are not therefore the major reason for the increase of the
  value. The flavin dipole of 15 debye, which is comparable with the sum of the three peptide bonds in C3FAA, is considered to be a major factor to induce the piezoelectric response as a result of the structural distortion upon the applied electric field. The flavin groups are arranged in a left-handed helical way on the nanotube surface, which cannot contribute to the surface potential due to no remaining vertical component in the total sum of the flavin dipoles. However, the helical arrangement is suited for inducing the piezoelectric response due to the non-centro-symmetric structure. With the thermal anneal treatment, it is considered that the arrangement of the C3FES nanotubes in the bundles should increase the structural regularity in a non-centro-symmetric way to raise the converse piezoelectric coefficient (Fig. 7).
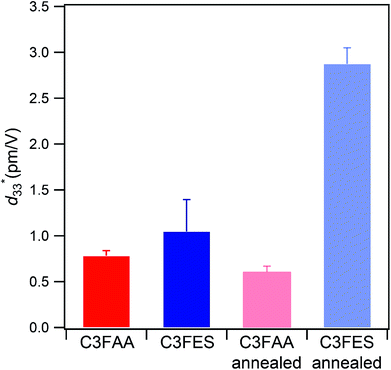 | ||
Fig. 7 The average measured  values with their standard deviations of the C3FAA and C3FES nanotube bundles before and after the thermal anneal treatment. values with their standard deviations of the C3FAA and C3FES nanotube bundles before and after the thermal anneal treatment. | ||
4. Conclusion
Two kinds of the C3FAA and C3FES nanotube bundles were prepared here for the different 3-dimensional arrangements of the peptide dipoles but nearly the same density. Another kind of flavin dipoles were also arranged in random and left-handed helical ways along the C3FAA and C3FES nanotubes, respectively. Alignment of the flavin dipoles was evaluated by the KFM measurements on the peptide nanotube bundles lying flat on a gold substrate. Unexpectedly the surface potential was found to be larger with the C3FAA nanotube bundles with a random arrangement of the flavin dipoles. The surface potential increased with the bundle thickness, but the increase rate with the thickness was diminished with an inverse relation with the thickness, meaning the influence of the gold substrate. The C3FAA nanotube has a macrodipole, which generates a mirror image dipole in the gold substrate. The strong dipole–image dipole interaction can possibly make the flavin groups rearrange in the C3FAA nanotube in contact with the gold substrate into an anisotropic alignment in the bundles, which contribute to the surface potential. The thermal anneal treatment increased the surface potential, supporting that the gold substrate directs the arrangement of the peptide nanotubes in the bundles. On the other hand, the piezoelectric response became large with the C3FES nanotube bundles after the thermal anneal treatment. Since the arrangement of the flavin groups along the C3FES nanotube is inherently regular to be in a left-handed helical way, the thermal anneal treatment should contribute to the regularity of the arrangement of the C3FES nanotubes in the whole bundles. Consequently, the arrangement of the flavins is strengthened about the non-centro-symmetricity in the structure to make the piezoelectric response larger. The control of the structural arrangement of the dipoles is therefore important to obtain the nanomaterials with tens nm thickness on a gold substrate, which elicit the demanding electrical outputs.Author contributions
The manuscript was written through contributions of all authors. All authors have given approval to the final version of the manuscript.Conflicts of interest
The authors declare no competing financial interest.Acknowledgements
This research was supported partially by JSPS KAKENHI Grant Numbers JP16H02279 and JP18K19000, and Analysis and Development System for Advanced Materials, Research Institute for Sustainable Humanosphere (Prof. Junji Sugiyama), Kyoto University.References
- A. Facchetti, Nat. Mater., 2013, 12, 598–600 CrossRef CAS PubMed.
- H. Sirringhaus, Adv. Mater., 2014, 26, 1319–1335 CrossRef CAS PubMed.
- H. Yan, Z. H. Chen, Y. Zheng, C. Newman, J. R. Quinn, F. Dotz, M. Kastler and A. Facchetti, Nature, 2009, 457, 679–686 CrossRef CAS PubMed.
- D. Cho, H. Lee, S. Shekhar, M. Yang, J. Y. Park and S. Hong, Sci. Rep., 2017, 7, 43411 CrossRef CAS PubMed.
- Z. T. Xie, I. Baldea, A. T. Demissie, C. E. Smith, Y. F. Wu, G. Haugstad and C. D. Frisbie, J. Am. Chem. Soc., 2017, 139, 5696–5699 CrossRef CAS PubMed.
- S. Ahmed, K. N. A. Sankar, B. Pramanik, K. Mohanta and D. Das, Langmuir, 2018, 34, 8355–8364 CrossRef CAS PubMed.
- M. R. Ghadiri, J. R. Granja, R. A. Milligan, D. E. Mcree and N. Khazanovich, Nature, 1993, 366, 324–327 CrossRef CAS PubMed.
- T. D. Clark, L. K. Buehler and M. R. Ghadiri, J. Am. Chem. Soc., 1998, 120, 651–656 CrossRef CAS.
- J. Montenegro, C. Vazquez-Vazquez, A. Kalinin, K. E. Geckeler and J. R. Granja, J. Am. Chem. Soc., 2014, 136, 2484–2491 CrossRef CAS PubMed.
- M. Cuerva, R. Garcia-Fandino, C. Vazquez-Vazquez, M. A. Lopez-Quintela, J. Montenegro and J. R. Granja, ACS Nano, 2015, 9, 10834–10843 CrossRef CAS PubMed.
- A. Méndez-Ardoy, J. R. Granja and J. Montenegro, Nanoscale Horiz., 2018, 3, 391–396 RSC.
- F. Fujimura, M. Fukuda, J. Sugiyama, T. Morita and S. Kimura, Org. Biomol. Chem., 2006, 4, 1896–1901 RSC.
- T. Morita, S. Kimura, S. Kobayashi and Y. Imanishi, J. Am. Chem. Soc., 2000, 122, 2850–2859 CrossRef CAS.
- S. Yasutomi, T. Morita, Y. Imanishi and S. Kimura, Science, 2004, 304, 1944–1947 CrossRef CAS PubMed.
- H. Uji, T. Morita and S. Kimura, Phys. Chem. Chem. Phys., 2013, 15, 757–760 RSC.
- Y. Ishihara and S. Kimura, Biopolymers, 2012, 98, 155–160 CrossRef CAS PubMed.
- Y. Tabata, S. Mitani and S. Kimura, J. Pept. Sci., 2016, 22, 391–396 CrossRef CAS PubMed.
- Y. Tabata, H. Uji, T. Imai and S. Kimura, Soft Matter, 2018, 14, 7597–7604 RSC.
- G. Cooke, F. M. A. Duclairoir, P. John, N. Polwart and V. M. Rotello, Chem. Commun., 2003, 2468–2469 RSC.
- E. J. Calvo, M. S. Rothacher, C. Bonazzola, I. R. Wheeldon, R. C. Salvarezza, M. E. Vela and G. Benitez, Langmuir, 2005, 21, 7907–7911 CrossRef CAS PubMed.
- S. T. Caldwell, G. Cooke, S. G. Hewage, S. Mabruk, G. Rabani, V. Rotello, B. O. Smith, C. Subramani and P. Woisel, Chem. Commun., 2008, 4126–4128 RSC.
- M. Mollahosseini, E. Karunaratne, G. N. Gibson, J. A. Gascon and F. Papadimitrakopoulos, J. Am. Chem. Soc., 2016, 138, 5904–5915 CrossRef CAS PubMed.
- M. J. Frisch, G. W. Trucks, H. B. Schlegel, G. E. Scuseria, M. A. Robb, J. R. Cheeseman, G. Scalmani, V. Barone, G. A. Petersson, H. Nakatsuji, X. Li, M. Caricato, A. Marenich, J. Bloino, B. G. Janesko, R. Gomperts, B. Mennucci, H. P. Hratchian, J. V. Ortiz, A. F. Izmaylov, J. L. Sonnenberg, D. Williams-Young, F. Ding, F. Lipparini, F. Egidi, J. Goings, B. Peng, A. Petrone, T. Henderson, D. Ranasinghe, V. G. Zakrzewski, J. Gao, N. Rega, G. Zheng, W. Liang, M. Hada, M. Ehara, K. Toyota, R. Fukuda, J. Hasegawa, M. Ishida, T. Nakajima, Y. Honda, O. Kitao, H. Nakai, T. Vreven, K. Throssell, J. A. Montgomery Jr, J. E. Peralta, F. Ogliaro, M. Bearpark, J. J. Heyd, E. Brothers, K. N. Kudin, V. N. Staroverov, T. Keith, R. Kobayashi, J. Normand, K. Raghavachari, A. Rendell, J. C. Burant, S. S. Iyengar, J. Tomasi, M. Cossi, J. M. Millam, M. Klene, C. Adamo, R. Cammi, J. W. Ochterski, R. L. Martin, K. Morokuma, O. Farkas, J. B. Foresman, and D. J. Fox, Gaussian Inc., 2016.
- H. Uji, H. Kim, T. Imai, S. Mitani, J. Sugiyama and S. Kimura, Biopolymers, 2016, 106, 275–282 CrossRef CAS PubMed.
- W. G. J. Hol, Prog. Biophys. Mol. Biol., 1985, 45, 149–195 CrossRef CAS PubMed.
- S. D. Evans and A. Ulman, Chem. Phys. Lett., 1990, 170, 462–466 CrossRef CAS.
- V. Nguyen, K. Jenkins and R. S. Yang, Nano Energy, 2015, 17, 323–329 CrossRef CAS.
Footnote |
| † Electronic supplementary information (ESI) available: Syntheses, NMR, energy minimization, ATR-FTIR, DLS, AFM, KFM, Coordinates of the optimized geometry. See DOI: 10.1039/c8ra10466b |
| This journal is © The Royal Society of Chemistry 2019 |

