 Open Access Article
Hierarchical TiO2 microspheres composed with nanoparticle-decorated nanorods for the enhanced photovoltaic performance in dye-sensitized solar cells†
Xiong Hea,
Jingyu Zhanga,
Yan Guoa,
Jinghua Liua and
Xin Li *ab
*ab
aMIIT Key Laboratory of Critical Materials Technology for New Energy Conversion and Storage, School of Chemistry and Chemical Engineering, Harbin Institute of Technology, Harbin 150090, China. E-mail: lixin@hit.edu.cn; Tel: +86-0451-86282153
bState Key Lab of Urban Water Resource and Environment, Harbin Institute of Technology, Harbin 150090, China
First published on 23rd January 2019
Abstract
Hierarchical TiO2 microspheres composed of nanoparticle-decorated nanorods (NP-MS) were successfully prepared with a two-step solvothermal method. There were three benefits associated with the use of NP-MS as a photoanode material. The decoration of nanoparticles improved the specific surface area and directly enhanced the dye loading ability. Rutile nanorods serving as electron transport paths resulted in fast electron transport and inhibited the charge recombination process. The three-dimensional hierarchical NP-MS structure supplied a strong light scattering capability and good connectivity. Thus, the hierarchical NP-MS combined the beneficial properties of improved scattering capability, dye loading ability, electron transport and inhibited charge recombination. Attributed to these advantages, a photoelectric conversion efficiency of up to 7.32% was obtained with the NP-MS film-based photoanode, resulting in a 43.5% enhancement compared to the efficiency of the P25 film-based photoanode (5.10%) at a similar thickness. Compared to traditional photoanodes with scattering layers or scattering centers, the fabrication process for single layered photoanodes with enhanced scattering capability was very simple. We believe the strategy would be beneficial for the easy fabrication of efficient dye-sensitized solar cells.
1. Introduction
With increasing global demands for green energy, the utilization of solar energy to generate power is a promising and efficient technique that has attracted much attention.1,2 As one of the promising photovoltaic devices, dye sensitized solar cells (DSSCs) possess the advantages of low cost, high conversion efficiency, easy fabrication and high stability.3–6 The highest recorded photoelectric conversion efficiency for DSSCs with collaborative sensitization was 14.7%.7 As a key component of DSSCs, photoanodes play an important role in dye loading, light harvesting, electron injection, electron transport and collection processes, thus significantly affecting the photocurrent, photovoltage and photovoltaic conversion efficiency.8,9Titanium oxide is one of the most popular photoanode materials due to the matching band structure, high electronic mobility, non-toxicity and good stability.10 The size, morphology and phase of titanium oxide can greatly influence the photovoltaic performance due to the dye loading capability as well as electronic and optical properties. The size of TiO2 can determine the specific surface area, which influences the dye loading capability. Meanwhile, the morphology of photoanode materials could affect the roughness, dye loading, scattering capability and electron transfer, thus influencing the light harvesting and collection efficiencies. Furthermore, the phase mixture of TiO2 is known to have good charge separation efficiency for enhanced photovoltaic performance.11,12 The familiar photoanode materials include commercial TiO2 nanoparticles with a high specific surface area. However, the TiO2 nanoparticle-based photoanode was limited by the high light transmittance and grain boundaries that resulted from its small size.13–19 To improve the light harvesting efficiency, the light scattering capability was considered in the design of efficient DSSCs.
The scattering capability could significantly improve the light-harvesting efficiency of solar cells by extending light paths with large-sized TiO2 acting as a scattering layer and/or scattering center.20–22 However, large-sized titanium oxides with a super-scattering capability usually have less specific surface area.23,24 The connectivity among large-sized titanium oxides is usually loose, resulting in an increased charge recombination and bad photovoltaic performance.25 Photoanode fabrication with enhanced scattering capability is complex, which limits their applications.26–28 Photoanodes with a scattering layer need more steps in the calcining process and doctor-blade or spin-coating process. Photoanodes with scattering centers require screening for the positive enhancement of optical and electronic properties. Therefore, a single-layered photoanode with a high scattering capability and large surface area is expected. Because large-sized titanium oxides with a strong scattering capability generally possess a low dye-loading capability and loose connectivity, the poor photovoltaic performance of pure large-sized TiO2-based photoanodes can be imagined. Thus, the hierarchical TiO2 microstructure composed of a one-dimensional (1D) or two-dimensional (2D) structure serves as a promising material. The small sized 1D or 2D blocking units could improve the specific surface area, increase the speed of charge separation and electron transport.29–31 The micro-sized hierarchical aggregate could enhance light scattering, dye loading, and the interconnection capability.32,33 As a consequence, DSSCs employing hierarchical TiO2 structures as photoanode materials could demonstrate a superior photovoltaic performance. For example, Kim et al. obtained a conversion efficiency of 8.0% with hierarchical tree-like TiO2 nanorods, which is significantly higher than that of commercially-available TiO2.34
In this study, hierarchical TiO2 microspheres consisting of anatase TiO2 nanoparticle-decorated rutile TiO2 nanorods (marked as NP-MS) were successfully prepared with a two-step solvothermal method. The single-layer photoanode was easily fabricated with NP-MS using the doctor blading method. The dye loading capability was improved due to the decoration of TiO2 nanoparticles. The large-sized NP-MS enhanced the light scattering capability according to the Mie theory. Faster electron transport paths were provided by the nanorods, which promoted electron transfer and reduced charge recombination. Due to the enlarged specific surface area and improved light scattering capability, NP-MS based solar cells exhibited an enhanced photovoltaic performance and light harvesting efficiency compared to pure P25-based cells.
2. Experimental
2.1 Synthesis of NP-MS
According to our previous study, the precursor was prepared with microspheres composed of nanorods (MS).35 5.0 mL tetrabutyl titanate, 1.0 mL hydrochloric acid, 1.0 mL of 2 M TiCl4 aqueous solution, and 25.0 mL toluene were added in a beaker with vigorous stirring. MS was synthesized by keeping the above mixture in the oven at 160 °C for 4 h. Next, 0.1 g of as-prepared MS was added to 40 mL of isopropanol. After ultrasonic processing for 15 min, 0.3 mL diethylenetriamine and 0.3 mL titanium isopropoxide were added dropwise into the mixture. The mixture was transferred into a teflon-lined autoclave with a 50 mL capacity in the oven at 200 °C for 24 h. The products were collected after centrifugation. NP-MS were obtained after calcination at 400 °C for 2 h.2.2 Fabrication of DSSCs
The preparation of the series TiO2 paste and the pre-treatment of the FTP glasses were similar to our previous work.35,36 The photoanodes were fabricated with as-prepared TiO2 pastes using the doctor blading method. TiO2 photoanode films were then calcined in a muffle furnace at 450 °C for 15 min and 500 °C for 15 min. After cooling, the photoanode was further immersed in a N719 solution for 24 h. The counter electrodes were prepared by the homogeneous diffusion of H2PtCl6 solution on FTO glasses and calcination in a muffle furnace at 450 °C for 15 min. After being assembled by the heat sealing method, complete DSSCs were fabricated with an electrolyte injection into the space between the dyed photoanode and the counter electrode.2.3 Characterization and measurements
Images of the MS and NP-MS were captured with field emission scanning electron microscopy (SEM, S4800 HSD) to explore the morphological information. The nanoscale information was further provided by a transmission electron microscope (TEM, Tecnai G2 F20). X-ray diffraction patterns (XRD) were obtained to identify the phase with an X-ray diffractometer (XRD-6000, Shimadzu). The absorption spectra of the desorbed dye molecules in 0.1 M NaOH and the reflectance spectra of the series films were measured with a UV-Vis spectrometer (TU1901, Beijing Purkinje). The nitrogen adsorption–desorption isotherms were measured with an Automated Surface Area & Pore Size Analyzer (ASAP 2020 V3.04H). The pore size distributions were obtained with the Barrett–Joyner–Halenda (BJH) method. J–V characteristic curves were measured under illustration with a 100 mW cm−2 light intensity and dark condition. Electrochemical impedance spectroscopy (EIS) analysis was applied at a bias potential of −0.75 V with the frequency ranging from 0.1 Hz to 100 kHz in a dark environment.37,38 Open circuit voltage decay (OCVD) curves were recorded after turning off the simulated sunlight and during relaxation to the dark equilibrium. These electrochemical analysis were all acquired from the electrochemical workstation (VersaSTAT 3, Ametek, USA).3. Results and discussions
3.1 Characterization of NP-MS
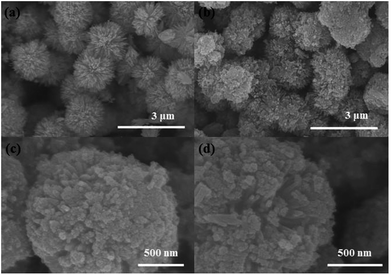
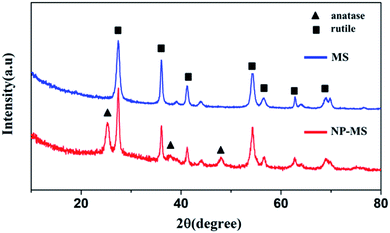
The morphologies of the as-prepared MS and NP-MS were characterized by SEM images as shown in Fig. 1. From Fig. 1a, it could be determined that the as-prepared MS were uniform with a mean diameter of 1.8 μm. MS were constructed with needle-like nanorods, which was proven by our previous study. With isopropanol as the etherifying agent, the controlled hydrolysis reaction of titanium isopropoxide was applied with diethylenetriamine. Therefore, nanoparticles with an exposed (001) surface were decorated on the MS.39 The corresponding SEM images of the NP-MS are shown in Fig. 1b–d. From the low magnification SEM images of NP-MS, it can be seen that the mean size of the NP-MS was about 1.8 μm, which is similar to the MS. As shown in Fig. 1c and d, nanoparticles were successfully decorated on the surface of the MS. The voids between the nanorods still existed in the NP-MS.The XRD patterns of the as-prepared MS and NP-MS were examined to identify their crystallographic structures as shown in Fig. 2. The crystal phase of the MS was affirmed to be a typical tetragonal rutile phase based on the Bragg diffraction peaks in the XRD patterns. These Bragg peaks corresponded to the (110), (101), (111), (211), (220), (002) and (301) planes indexed with the standard rutile pattern (JCPDS #21-1276). According to the XRD pattern of NP-MS, besides the rutile Bragg diffraction peaks, the corresponding anatase Bragg diffraction peaks (JCPDS #21-1272) of the typical (101), (004), and (200) planes were discovered. The results suggest that anatase particles were successfully decorated on the rutile nanorods.
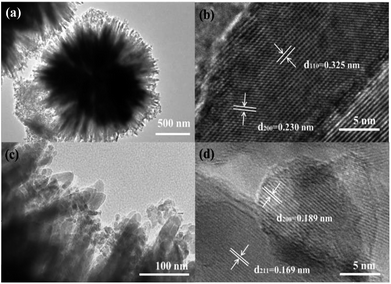
To further investigate the nanoscale information for the NP-MS, TEM images of the NP-MS are shown in Fig. 3. The low magnification TEM image of the NP-MS (Fig. 3a) further demonstrated that the obtained NP-MS exhibited a uniform spherical structure with the size of 1.8 μm. According to the TEM images (Fig. 3a and c), the nanoparticles were decorated on top of the nanorods. The HRTEM image of the TiO2 nanorods (Fig. 3b) indicated that the lattice fringe of the nanorod trunk was 0.325 nm, corresponding to the d110 spacing of the rutile phase. This suggests that the nanorods grew along the [001] direction. From Fig. 3d, it could be obtained that nanoparticles with the size of ∼8 nm were decorated on the nanorod. The spacing between the adjacent lattice fringes was approximately 0.189 nm and 0.169 nm, corresponding to the interplanar distance of the (200) planes in the typical anatase phase and (211) planes in the typical rutile phase. This result confirms that anatase nanoparticles were successfully decorated on the rutile nanorods, which was in accordance with XRD analysis.
In order to explore the influence of the decoration of the nanoparticles on the specific surface area, the nitrogen adsorption–desorption isotherms of MS and NP-MS were measured. As shown in Fig. 4a, the isotherms were type IV, which indicated the presence of mesopores with existing hysteresis loops at high pressures. The higher adsorption of the NP-MS at the high relative pressure exposed the decreasing size of the mesopores and higher specific surface area compared to the MS. Based on the pore size distribution curves shown in Fig. 4b, the average pore size of the MS and NP-MS were 8.1 nm and 7.8 nm, respectively. The specific surface area of 37.4 m2 g−1 for MS and 80.7 m2 g−1 for NP-MS were obtained according to the BJH method. An enhanced dye loading capability was achieved due to the higher specific surface area for NP-MS compared to that of P25 (∼50 m2 g−1). Thus, the decoration of TiO2 nanoparticles greatly enhanced the specific surface area, leading to a positively enhanced dye adsorption ability and improved the photocurrent density.
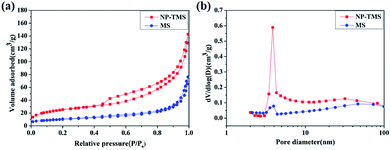 | ||
| Fig. 4 (a) N2 adsorption/desorption isotherm and (b) pore size distribution curves of the MS and NP-MS. | ||
3.2 Characterization of photoanode film
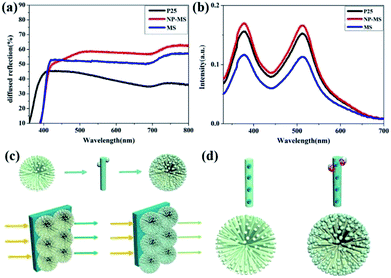
To investigate the light scattering capability of the MS and NP-MS, the diffused reflectance of single-layered P25, MS and NP-MS films without N719 dye loading were measured by diffuse reflectance spectroscopy and is shown in Fig. 5a. The diffused reflectance spectra of the MS and NP-MS were higher than that of P25 in the 400–800 nm range, which indicated a better scattering capability for large sizes and the hierarchical effect. The NP-MS showed a higher diffused reflectance compared to that of MS, which may be attributed to the integrated scattering effect of numerous 0-dimensional anatase nanoparticles, one dimensional rutile nanorods and three dimensional hierarchical microspheres. Rutile TiO2 nanorods possessed a high refractive index, which could improve light refraction and enhance the light scattering capability.40 The series absorption spectra of the dye molecules with the fabricated dyed photoanode films immersed in a 0.1 M NaOH solution are expressed in Fig. 5b. The amount of dye molecules is proportional to the intensity at the 532 nm peak. According to the relationship between the dye loading amount and peak intensity, the NP-MS based photoanode exhibited the highest dye loading capability for its improved specific surface area. In addition, the MS-based photoanode showed a lower dye loading amount compared to the P25 based photoanode for its less specific surface area. The schematic diagram of the MS and NP-MS based photoanodes are shown in Fig. 5c, which indicated a higher light harvesting efficiency for the NP-MS film owing to the TiO2 nanoparticle decoration. Fig. 5d shows the schematic diagram of the electron transport. In the pure MS film, electrons were transported in the direction of the TiO2 nanorods. However, the decoration of anatase TiO2 in the NP-MS complicated the electron transport process under illumination.41 The enhanced dye loading capability of the NP-MS lead to increased photogenerated electrons. However, this increased grain boundary resulted in the charge recombination between TiO2 nanoparticles and the electrolyte. In general, the scattering, dye loading capability and electron transport of the NP-MS based photoanode was enhanced compared to P25.3.3 Photovoltaic performances of DSSCs
Fig. 6a shows the characterized J–V curves of the series DSSCs with the photoanode thickness of about 17 μm under a 100 mW cm−2 illumination. The corresponding calculated parameters (short-circuit current density (JSC), open-circuit voltage (VOC), fill factor (FF), conversion efficiency (η)) and the amount of loading dye molecules are listed in Table 1. The conversion efficiency for the pure NP-MS up to 7.32% was higher than those for P25 (5.10%) and MS (3.62%). The order of increasing open circuit voltage was as follows: MS (793 mV) > NP-MS (787 mV) > P25 (698 mV). This phenomenon can be explained by the reduced charge recombination and larger pore size of the MS and NP-MS compared to P25, leading to positive shift in the Fermi level.42–44 The photocurrent density was strongly associated with the dye loading amount and scattering capability. The dye loading ability was analyzed using the UV-Vis absorption spectrum according to the Lambert–Beer law. The dye loading capability was tightly associated with the specific surface area. Thus, due to the enhanced specific surface area and scattering capability, NP-MS based DSSC exhibited a larger value for the JSC compared to P25 and MS. Fig. 6b records the dark currents for the series DSSCs under a dark condition, indicating the recombination of electrons in DSSCs between the photoanode and the electrolyte.45 The dark current for the NP-MS based cell was higher than that of the P25 based cell for an applied voltage, indicating higher charge-recombination resistance. This result demonstrated the reduced interfacial electron recombination process between the photoanode and the electrolyte for MS and NP-MS based cells.46 Compared with the previous reports about single layered and multi-layered photoanodes in recent two years as shown in Table S1,†33,47–53 our work presents a superior photovoltaic performance for the single layered photoanode. This can be attributed to the enlarged specific surface area by nanoparticle decoration, enhanced scattering capability and electron transfer paths provided by nanorods.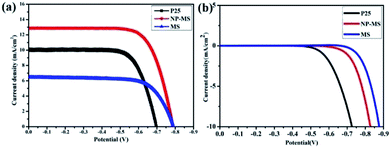 | ||
| Fig. 6 J–V characteristics of DSSCs (a) under illumination with light intensity of 100 mW cm−2 and (b) in the dark condition. | ||
| Photoanode | VOC (mV) | JSC (mA cm−2) | FF (%) | η (%) | Dye loading (nmol cm−2) |
|---|---|---|---|---|---|
| P25 | 698 | 10.1 | 72.2 | 5.10 | 331.7 |
| NP-MS | 787 | 12.8 | 72.7 | 7.32 | 365.6 |
| MS | 793 | 6.5 | 70.8 | 3.62 | 254.8 |
3.4 EIS analysis
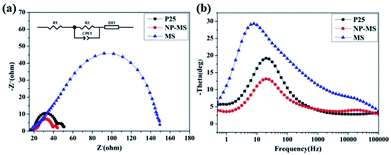
To explore the electron dynamical process among the dyed TiO2/electrolyte interface, DSSCs based on pure P25, MS and NP-MS films were characterized with EIS methods under a dark condition. The corresponding Nyquist and Bode phase plots at the bias of −0.75 V and frequency range between 0.1 Hz to 0.1 MHz are shown in Fig. 7. The insert of Fig. 7a is the equivalent circuit built in the ZView software with the extended element model (DX type 11-Bisquert #2)54,55 and the corresponding fitted equivalent circuit data are shown in Table 2. Bisquert and Kern proposed the model including diffusion coupled with a homogeneous reaction with a continuity equation (as shown in eqn (S1)†).56–58 In this equivalent circuit model, the equivalent circuit included components of R1 (series resistance), R2 (resistance of Pt counter electrode), CPE1 (double layer capacitance of Pt counter electrode) and DX1 (a complex electronic component composed with rt, rr, and Cp as shown in Fig. S1†). The interfacial electron transport resistance, Rt, and charge recombination resistance, Rr, were obtained by Rt = rtl, and Rr = rr/l, respectively. In the Nyquist plots for the DSSCs, three distinct semicircles were discovered, corresponding to the interfacial electron transport and recombination processes among the electrolyte, the dyed photoanode, and the counter electrode.59 The third semicircle for the NP-MS based solar cell showed a smaller diameter compared to that of the P25 based solar cell, which indicates enhanced electrolyte diffusion. After the simulation with the equivalent circuit model, the photoanode of NP-MS exhibited minimum charge-transport resistance (6.4 Ω) compared to those of P25 (7.5 Ω) and MS (29.0 Ω), indicating a fast electron transport process in the photoanode. This result can be explained by the electron transport paths provided by the nanorods and the good connection for the decorated nanoparticles. The charge recombination resistance for the NP-MS (29.25 Ω) was larger than that of P25 (24.88 Ω), implying a reduced electron recombination process. However, the charge recombination resistance for the NP-MS was lower than that of MS (56.77 Ω), which could be attributed to the increased grain boundaries for the decoration of the anatase nanoparticles.| Photoanode | R1 (Ω) | Rt (Ω) | Rr (Ω) | fmax (Hz) | τn (ms) | Ln (μm) | ηcc (%) |
|---|---|---|---|---|---|---|---|
| P25 | 14.30 | 7.5 | 24.88 | 21.70 | 7.33 | 18.2 | 70 |
| NP-MS | 17.56 | 6.4 | 29.25 | 20.20 | 7.88 | 21.4 | 78 |
| MS | 16.37 | 29.0 | 56.77 | 8.00 | 19.90 | 14.0 | 49 |
The Bode plots of the series DSSCs are shown in Fig. 7b, which indicates the frequency peaks of various interfacial charge transport processes. The equation used to calculate the electron lifetime (τn) based on the frequency (fmax) located at the mid-frequency peak is expressed as follows: τn = 1/(2πfmax). The larger electron lifetime for the photoanodes suggests that photogenerated electrons were transported over longer distances and reduced the charge recombination probability. According to the above-mentioned equation, the electron lifetime of the MS was enlarged for the reduced charge recombination. Compared to P25, the electron lifetime of the NP-MS was enhanced for the provided electron transport paths by the nanorods. However, the electron lifetime of the NP-MS was shorter than the MS, which may be attributed to the increased grain boundaries for the decoration of the nanoparticles. Two parameters, the effective diffusion length (Ln) and charge collection efficiency (ηcc), were used to evaluate the performance of DSSC and express the competition between electron transport and the charge recombination processes. The Ln value was calculated with the equation: Ln = L(Rr/Rt)(1/2), and the ηcc value was demonstrated as: ηcc = 1 − Rt/Rr. The relevant Ln and ηcc of the series photoanodes are shown in Table 2. Due to the electron transfer paths provided by the nanrods and the good compactness from the nanoparticle decoration, the NP-MS based photoanode exhibited an enhanced Ln, which was favorable for rapid electron transport. In addition, the NP-MS possessed an optimal ηcc, which suggests a faster electron transport and a reduced charge recombination.
The electron recombination kinetics were further characterized with an OCVD measurement. The decay in the voltage demonstrated the decrease in the photoelectron concentration on the photoanode, which was attributed to charge recombination. VOC decay curves of different DSSCs recorded after the relaxation to the dark equilibrium are shown in Fig. 8a. The decay rate for the VOC in the MS and NP-MS film based photoanodes was much slower than that of P25. This result suggests reduced charge recombination kinetics and a prolonged electron lifetime. The electron lifetime (τn), which quantifies the extent of electron recombination with the redox electrolyte was calculated as follows:60,61 τn = −(kBT)((dVOC)/dt)(−1)/e, where kB is the Boltzmann's constant, e is the elementary charge and T is the temperature. The as-calculated response times, τn, as a function of the Voc for the three types of DSSCs are displayed in Fig. 8b. Fig. 8b demonstrates the dependency of the electron lifetime on the open circuit voltage for the series DSSCs. The result shows that the electron lifetime of the MS and NP-MS was higher than that of P25, indicating reduced electron recombination with the redox electrolyte. This phenomenon could be attributed to the nanorods providing fast electron transport paths.
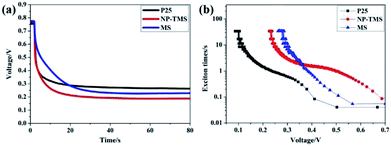 | ||
| Fig. 8 (a) The open-circuit voltage decay profiles and (b) the electron lifetime-VOC curves of DSSCs. | ||
4. Conclusion
The synthesis of TiO2 microspheres with anatase nanoparticle-decorated rutile nanorods was successfully accomplished with a two-step solvothermal method. Attributed to the decoration of anatase TiO2 nanoparticles, the specific surface area, dye loading and light scattering capabilities were improved. Meanwhile, the nanorods provided fast electron transport paths, which significantly enhanced electron transport and reduced charge recombination. The single-layered photoanode based on P25, MS and NP-MS were easily fabricated. The resultant photovoltaic conversion efficiency of up to 7.32% for NP-MS was achieved, with a 43.5% enhancement compared to P25 films based photoanode at a similar thickness. We believe this strategy could be applied to efficient dye-sensitized solar cells.Conflicts of interest
The authors declare no competing financial interest.Acknowledgements
We are grateful for the financial support of this research from the National Natural Science Foundation of China (51779065 and 51579057) and the State Key Laboratory of Urban Water Resource and Environment, Harbin Institute of Technology (2016DX07).References
- S. L. Chen, A. C. Xu, J. Tao, H. J. Tao, Y. Z. Shen, L. M. Zhu, J. J. Jiang, T. Wang and L. Pan, Green Chem., 2016, 18, 2793–2801 RSC.
- M. M. Lee, J. Teuscher, T. Miyasaka, T. N. Murakami and H. J. Snaith, Science, 2012, 338, 643–647 CrossRef CAS PubMed.
- B. O'regan and M. Grfitzeli, Nature, 1991, 353, 737–740 CrossRef.
- A. Mishra, M. K. R. Fischer and P. Baeuerle, Angew. Chem., Int. Ed., 2009, 48, 2474–2499 CrossRef CAS PubMed.
- M. K. Nazeeruddin, A. Kay, I. Rodicio, R. Humphry-Baker, E. Mueller, P. Liska, N. Vlachopoulos and M. Graetzel, J. Am. Chem. Soc., 1993, 115, 6382–6390 CrossRef CAS.
- U. Bach, D. Lupo, P. Comte, J. E. Moser, F. Weissortel, J. Salbeck, H. Spreitzer and M. Gratzel, Nature, 1998, 395, 583–585 CrossRef CAS.
- K. Kakiage, Y. Aoyama, T. Yano, K. Oya, J.-i. Fujisawa and M. Hanaya, Chem. Commun., 2015, 51, 15894–15897 RSC.
- Y. Bai, I. Mora-Sero, F. De Angelis, J. Bisquert and P. Wang, Chem. Rev., 2014, 114, 10095–10130 CrossRef CAS PubMed.
- H. Y. Chen, D. B. Kuang and C. Y. Su, J. Mater. Chem., 2012, 22, 15475–15489 RSC.
- A. Hagfeldt, G. Boschloo, L. Sun, L. Kloo and H. Pettersson, Chem. Rev., 2010, 110, 6595–6663 CrossRef CAS PubMed.
- A. Subramanian, C. Y. Ho and H. Wang, J. Alloys Compd., 2013, 572, 11–16 CrossRef CAS.
- J. Xu, J. Jin, Z. Ying, W. Shi and T. Peng, RSC Adv., 2015, 5, 32536–32545 RSC.
- Z. S. Wang, H. Kawauchi, T. Kashima and H. Arakawa, Coord. Chem. Rev., 2004, 248, 1381–1389 CrossRef CAS.
- A. Usami, Sol. Energy Mater. Sol. Cells, 2000, 62, 239–246 CrossRef CAS.
- S. Hore, P. Nitz, C. Vetter, C. Prahl, M. Niggemann and R. Kern, Chem. Commun., 2005, 2011–2013 RSC.
- H. Niu, S. Zhang, R. Wang, Z. Guo, X. Shang, W. Gan, S. Qin, L. Wan and J. Xu, J. Phys. Chem. C, 2014, 118, 3504–3513 CrossRef CAS.
- J. Chen, C. Li, F. Xu, Y. Zhou, W. Lei, L. Sun and Y. Zhang, RSC Adv., 2012, 2, 7384–7387 RSC.
- X. Mao, R. Zhou, S. Zhang, L. Ding, L. Wan, S. Qin, Z. Chen, J. Xu and S. Miao, Sci. Rep., 2016, 6, 19390–19400 CrossRef CAS PubMed.
- K. Basu, D. Benetti, H. Zhao, L. Jin, F. Vetrone, A. Vomiero and F. Rosei, Sci. Rep., 2016, 6, 23312–23322 CrossRef CAS PubMed.
- J. Xu, K. Li, W. Shi, R. Li and T. Peng, J. Power Sources, 2014, 260, 233–242 CrossRef CAS.
- J. Zhao, Y. Yang, C. Cui, H. Hu, Y. Zhang, J. Xu, B. Lu, L. Xu, J. Pan and W. Tang, J. Alloys Compd., 2016, 663, 211–216 CrossRef CAS.
- X. P. Lin, D. M. Song, X. Q. Gu, Y. L. Zhao and Y. H. Qiang, Appl. Surf. Sci., 2012, 263, 816–820 CrossRef CAS.
- W. G. Yang, F. R. Wan, Q. W. Chen, J. J. Li and D. S. Xu, J. Mater. Chem., 2010, 20, 2870–2876 RSC.
- S. H. Han, S. Lee, H. Shin and H. S. Jung, Adv. Energy Mater., 2011, 1, 546–550 CrossRef CAS.
- N. Huang, L. Chen, H. Huang, W. Sun, S. Zhang, P. Sun, X. Sun, P. Xiang, Y. Sun and X. Zhao, Electrochim. Acta, 2015, 180, 280–286 CrossRef CAS.
- P. Ilaiyaraja, T. Kumar Das, P. S. V. Mocherla and C. Sudakar, Sol. Energy Mater. Sol. Cells, 2017, 169, 86–97 CrossRef CAS.
- G. Han, M. Wang, D. Li, J. Bai and G. Diao, Sol. Energy Mater. Sol. Cells, 2017, 160, 54–59 CrossRef CAS.
- M. Guo, J. Chen, J. Zhang, H. Su, L. Liu, N. Fu and K. Xie, Electrochim. Acta, 2018, 263, 373–381 CrossRef CAS.
- Z. Q. Li, L. E. Mo, W. C. Chen, X. Q. Shi, N. Wang, L. H. Hu, T. Hayat, A. Alsaedi and S. Y. Dai, ACS Appl. Mater. Interfaces, 2017, 9, 32026–32033 CrossRef CAS PubMed.
- D. H. Kim, W. M. Seong, I. J. Park, E.-S. Yoo, S. S. Shin, J. S. Kim, H. S. Jung, S. Lee and K. S. Hong, Nanoscale, 2013, 5, 11725–11732 RSC.
- W. Q. Wu, H. S. Rao, H. L. Feng, H. Y. Chen, D. B. Kuang and C. Y. Su, Nano Energy, 2014, 9, 15–24 CrossRef CAS.
- J. Xiao, P. Li and X. Wen, Nanotechnology, 2018, 29, 175603–175616 CrossRef PubMed.
- F. Zhao, R. Ma and Y. Jiang, Appl. Surf. Sci., 2018, 434, 11–15 CrossRef CAS.
- D. K. Roh, W. S. Chi, H. Jeon, S. J. Kim and J. H. Kim, Adv. Funct. Mater., 2014, 24, 379–386 CrossRef CAS.
- X. He, J. Liu, M. Zhu, Y. Guo, Z. Ren and X. Li, Electrochim. Acta, 2017, 255, 187–194 CrossRef CAS.
- J. Zhang, X. He, M. Zhu, Y. Guo and X. Li, J. Alloys Compd., 2018, 747, 729–737 CrossRef CAS.
- L. Wei, X. Xia, Y. Yang, P. Wang, Y. Dong and T. Luan, RSC Adv., 2016, 6, 68341–68350 RSC.
- C. K. Dong, W. C. Xiang, F. Z. Huang, D. C. Fu, W. C. Huang, U. Bach, Y. B. Cheng, X. Li and L. Spiccia, Nanoscale, 2014, 6, 3704–3711 RSC.
- J. S. Chen, Y. L. Tan, C. M. Li, Y. L. Cheah, D. Luan, S. Madhavi, F. Y. C. Boey, L. A. Archer and X. W. Lou, J. Am. Chem. Soc., 2010, 132, 6124–6130 CrossRef CAS PubMed.
- N. G. Park, J. van de Lagemaat and A. J. Frank, J. Phys. Chem. B, 2000, 104, 8989–8994 CrossRef CAS.
- J. Kullgren, H. Huynh Anh, B. Aradi, T. Frauenheim and P. Deak, Phys. Status Solidi RRL, 2014, 8, 566–570 CrossRef CAS.
- X. Li, H. Lin, J. Li, X. Li, B. Cui and L. Zhang, J. Phys. Chem. C, 2008, 112, 13744–13753 CrossRef CAS.
- K. Fan, W. Zhang, T. Peng, J. Chen and F. Yang, J. Phys. Chem. C, 2011, 115, 17213–17219 CrossRef CAS.
- A. Zaban, M. Greenshtein and J. Bisquert, ChemPhysChem, 2003, 4, 859–864 CrossRef CAS PubMed.
- T. Su, Y. Yang, Y. Na, R. Fan, L. Li, L. Wei, B. Yang and W. Cao, ACS Appl. Mater. Interfaces, 2015, 7, 3754–3763 CrossRef CAS PubMed.
- S. Venkatesan, E. S. Darlim, M.-H. Tsai, H. Teng and Y.-L. Lee, ACS Appl. Mater. Interfaces, 2018, 10, 10955–10964 CrossRef PubMed.
- R. Endo, H. D. Siriwardena, A. Kondo, C. Yamamoto and M. Shimomura, Appl. Surf. Sci., 2018, 439, 954–962 CrossRef CAS.
- H. Li, Q. Xie, R. Wang, J. Li, Z. Xie and H. Tang, Appl. Surf. Sci., 2018, 439, 1026–1033 CrossRef CAS.
- S. Wanwong, W. Sangkhun and J. Wootthikanokkhan, RSC Adv., 2018, 8, 9202–9210 RSC.
- G. Wang, X. Zhu and J. Yu, J. Power Sources, 2015, 278, 344–351 CrossRef CAS.
- B. Tang, G. Ji, Z. Wang, H. Chen, X. Li, H. Yu, S. Li and H. Liu, RSC Adv., 2017, 7, 45280–45286 RSC.
- W. M. Girma, C.-H. Chen, C.-H. Yang, P.-I. Wang, K.-L. Ou, D.-J. Liaw and J.-Y. Chang, RSC Adv., 2017, 7, 7671–7678 RSC.
- Y. Wang, X. Liu, Z. Li, Y. Cao, Y. Li and Y. Zhao, ChemNanoMat, 2017, 3, 58–64 CrossRef CAS.
- Y. Dou, F. Wu, L. Fang, G. Liu, C. Mao, K. Wan and M. Zhou, J. Power Sources, 2016, 307, 181–189 CrossRef CAS.
- M. Zhu, X. Li, W. Liu and Y. Cui, J. Power Sources, 2014, 262, 349–355 CrossRef CAS.
- F. Fabregat-Santiago, J. Bisquert, E. Palomares, L. Otero, D. Kuang, S. M. Zakeeruddin and M. Gratzel, J. Phys. Chem. C, 2007, 111, 6550–6560 CrossRef CAS.
- J. Bisquert, J. Phys. Chem. B, 2002, 106, 325–333 CrossRef CAS.
- C. Dong, W. Xiang, F. Huang, D. Fu, W. Huang, U. Bach, Y.-B. Cheng, X. Li and L. Spiccia, Angew. Chem., Int. Ed., 2014, 53, 6933–6937 CrossRef CAS PubMed.
- Y. P. Lin, S. Y. Lin, Y. C. Lee and Y. W. Chen-Yang, J. Mater. Chem. A, 2013, 1, 9875–9884 RSC.
- X. p. Sun, Q. Zhang, Y. Liu, N. Huang, P. Sun, T. Peng, T. Peng and X.-Z. Zhao, Electrochim. Acta, 2014, 129, 276–282 CrossRef CAS.
- M. H. Abdullah and M. Rusop, J. Alloys Compd., 2014, 600, 60–66 CrossRef CAS.
Footnote |
| † Electronic supplementary information (ESI) available. See DOI: 10.1039/c8ra09145e |
| This journal is © The Royal Society of Chemistry 2019 |

